Bitcoin Liquidation Map: Where Is the Liquidity?
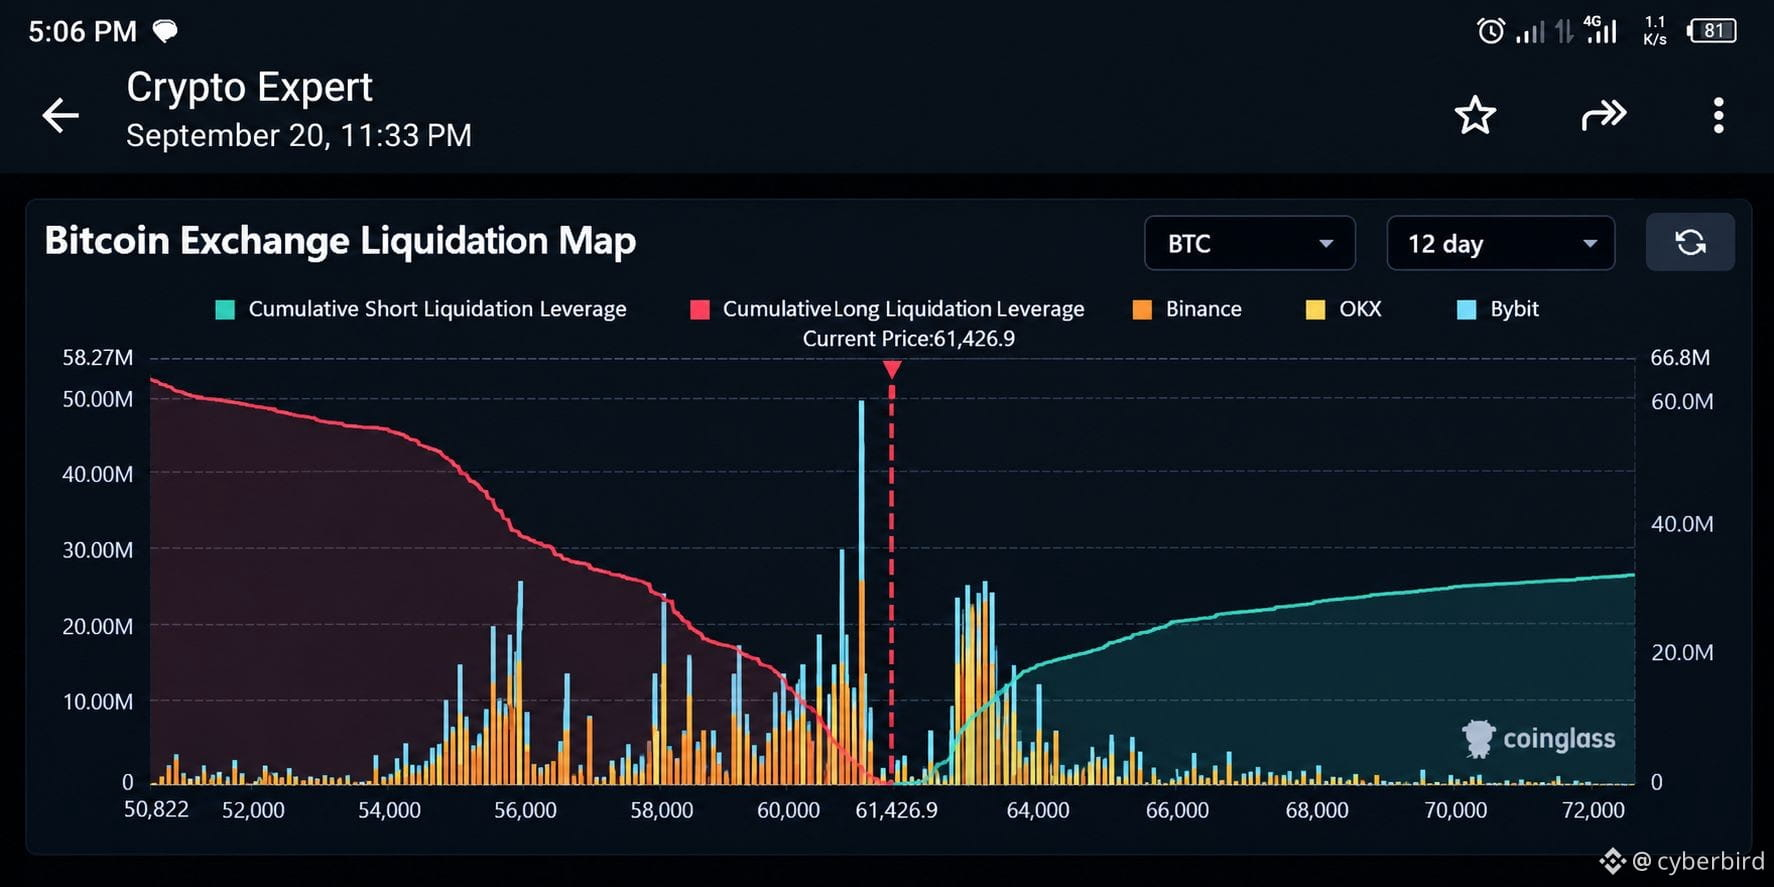
Bitcoin’s liquidation map shows a significant concentration of leveraged positions around the current price. Large liquidation clusters can act as important liquidity zones because sharp price moves may trigger forced position closures. Traders should watch both sides of the map rather than assuming price must move toward the larger cluster. A liquidity sweep can happen quickly, especially during high-volatility periods. This data is useful alongside price action, open interest, funding rates, support/resistance and volume. Always manage leverage carefully because liquidation maps indicate potential liquidity—not a guaranteed direction for BTC.
#ONE/USDT
Bitcoin’s liquidation map shows a significant concentration of leveraged positions around the current price. Large liquidation clusters can act as important liquidity zones because sharp price moves may trigger forced position closures. Traders should watch both sides of the map rather than assuming price must move toward the larger cluster. A liquidity sweep can happen quickly, especially during high-volatility periods. This data is useful alongside price action, open interest, funding rates, support/resistance and volume. Always manage leverage carefully because liquidation maps indicate potential liquidity—not a guaranteed direction for BTC.
#ONE/USDT