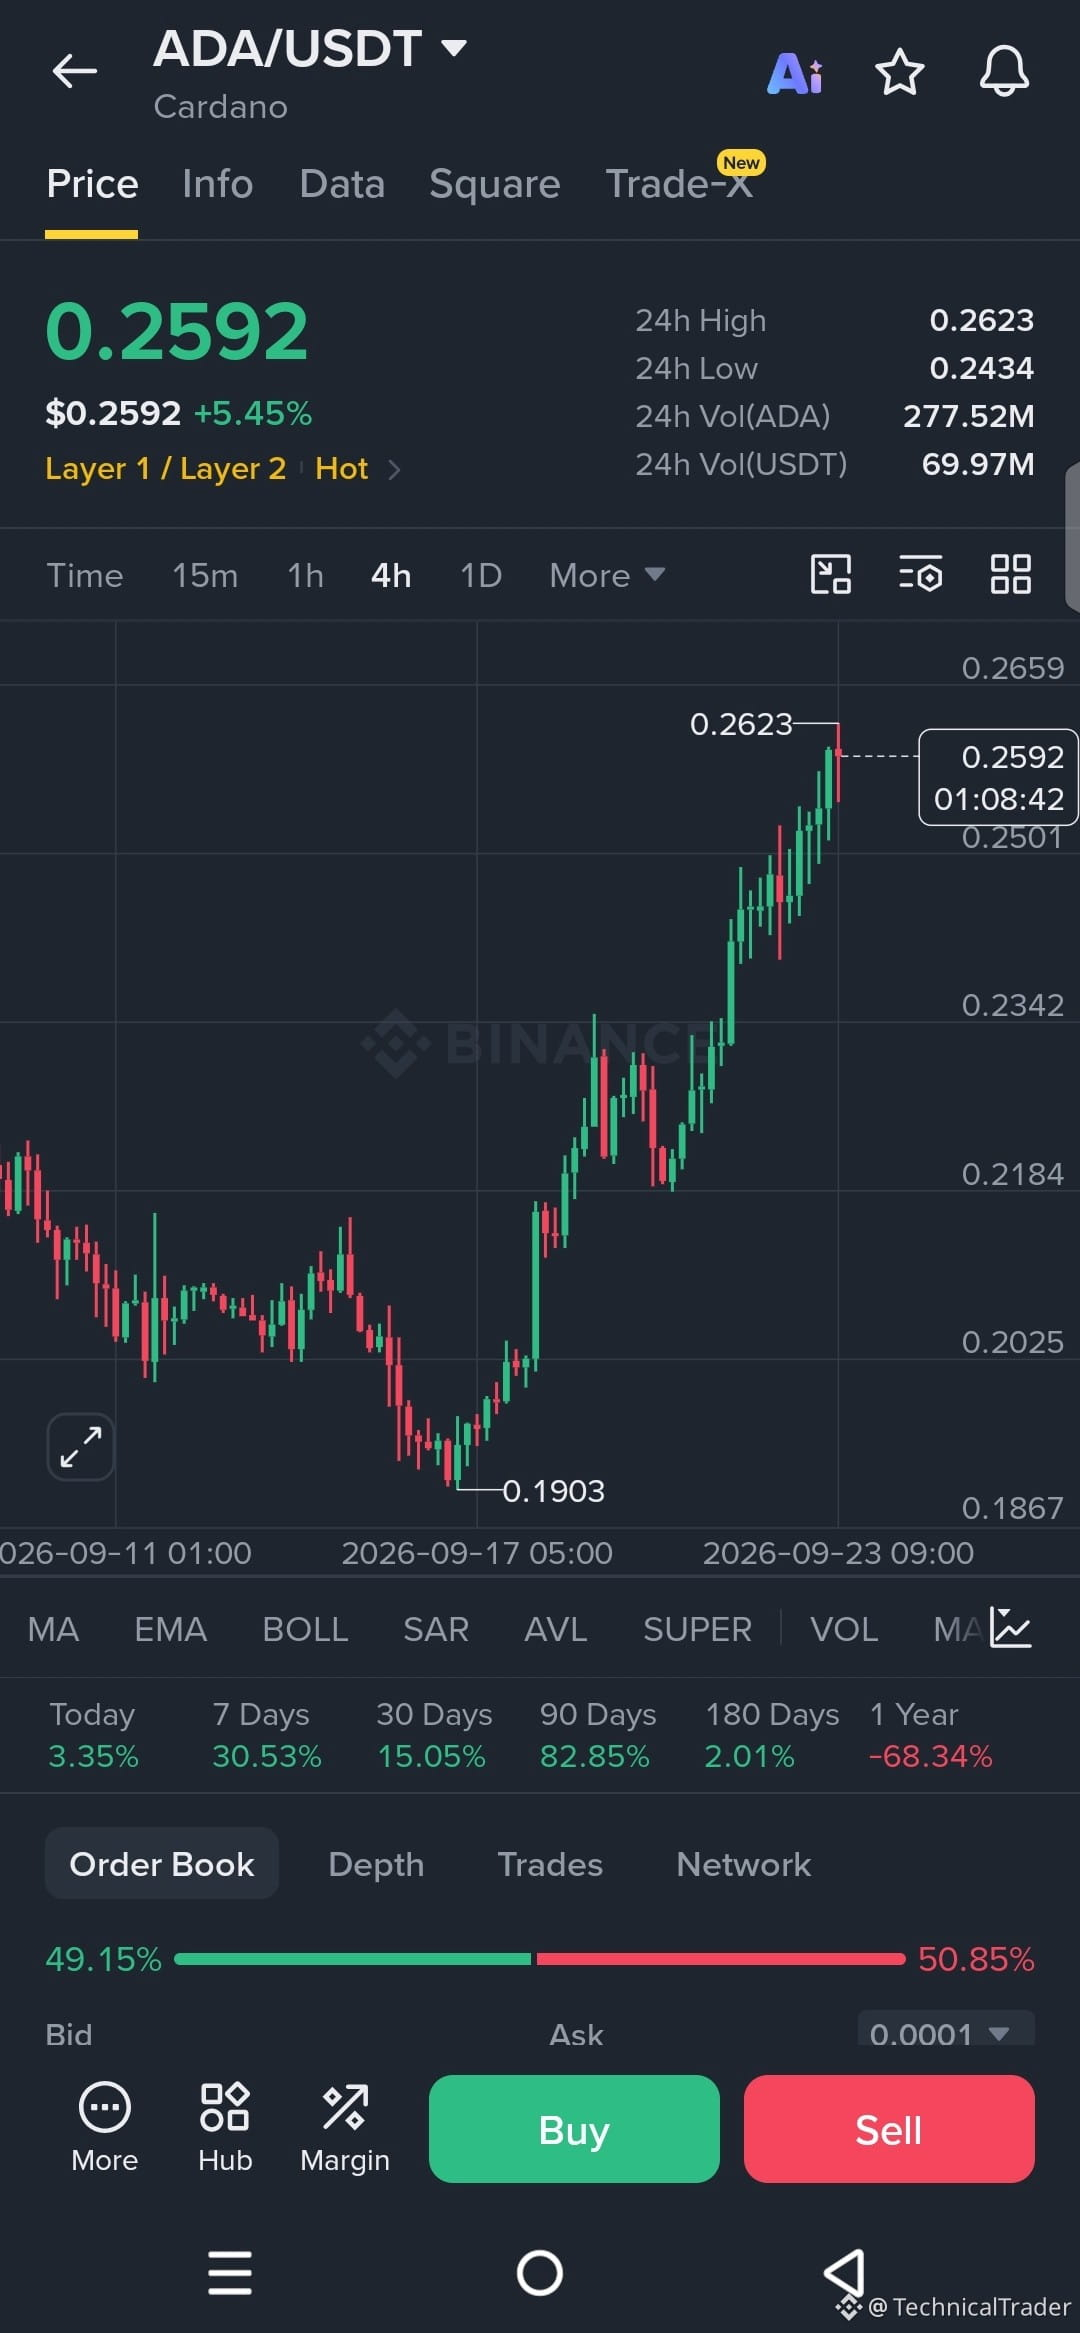
$ADA just printed a clean push into 0.2623 and is holding right under it at 0.2592.
Look at this 4h chart. Price dropped hard into that 0.1903 low, then started printing higher lows and higher highs. The structure flipped bullish and the move has been aggressive ever since. We’ve gone from that bottom all the way up without any real deep pullback.
The recent high at 0.2623 is the clear level everyone is watching. Price tapped it and is currently sitting just underneath. Below that, the area around 0.2430–0.2500 acted as support during the climb and looks like the first real demand zone if we get a deeper retrace. Further down, that 0.2180–0.2200 zone is another important level from the earlier structure.
Bullish side is simple: as long as price stays above the recent higher lows and holds this current structure, another push through 0.2623 opens the door for continuation. A clean break and hold above that high would confirm the next leg up.
Bearish side only kicks in if we lose the current higher low structure and start seeing lower highs. A drop back under 0.2430 would be the first real warning that the momentum is fading.
Right now the chart is still in control of the buyers. I’m watching how price reacts around this 0.2590–0.2623 zone. A strong rejection here or a clean break above it will tell us the next move.
Guys, follow for more chart analysis 😎 I’ll keep showing you exactly what the chart is telling us. 👀🔥
Look at this 4h chart. Price dropped hard into that 0.1903 low, then started printing higher lows and higher highs. The structure flipped bullish and the move has been aggressive ever since. We’ve gone from that bottom all the way up without any real deep pullback.
The recent high at 0.2623 is the clear level everyone is watching. Price tapped it and is currently sitting just underneath. Below that, the area around 0.2430–0.2500 acted as support during the climb and looks like the first real demand zone if we get a deeper retrace. Further down, that 0.2180–0.2200 zone is another important level from the earlier structure.
Bullish side is simple: as long as price stays above the recent higher lows and holds this current structure, another push through 0.2623 opens the door for continuation. A clean break and hold above that high would confirm the next leg up.
Bearish side only kicks in if we lose the current higher low structure and start seeing lower highs. A drop back under 0.2430 would be the first real warning that the momentum is fading.
Right now the chart is still in control of the buyers. I’m watching how price reacts around this 0.2590–0.2623 zone. A strong rejection here or a clean break above it will tell us the next move.
Guys, follow for more chart analysis 😎 I’ll keep showing you exactly what the chart is telling us. 👀🔥