Technical Analysis Overview (ETH/USDT Spot)#ETH #BNB $ETH
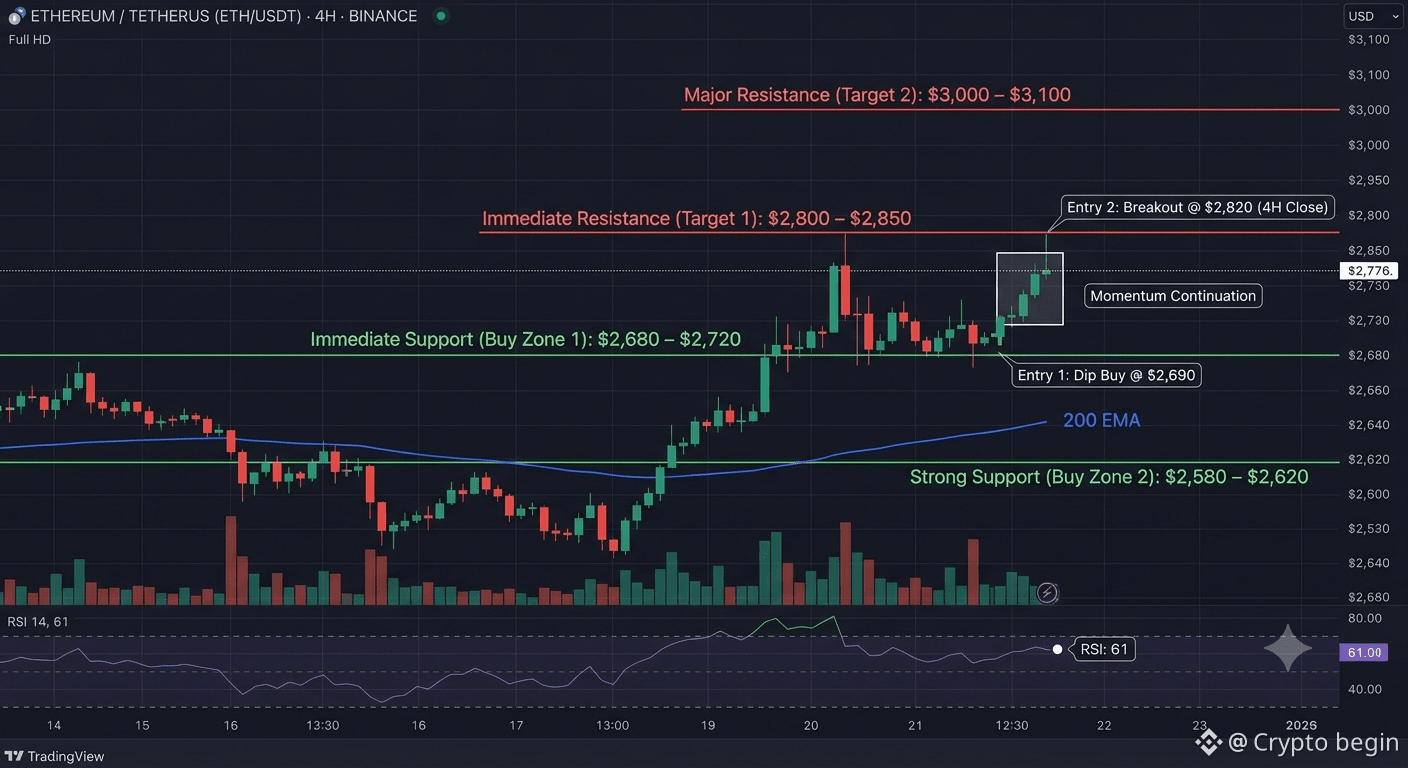
Ethereum is currently demonstrating short-term bullish momentum. The price is testing immediate resistance near $2,800 after rebounding from the $2,600 region.
Current Live Price: $2,776 USD (September 23, 2026)
RSI (14, Daily): ~60 (Moderate momentum, room for further upside before becoming overbought)
200-Day EMA: $2,640 (Serves as primary trend support)
Trend: Short-term Bullish / Medium-term Consolidation
Key Technical Levels
Level TypePrice Range (USD)Technical Significance
Major Resistance (Target 2)$3,000 – $3,100Major psychological boundary and previous structure high.
Immediate Resistance (Target 1)$2,800 – $2,850Local supply zone; a 4H close above confirms momentum.
Immediate Support (Buy Zone 1)$2,680 – $2,720Re-test level / short-term demand zone.
Strong Support (Buy Zone 2)$2,580 – $2,620Key structural support backed by the 200 EMA confluence.
Invalidation (Stop Loss)$2,550Breakdown below invalidates the short-term bullish setup.
$ETH
Ethereum is currently demonstrating short-term bullish momentum. The price is testing immediate resistance near $2,800 after rebounding from the $2,600 region.
Current Live Price: $2,776 USD (September 23, 2026)
RSI (14, Daily): ~60 (Moderate momentum, room for further upside before becoming overbought)
200-Day EMA: $2,640 (Serves as primary trend support)
Trend: Short-term Bullish / Medium-term Consolidation
Key Technical Levels
Level TypePrice Range (USD)Technical Significance
Major Resistance (Target 2)$3,000 – $3,100Major psychological boundary and previous structure high.
Immediate Resistance (Target 1)$2,800 – $2,850Local supply zone; a 4H close above confirms momentum.
Immediate Support (Buy Zone 1)$2,680 – $2,720Re-test level / short-term demand zone.
Strong Support (Buy Zone 2)$2,580 – $2,620Key structural support backed by the 200 EMA confluence.
Invalidation (Stop Loss)$2,550Breakdown below invalidates the short-term bullish setup.
$ETH