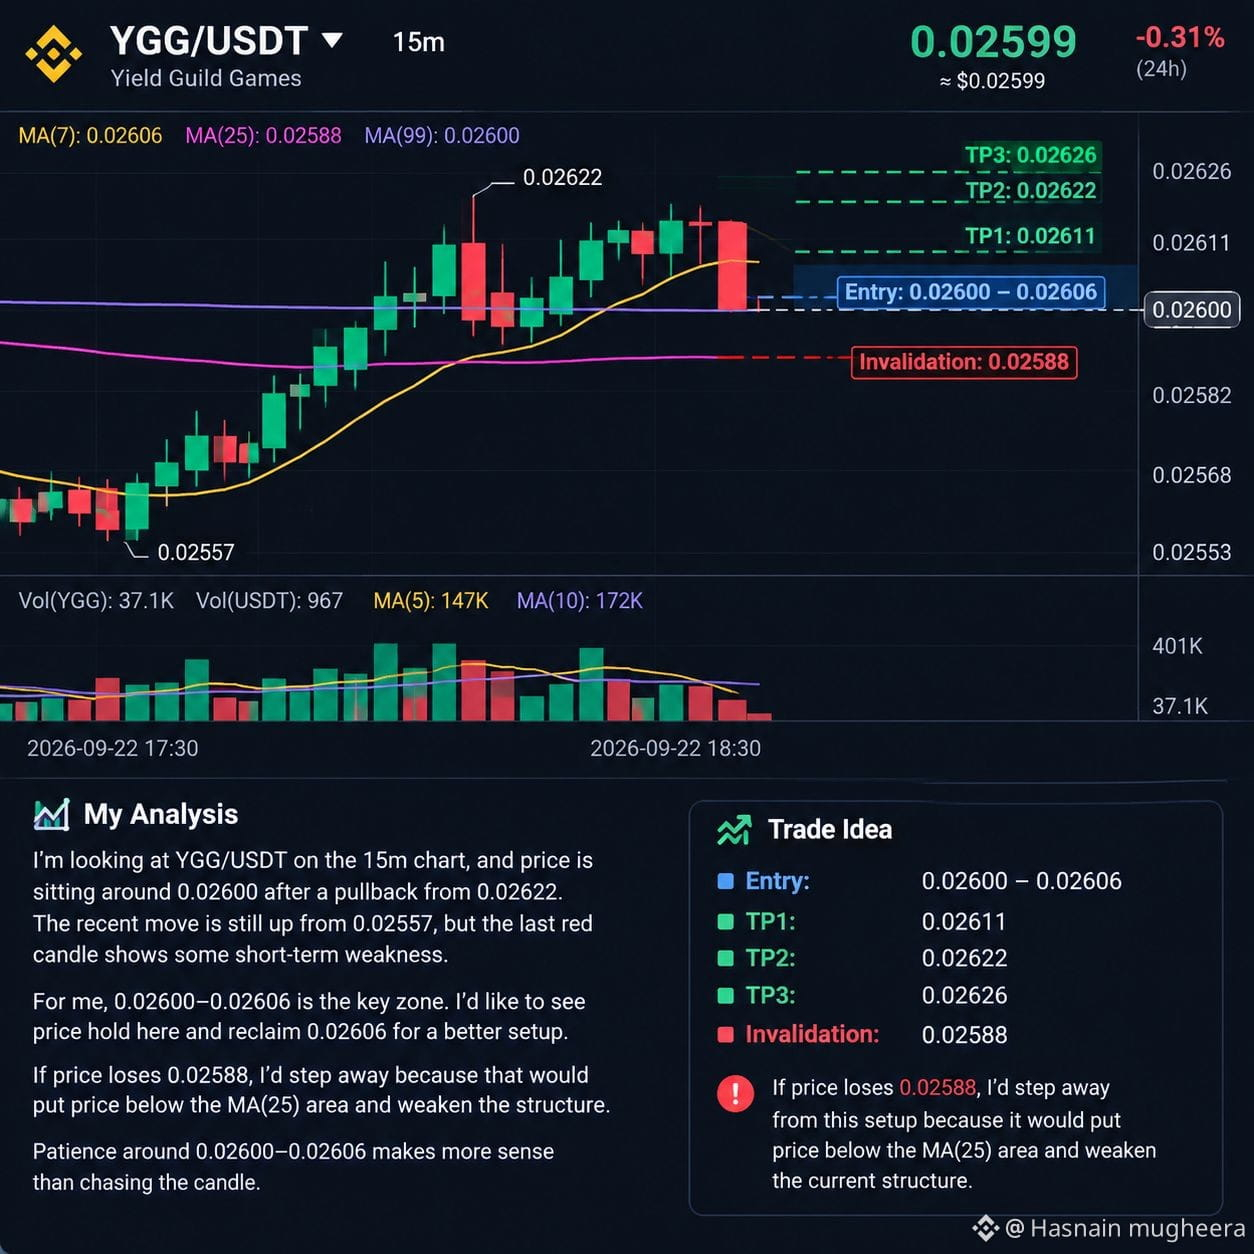
I’m looking at $YGG /USDT on the 15m chart, and price is sitting right around 0.02600 after a pullback from the 0.02622 area. For me, this is a key decision zone because the price is close to MA(99) at 0.02600 while MA(7) is slightly higher at 0.02606.
The recent structure still shows a move up from 0.02557, but the latest red candle shows some short-term weakness. I’d like to see price hold around 0.02600 and reclaim 0.02606 before considering the setup attractive.
📍 Entry: 0.02600–0.02606
🎯 TP1: 0.02611
🎯 TP2: 0.02622
🎯 TP3: 0.02626
🛑 Invalidation: 0.02588
If price loses 0.02588, I’d step away from this setup because that would put price below the visible MA(25) area and weaken the current structure.
The 0.02622 level is especially important because it’s the clearly marked recent high. I’m not assuming a breakout will happen; I’d rather see price reclaim the nearby moving-average area first and then test that high.
For me, patience around 0.02600–0.02606 makes more sense than chasing the candle.
The recent structure still shows a move up from 0.02557, but the latest red candle shows some short-term weakness. I’d like to see price hold around 0.02600 and reclaim 0.02606 before considering the setup attractive.
📍 Entry: 0.02600–0.02606
🎯 TP1: 0.02611
🎯 TP2: 0.02622
🎯 TP3: 0.02626
🛑 Invalidation: 0.02588
If price loses 0.02588, I’d step away from this setup because that would put price below the visible MA(25) area and weaken the current structure.
The 0.02622 level is especially important because it’s the clearly marked recent high. I’m not assuming a breakout will happen; I’d rather see price reclaim the nearby moving-average area first and then test that high.
For me, patience around 0.02600–0.02606 makes more sense than chasing the candle.