
#Ethereum #TradingAnalysis #$ETH $


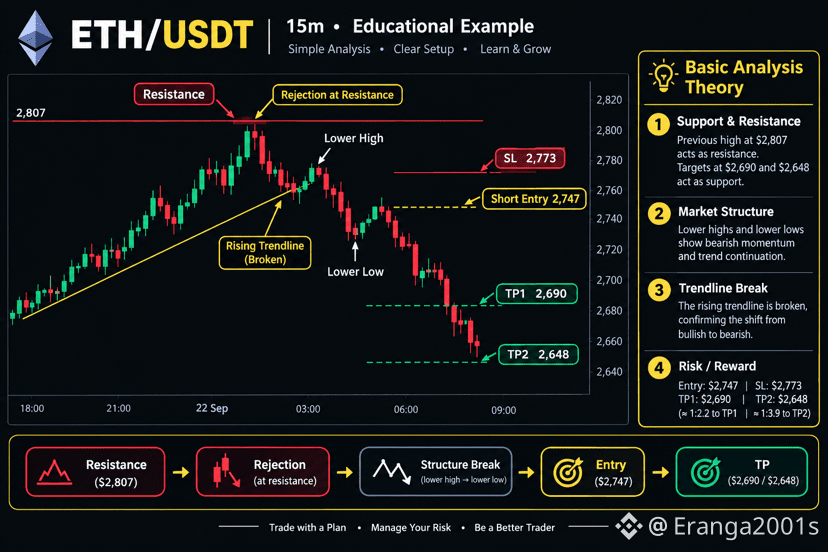
Entry: $2,747.30
SL: $2,773
TP1: $2,690
TP2: $2,648
Leverage: 3× max
Reason: price is below the MA(7) and MA(25), with rejection after the $2,807 high.
Confirmation: wait for rejection/retest around the entry rather than entering blindly.

This analysis uses a confluence-based technical analysis strategy rather than one single theory.
The 5 theories/concepts used
01.Moving Average Theory
MA(7), MA(25), and MA(99)
Price below MA(7) and MA(25) = short-term bearish pressure.
MA(99) acts as a longer-term reference/support.
02.Support & Resistance Theory
Previous high $2,807.34 is treated as resistance.
$2,690 and $2,648 are potential support areas.
03.Market Structure Theory
The chart shows a shift from an upward structure toward lower highs/lower lows.
This is used to identify potential bearish continuation.
04.Trend line Break / Retest
The previous rising trendline is broken.
A subsequent retest/rejection can provide confirmation for a short setup.
05.Risk–Reward Theory
Entry: $2,747
SL: $2,773TP1: $2,690
TP2: $2,648
The overall model
Resistance → rejection → MA confirmation → trendline/structure break → retest → entry → support targets
This is commonly described as a confluence technical-analysis setup. The individual signals are stronger when they point in the same direction, but none guarantees the trade outcome.