#cryptotradingpro #BTC
🚀 $BTC /USD: Technical Analysis and Liquidity Map (4H)
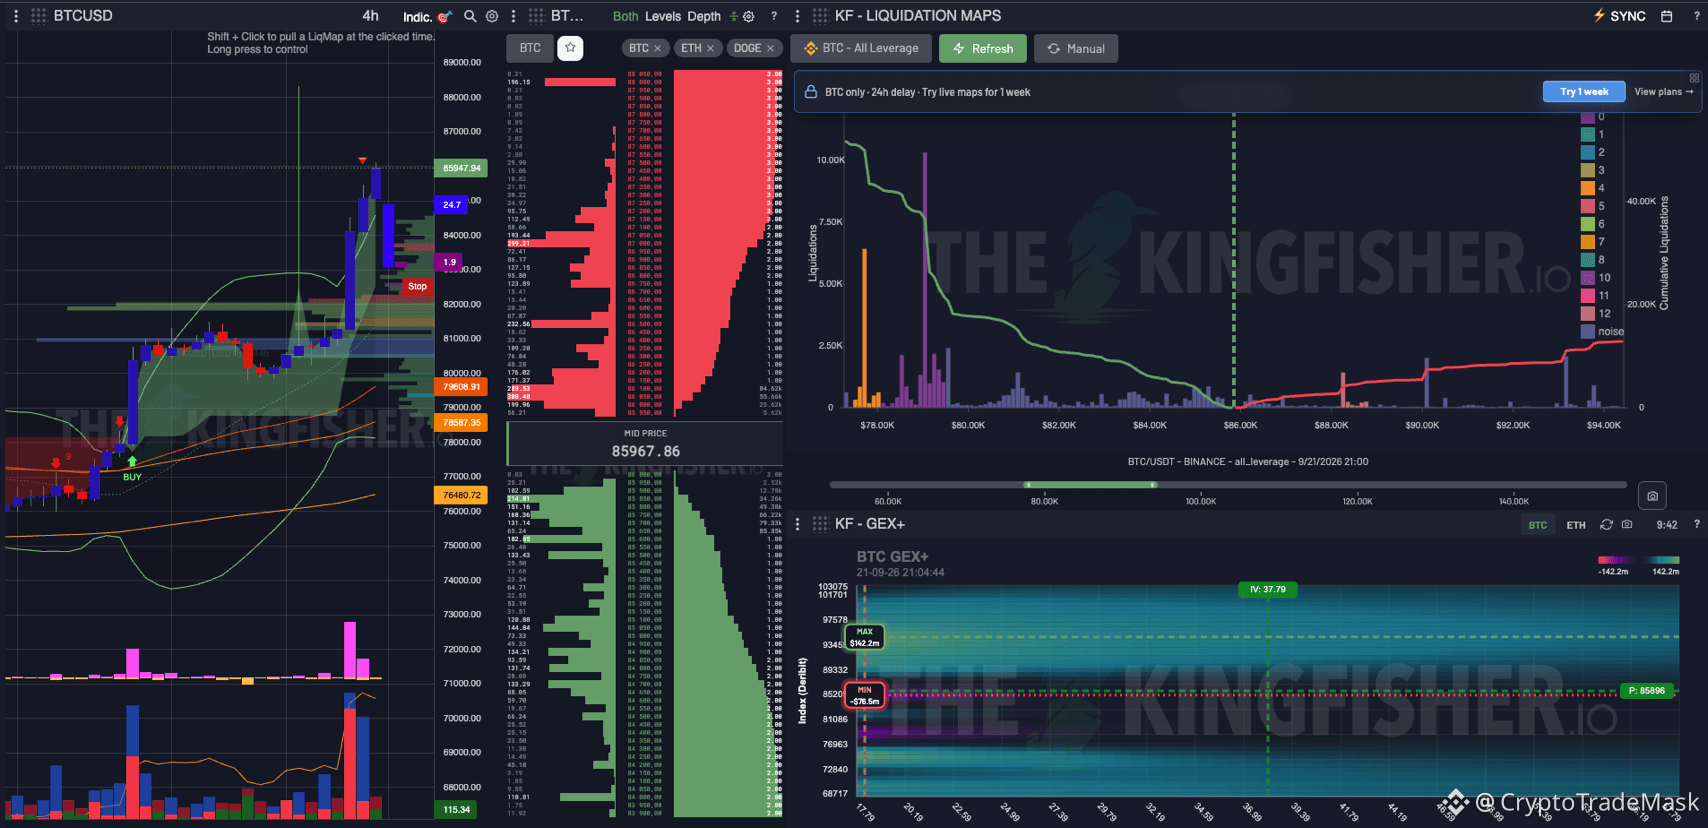
Bitcoin maintains its bullish momentum, trading around $85,960 following a strong upward surge. Let’s break down where the "big money" is currently positioned and where the price might head next:
📌 Key Levels and Technical Outlook:
• Resistance: $88,000 – $89,000 (local high)
• Initial Support: $83,000 – $84,500
• Major Support: $78,500 – $80,000
📊 Liquidity Map Insights:
1️⃣ Short Liquidity (Upper Zone):
A pool of short position liquidations extends from $88,000 to $94,000+. Additionally, GEX+ metrics place the MAX Gamma level above $93,400, acting as a strong price "magnet" in the event of an upward breakout.
2️⃣ Long Liquidity (Lower Zone):
The highest concentration of stop-losses and long liquidations is located lower down—in the $76,000 – $78,000 range.
🚦 Key Scenarios:
🟢 Primary Scenario (Bullish):
Holding the $84,000 – $85,000 zone, followed by a breakout above $88,000. Metrics indicate a potential cascade of short liquidations with targets in the $90,000 – $94,000 range.
🔴 Alternative Scenario (Correction):
A loss of support at $84,000 could trigger a local drop to the $78,000–$80,000 range to "shake out" excessive leveraged long positions before further upside.
⚠️ Summary: The overall market structure remains bullish. We are monitoring the price reaction near the $84,000 support level and how the local range plays out!
🚀 $BTC /USD: Technical Analysis and Liquidity Map (4H)
Bitcoin maintains its bullish momentum, trading around $85,960 following a strong upward surge. Let’s break down where the "big money" is currently positioned and where the price might head next:
📌 Key Levels and Technical Outlook:
• Resistance: $88,000 – $89,000 (local high)
• Initial Support: $83,000 – $84,500
• Major Support: $78,500 – $80,000
📊 Liquidity Map Insights:
1️⃣ Short Liquidity (Upper Zone):
A pool of short position liquidations extends from $88,000 to $94,000+. Additionally, GEX+ metrics place the MAX Gamma level above $93,400, acting as a strong price "magnet" in the event of an upward breakout.
2️⃣ Long Liquidity (Lower Zone):
The highest concentration of stop-losses and long liquidations is located lower down—in the $76,000 – $78,000 range.
🚦 Key Scenarios:
🟢 Primary Scenario (Bullish):
Holding the $84,000 – $85,000 zone, followed by a breakout above $88,000. Metrics indicate a potential cascade of short liquidations with targets in the $90,000 – $94,000 range.
🔴 Alternative Scenario (Correction):
A loss of support at $84,000 could trigger a local drop to the $78,000–$80,000 range to "shake out" excessive leveraged long positions before further upside.
⚠️ Summary: The overall market structure remains bullish. We are monitoring the price reaction near the $84,000 support level and how the local range plays out!