
Sharp Breakdown Test: $NVO Approaching Oversold Demand Zone
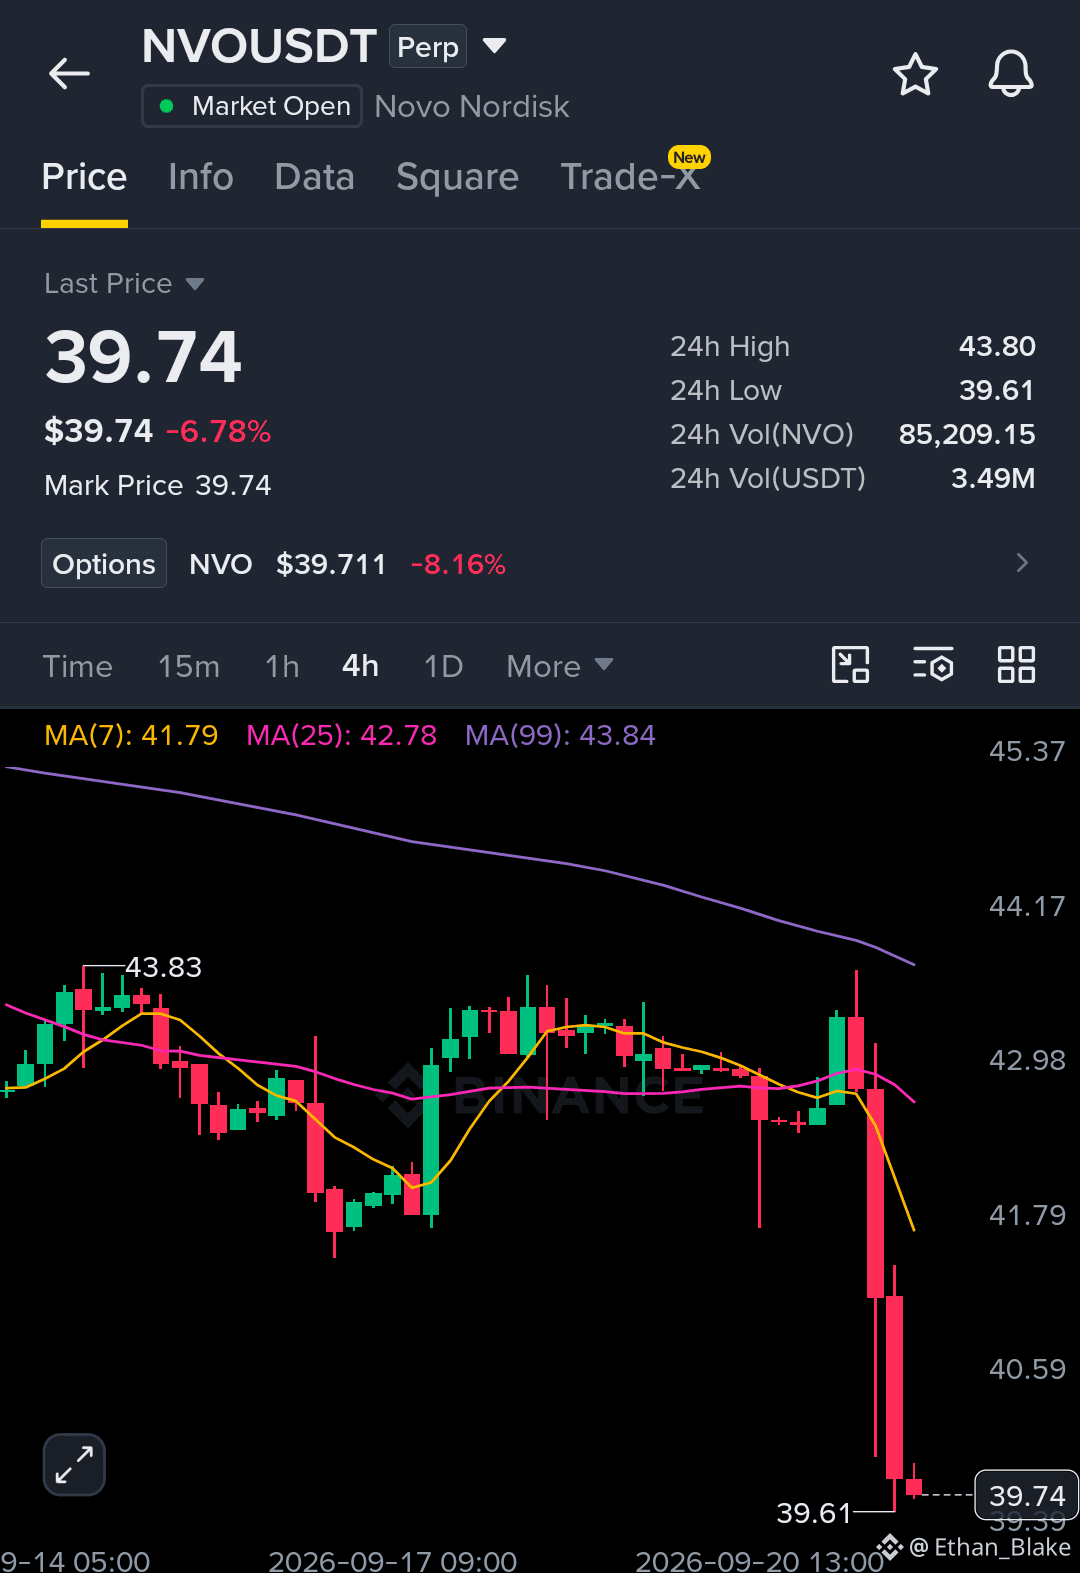
The 4-hour chart displays a severe downward breakdown, plummeting from the $43.80 high to hit a low of $39.61. Price action is currently consolidating near $39.74 down -6.78% on the session, testing multi-session support levels as sellers maintain tight control.
Short Setup
EP: $39.80 - $41.50 TP1: $38.50 TP2: $37.00 TP3: $35.20 SL: $42.80
Why This Setup
The rapid downward breakdown on the 4-hour chart has created a clear bearish crossover beneath all key moving averages. The MA(7) at $41.79 and MA(25) at $42.78 have both sharply sloped downward under the baseline MA(99) at $43.84, confirming intense selling momentum overriding prior range support.
Trading volume stands at 3.49M USDT (85.20K NVO), reflecting persistent downside pressure during this breakdown phase. As long as price action remains suppressed beneath the $41.80 resistance level, a continuation push to break below the immediate $39.61 low remains high probability.
Click the trading pair widget below to execute your setup before the next momentum leg expands.$NVO
The 4-hour chart displays a severe downward breakdown, plummeting from the $43.80 high to hit a low of $39.61. Price action is currently consolidating near $39.74 down -6.78% on the session, testing multi-session support levels as sellers maintain tight control.
Short Setup
EP: $39.80 - $41.50 TP1: $38.50 TP2: $37.00 TP3: $35.20 SL: $42.80
Why This Setup
The rapid downward breakdown on the 4-hour chart has created a clear bearish crossover beneath all key moving averages. The MA(7) at $41.79 and MA(25) at $42.78 have both sharply sloped downward under the baseline MA(99) at $43.84, confirming intense selling momentum overriding prior range support.
Trading volume stands at 3.49M USDT (85.20K NVO), reflecting persistent downside pressure during this breakdown phase. As long as price action remains suppressed beneath the $41.80 resistance level, a continuation push to break below the immediate $39.61 low remains high probability.
Click the trading pair widget below to execute your setup before the next momentum leg expands.$NVO