ZEC IS ABSOLUTELY INSANE
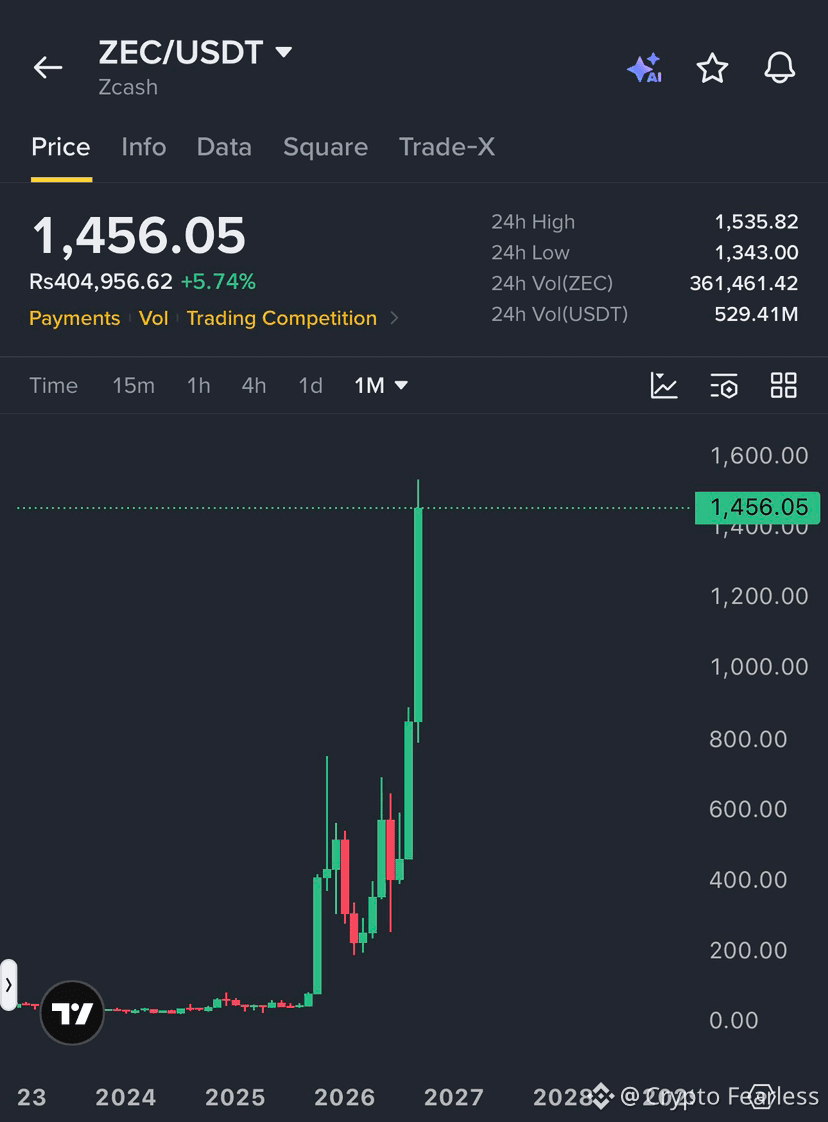
Look at this monthly chart.
$ZEC spent years trading at relatively low levels, then the structure completely changed. After breaking out, the move accelerated from the $200–$400 area to above $1,400.
Right now, the chart shows:
Current price: ~$1,456
24H high: $1,535
24H volume: ~$529M
Recent momentum: extremely strong
The crazy part is the speed of this move. ZEC has gone through multiple major resistance zones in a very short period, and the latest candles show aggressive buying pressure. Recent market data also shows ZEC trading around the $1.5K area, with strong gains over the past several sessions.
But here is the important part:
A massive pump does NOT mean straight up forever.
After a move this large, volatility can become extreme. A pullback, consolidation, or sharp wick would not be surprising.
The levels I’m watching
$1,500–$1,535: immediate resistance / breakout area
$1,400: important psychological level
$1,200–$1,300: potential pullback zone
$1,000: major psychological support if a deeper correction comes
If ZEC can hold the higher levels after a breakout, the monthly structure remains very interesting.
But chasing a vertical candle is where many traders get trapped.
ZEC just reminded the market why crypto can create life-changing moves — but the same volatility can destroy overleveraged traders just as quickly.
Not financial advice. Manage risk.
$ZEC
Look at this monthly chart.
$ZEC spent years trading at relatively low levels, then the structure completely changed. After breaking out, the move accelerated from the $200–$400 area to above $1,400.
Right now, the chart shows:
Current price: ~$1,456
24H high: $1,535
24H volume: ~$529M
Recent momentum: extremely strong
The crazy part is the speed of this move. ZEC has gone through multiple major resistance zones in a very short period, and the latest candles show aggressive buying pressure. Recent market data also shows ZEC trading around the $1.5K area, with strong gains over the past several sessions.
But here is the important part:
A massive pump does NOT mean straight up forever.
After a move this large, volatility can become extreme. A pullback, consolidation, or sharp wick would not be surprising.
The levels I’m watching
$1,500–$1,535: immediate resistance / breakout area
$1,400: important psychological level
$1,200–$1,300: potential pullback zone
$1,000: major psychological support if a deeper correction comes
If ZEC can hold the higher levels after a breakout, the monthly structure remains very interesting.
But chasing a vertical candle is where many traders get trapped.
ZEC just reminded the market why crypto can create life-changing moves — but the same volatility can destroy overleveraged traders just as quickly.
Not financial advice. Manage risk.
$ZEC