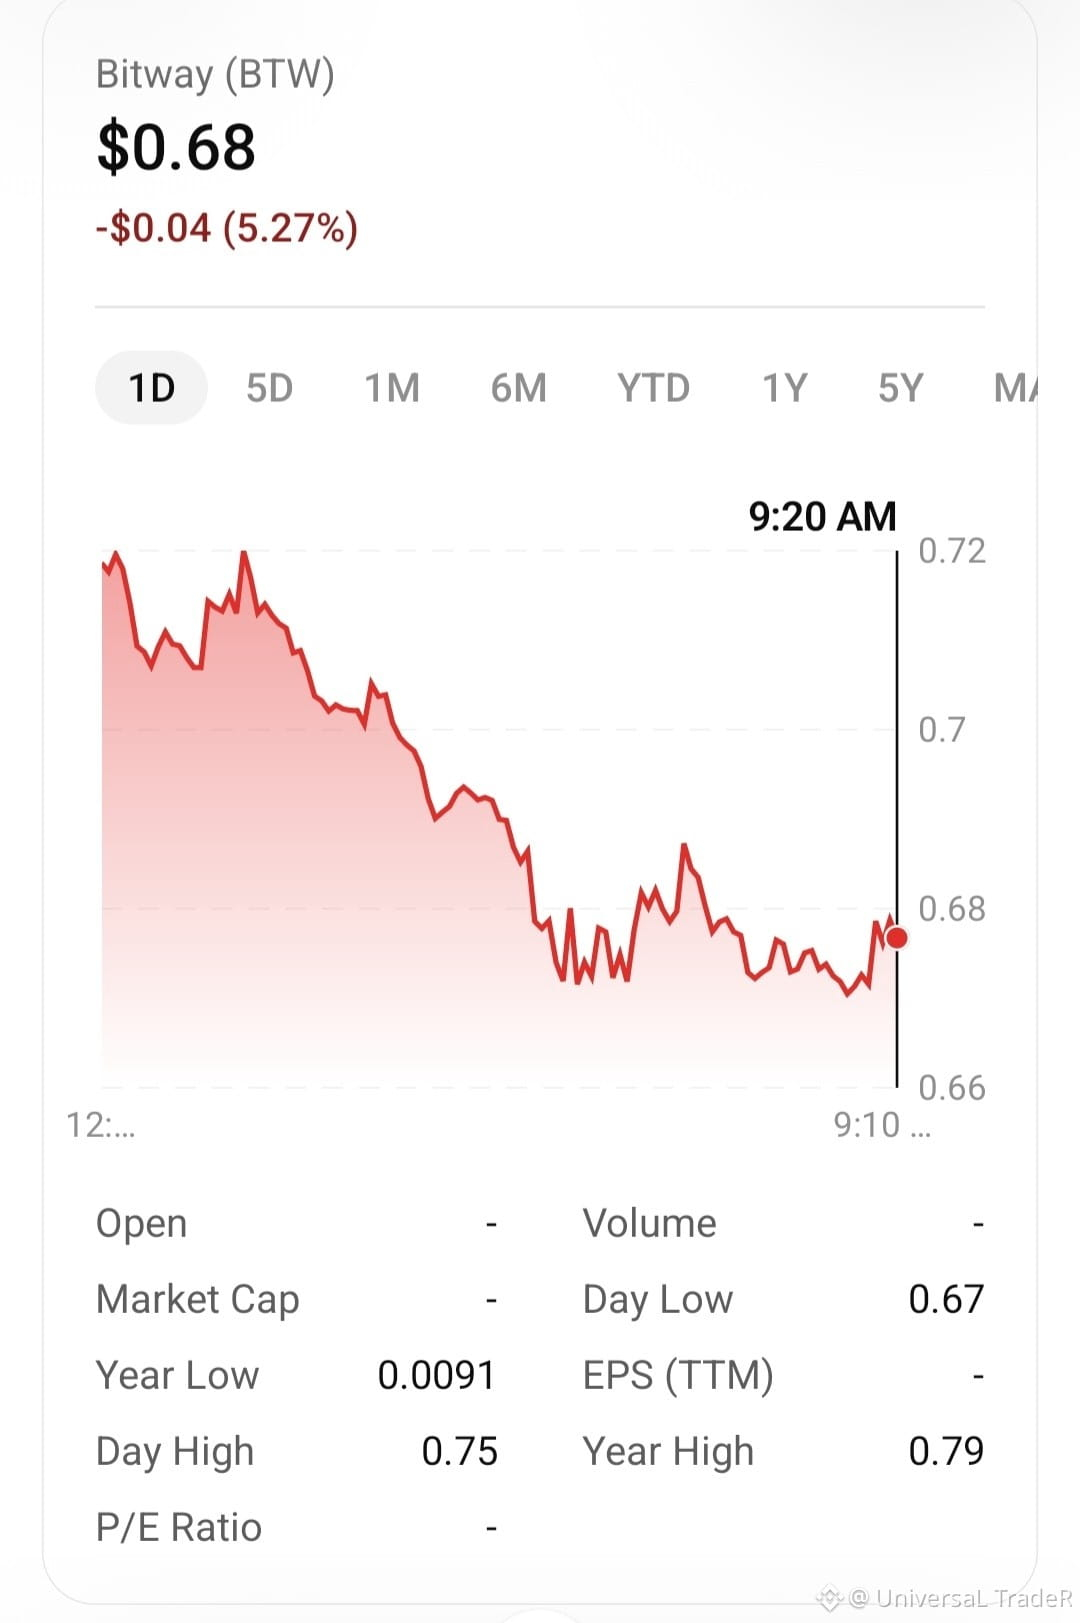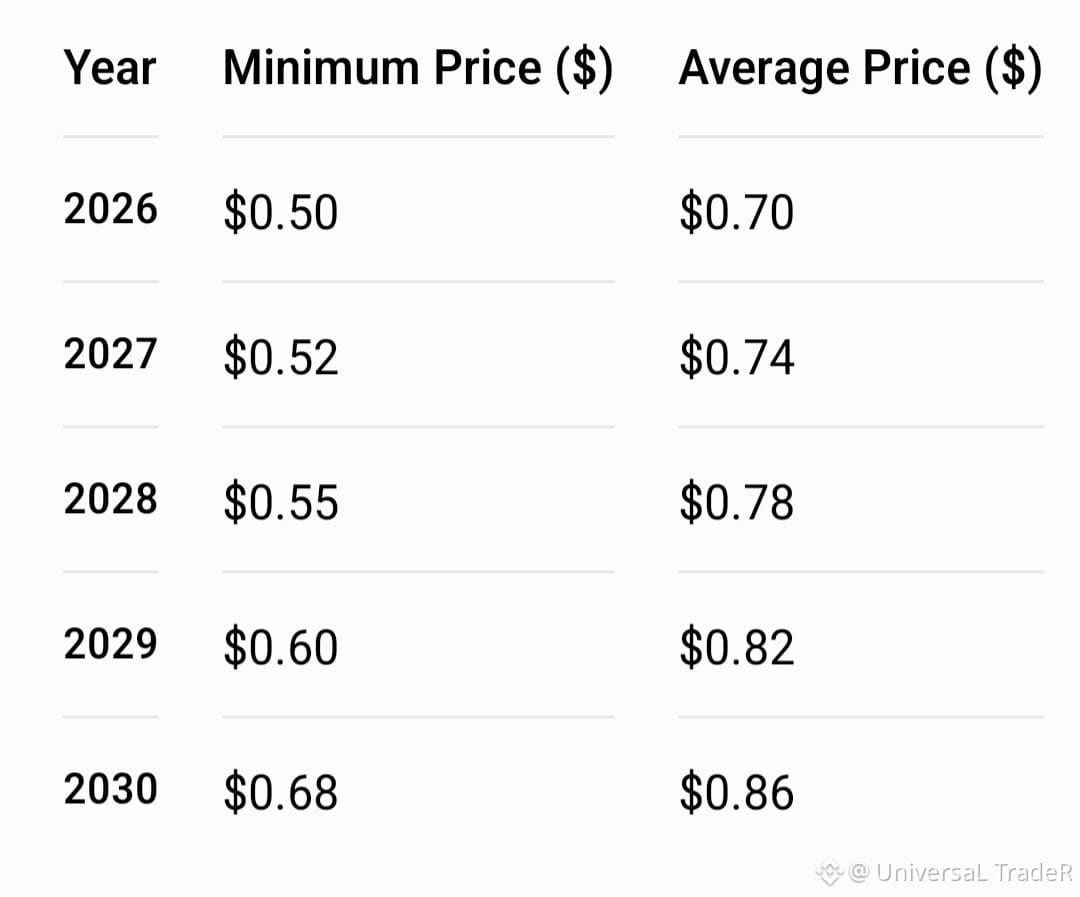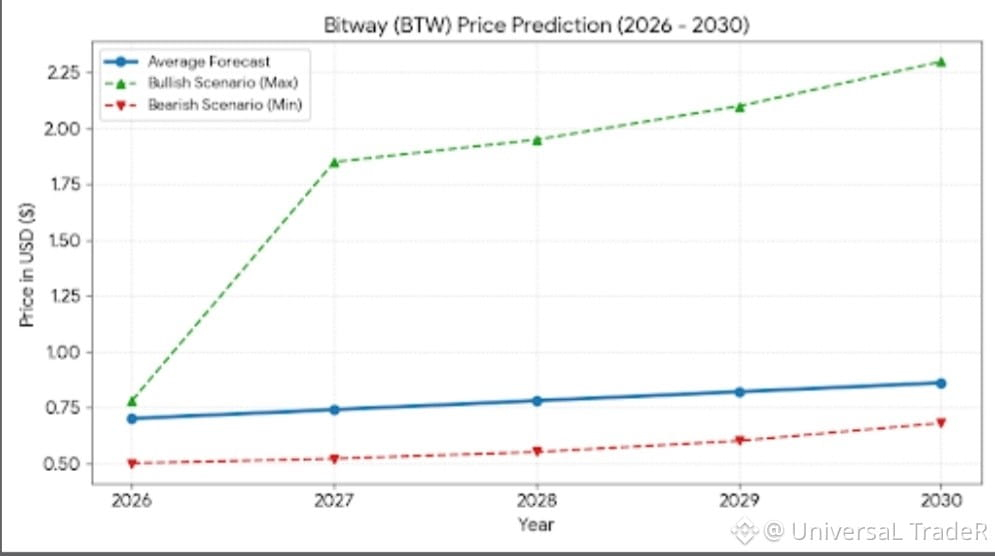
Bitway #BTW trades in the $0.45–$0.70 USD range, showing strong mid-term momentum alongside high market volatility. Forecast models project baseline price stability through 2026, with potential bullish expansion toward 2030.
#BTW (Bitway) Price Prediction — 2026
As of 18 September 2026,#BTW is around $0.68. Recent data shows strong volatility: CMC reports a recent move around the $0.70 area, with $0.70 as an important near-term support and roughly $0.776 as a recent resistance area.
Key levels to watch
Support: $0.70, then $0.65
Resistance: $0.776, then $0.90–$1.00
A sustained move above $0.90 would materially change the technical picture.
Technical Indicators & Dynamics
Moving Averages (50-Day SMA / EMA): The 50-day moving average sits near $0.37–$0.41. Price action staying above this baseline indicates short-term bullish control.
Relative Strength Index (RSI): The 14-day RSI hovers near 65–70, reflecting elevated buying momentum near the overbought threshold.
Support & Resistance Levels: Immediate key resistance sits at $0.78–$0.80, with major downside support around $0.62 and $0.50.
#BTW (Bitway) Price Prediction — 2026
As of 18 September 2026,#BTW is around $0.68. Recent data shows strong volatility: CMC reports a recent move around the $0.70 area, with $0.70 as an important near-term support and roughly $0.776 as a recent resistance area.
Key levels to watch
Support: $0.70, then $0.65
Resistance: $0.776, then $0.90–$1.00
A sustained move above $0.90 would materially change the technical picture.
Technical Indicators & Dynamics
Moving Averages (50-Day SMA / EMA): The 50-day moving average sits near $0.37–$0.41. Price action staying above this baseline indicates short-term bullish control.
Relative Strength Index (RSI): The 14-day RSI hovers near 65–70, reflecting elevated buying momentum near the overbought threshold.
Support & Resistance Levels: Immediate key resistance sits at $0.78–$0.80, with major downside support around $0.62 and $0.50.