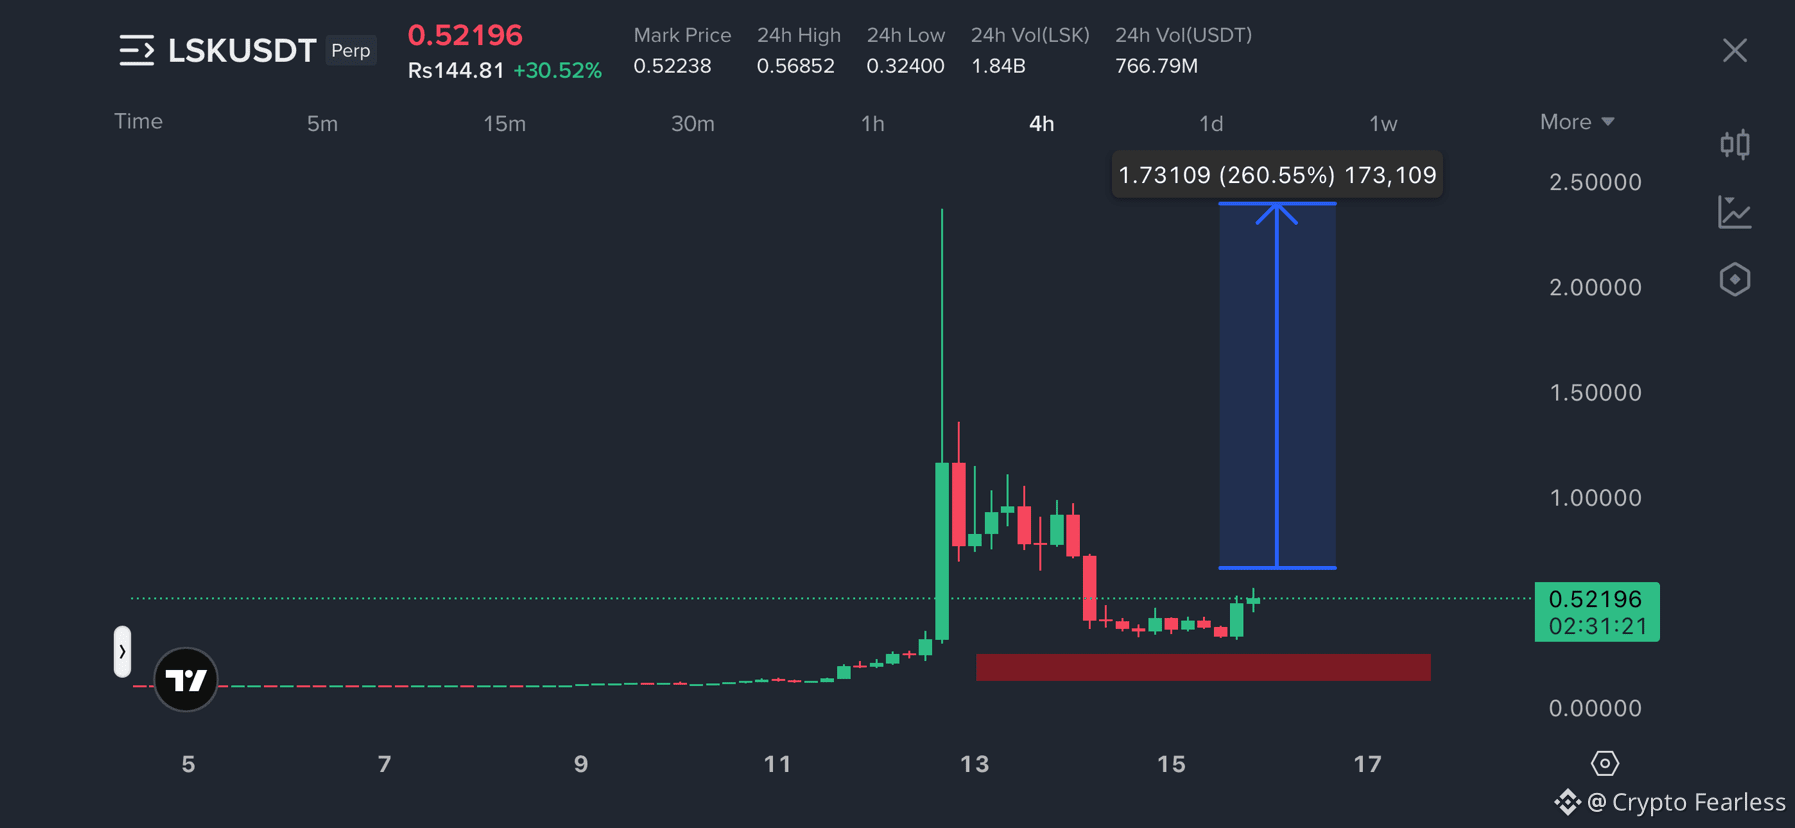
$LSK is giving a very interesting chart right now.
After that crazy pump, price went from almost nothing to above $2.30 before getting hit by heavy selling. Now LSK is trading around $0.52, and the market is trying to find a bottom.
What I’m watching here is the base around $0.30–$0.40. Price has started to stabilize above this area instead of continuing straight down.
If buyers can hold this zone and push LSK back above $0.60–$0.70, we could see a stronger recovery toward $0.85 and $1.00.
But there is another side to the chart.
If $0.30 breaks with strong selling, the whole recovery setup becomes much weaker and lower levels could come into play.
The big mistake here would be chasing the first green candle.
After a move this extreme, I want confirmation, not hope.
For me, these are the levels worth watching:
$0.30–$0.40 — major base
$0.52 — current area
$0.60–$0.70 — first recovery test
$0.85–$1.00 — major resistance zone
LSK has already shown that it can move hundreds of percent in a very short time.
That is exactly why I would treat this one with respect.
The chart can give a huge opportunity, but it can also punish anyone using too much leverage.
Let the price prove the direction first.
After that crazy pump, price went from almost nothing to above $2.30 before getting hit by heavy selling. Now LSK is trading around $0.52, and the market is trying to find a bottom.
What I’m watching here is the base around $0.30–$0.40. Price has started to stabilize above this area instead of continuing straight down.
If buyers can hold this zone and push LSK back above $0.60–$0.70, we could see a stronger recovery toward $0.85 and $1.00.
But there is another side to the chart.
If $0.30 breaks with strong selling, the whole recovery setup becomes much weaker and lower levels could come into play.
The big mistake here would be chasing the first green candle.
After a move this extreme, I want confirmation, not hope.
For me, these are the levels worth watching:
$0.30–$0.40 — major base
$0.52 — current area
$0.60–$0.70 — first recovery test
$0.85–$1.00 — major resistance zone
LSK has already shown that it can move hundreds of percent in a very short time.
That is exactly why I would treat this one with respect.
The chart can give a huge opportunity, but it can also punish anyone using too much leverage.
Let the price prove the direction first.