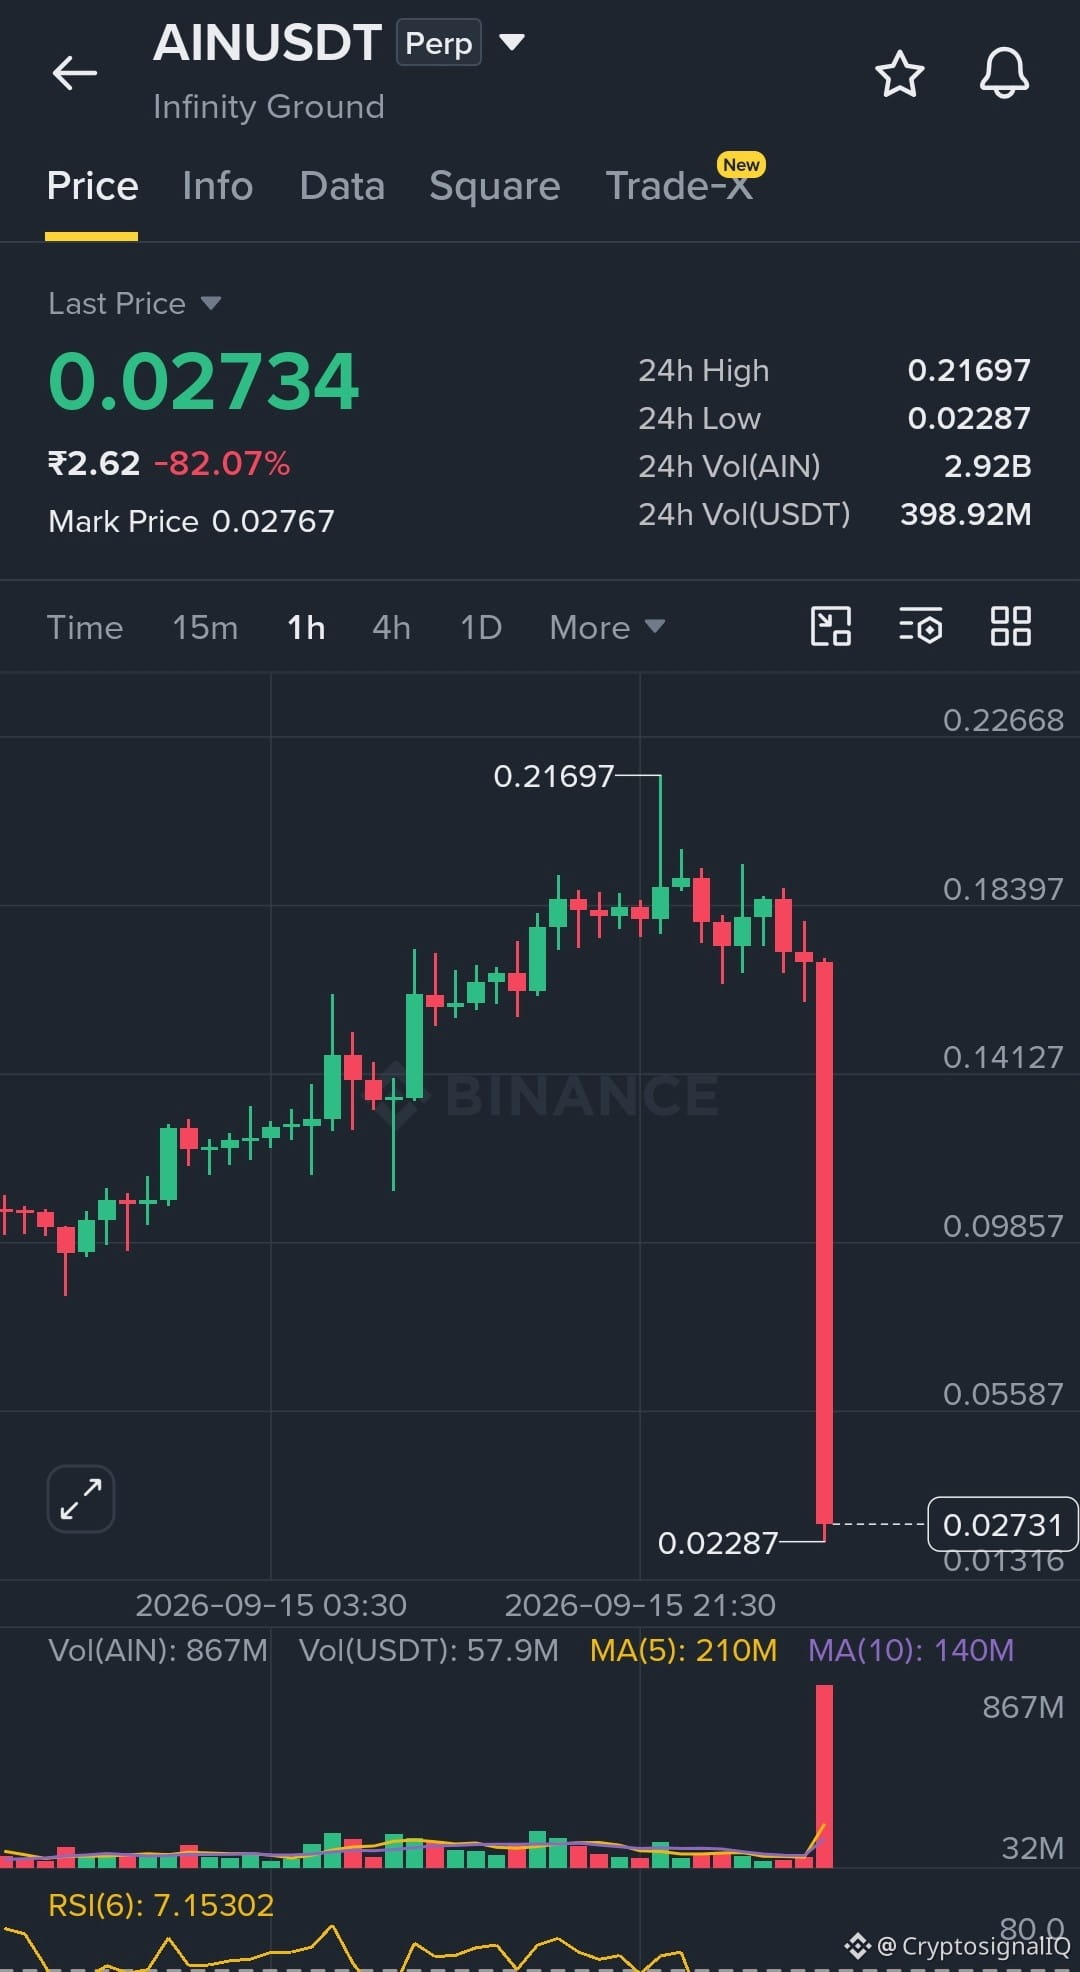
$AIN — from $0.21697 to $0.02287 in one brutal move. That’s an 89.5% collapse from the 24h high, and the 1H chart shows the kind of selling pressure that can erase an entire rally in minutes.
The move came after a sharp surge, with trading activity reaching nearly $400M in 24h. Online market data also shows AIN had been attracting heavy speculative interest before the reversal.
What happens next is the real question. $0.02287 is the immediate low, but a bounce from here does not automatically mean the trend has recovered. A reclaim of the breakdown area would be needed before buyers can start rebuilding confidence.
This is what happens when a parabolic move runs out of buyers — the way up is exciting, but the way down can be violent.
Trade #AIN
The move came after a sharp surge, with trading activity reaching nearly $400M in 24h. Online market data also shows AIN had been attracting heavy speculative interest before the reversal.
What happens next is the real question. $0.02287 is the immediate low, but a bounce from here does not automatically mean the trend has recovered. A reclaim of the breakdown area would be needed before buyers can start rebuilding confidence.
This is what happens when a parabolic move runs out of buyers — the way up is exciting, but the way down can be violent.
Trade #AIN