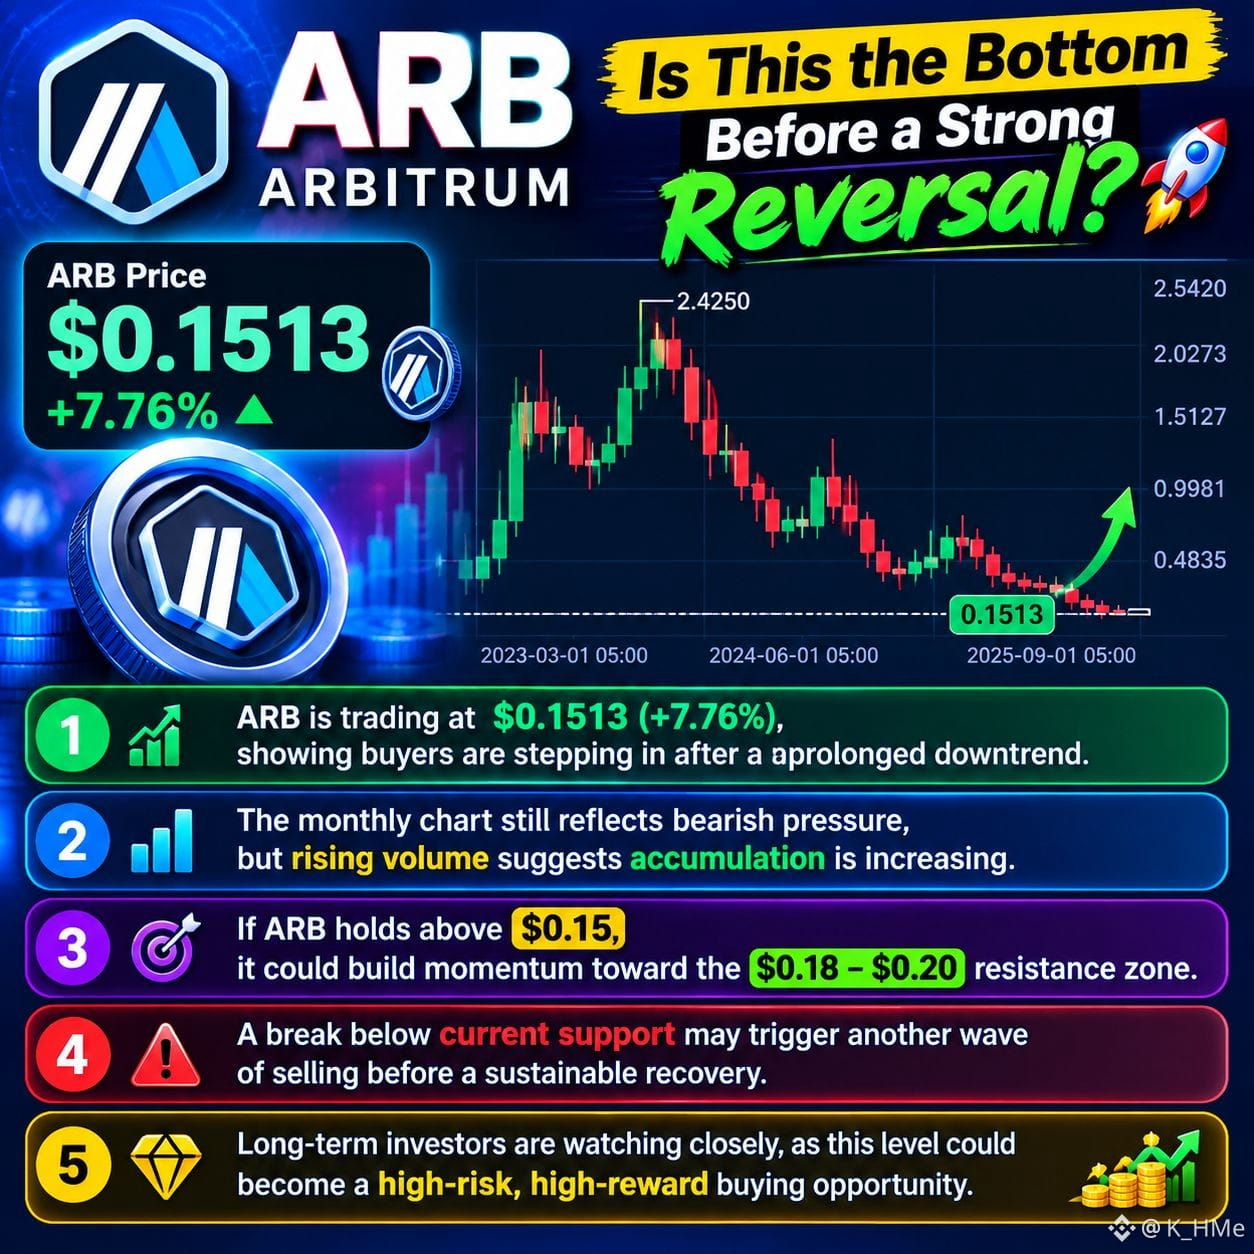
📉 #ARB at $0.1513: Is This the Bottom Before a Strong Reversal? 🚀
🔻 #ARB is trading at $0.1513 (+7.76%), showing buyers are stepping in after a prolonged downtrend.
📊 The monthly chart still reflects bearish pressure, but rising volume suggests accumulation is increasing.
💰 If #ARB holds above $0.15, it could build momentum toward the $0.18–$0.20 resistance zone.
⚠️ A break below current support may trigger another wave of selling before a sustainable recovery.
🔥 Long-term investors are watching closely, as this level could become a high-risk, high-reward buying opportunity.
🔻 #ARB is trading at $0.1513 (+7.76%), showing buyers are stepping in after a prolonged downtrend.
📊 The monthly chart still reflects bearish pressure, but rising volume suggests accumulation is increasing.
💰 If #ARB holds above $0.15, it could build momentum toward the $0.18–$0.20 resistance zone.
⚠️ A break below current support may trigger another wave of selling before a sustainable recovery.
🔥 Long-term investors are watching closely, as this level could become a high-risk, high-reward buying opportunity.