
$TSLA — LOOKING BULLISH
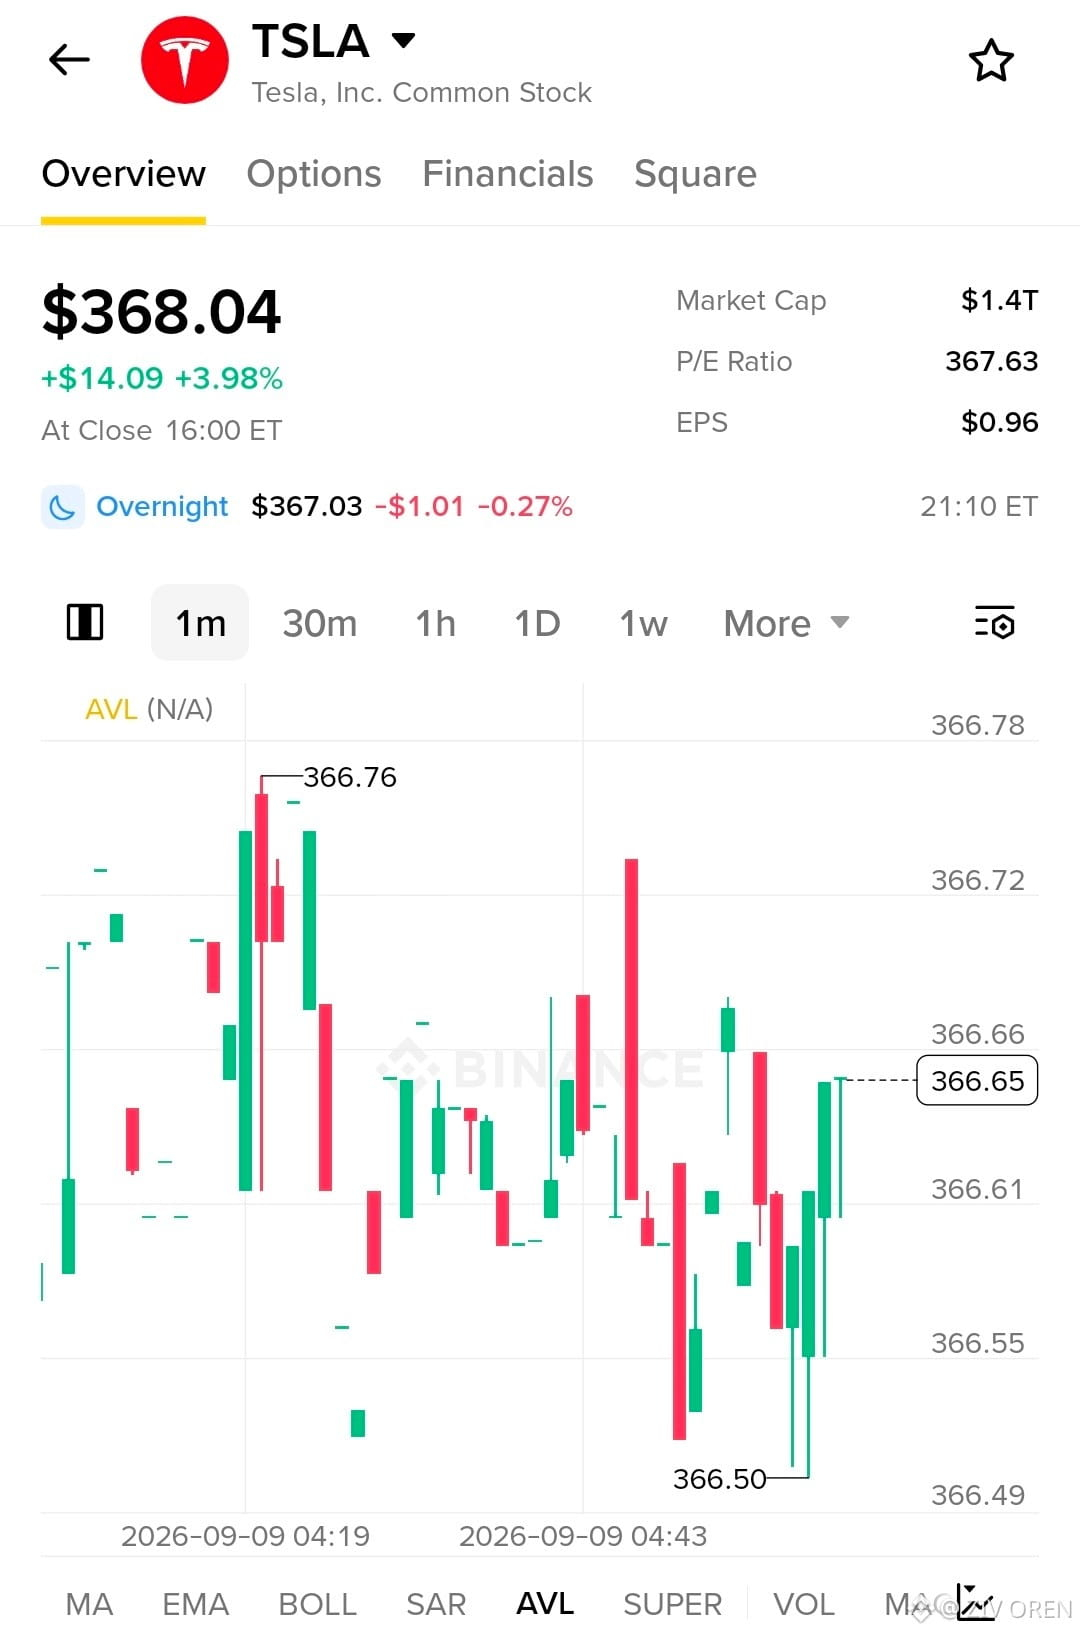
TSLA is showing a short-term recovery on the 1M chart after holding the 366.50 support area. Price is pushing back toward 366.66, with the recent high near 366.76 acting as immediate resistance.
Entry Zone: 366.55 – 366.65
TP1: 366.76
TP2: 367.20
TP3: 367.80
Stop Loss: 366.40
Analysis:
The key confirmation level is 366.76. A clean breakout and hold above this level could strengthen the short-term bullish momentum and open the way toward higher levels.
If price loses 366.50–366.40, the setup weakens and the bullish idea becomes invalid.
This is a 1-minute setup, so expect noise and fast moves. Avoid chasing candles, wait for confirmation, and manage position size carefully.
Let's trade $TSLA
TSLA is showing a short-term recovery on the 1M chart after holding the 366.50 support area. Price is pushing back toward 366.66, with the recent high near 366.76 acting as immediate resistance.
Entry Zone: 366.55 – 366.65
TP1: 366.76
TP2: 367.20
TP3: 367.80
Stop Loss: 366.40
Analysis:
The key confirmation level is 366.76. A clean breakout and hold above this level could strengthen the short-term bullish momentum and open the way toward higher levels.
If price loses 366.50–366.40, the setup weakens and the bullish idea becomes invalid.
This is a 1-minute setup, so expect noise and fast moves. Avoid chasing candles, wait for confirmation, and manage position size carefully.
Let's trade $TSLA