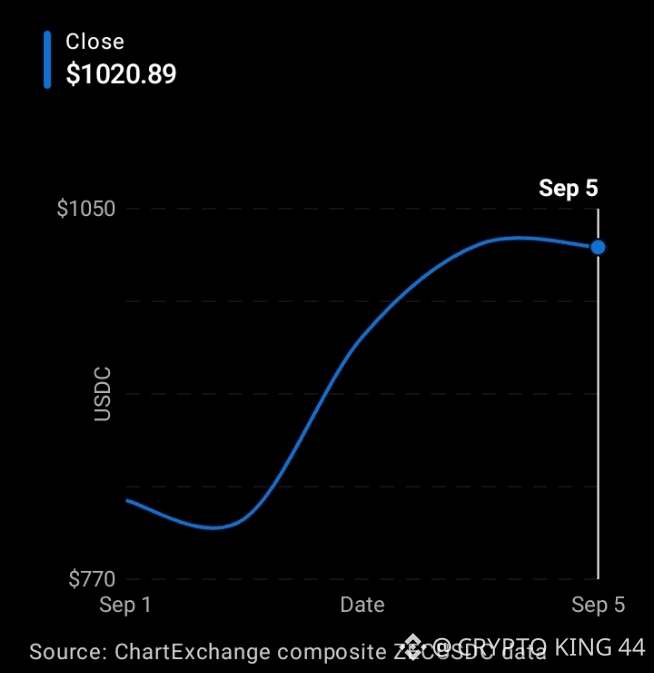
$ZEC ZECUSDC — recent daily price
Daily closing prices from the latest available ZEC/USDC composite data.
Close
$1020.89
Source: ChartExchange composite ZECUSDC data
📈 Technical view
Trend: Strongly bullish. ZEC gained roughly 25% from Sep 1 to Sep 5, with a particularly powerful breakout on Sep 3–4. �
ChartExchange
Resistance: $1,050 is the immediate key ceiling; ZEC reached $1,050 on Sep 4. A clean breakout could open $1,100–$1,150 psychologically/technically.
Support: First area $1,000–$997, followed by $950–$953. Losing $950 would weaken the short-term structure considerably.
Momentum: ZEC is extremely extended after the recent surge. TradingView shows approximately +7.27% over 1 week and +68.45% over 1 month for ZECUSDC. �
TradingView
Fundamental catalyst: ZEC recently broke above $1,000 for the first time in a decade, while reported spot-ETF inflows and institutional interest have strengthened the bullish narrative. �
CoinMarketCap
🎯 My scenario map
Bullish: Hold $1,000 → reclaim $1,050 → $1,100 / $1,150
Neutral: Consolidate between $950–$1,050
Bearish: Lose $950 → possible retracement toward $900–$930
Bias: 🟢 Bullish, but high-risk/overextended. I would be more comfortable with a confirmed breakout above $1,050 or a controlled pullback that holds $950–$1,000 than chasing a vertical candle here.
This is market analysis, not financial advice. Crypto can move sharply in either direction. �
ChartExchange +1
Open the live ZECUSDC chart on TradingView�
#LululemonTumbles20%OnWeakGuidance #USAugustJobGrowthNearlyTriplesForecast #USAugustAvgHourlyEarningsRise3.1% #BitcoinETFsBiggestDailyInflowSinceJanuary
Daily closing prices from the latest available ZEC/USDC composite data.
Close
$1020.89
Source: ChartExchange composite ZECUSDC data
📈 Technical view
Trend: Strongly bullish. ZEC gained roughly 25% from Sep 1 to Sep 5, with a particularly powerful breakout on Sep 3–4. �
ChartExchange
Resistance: $1,050 is the immediate key ceiling; ZEC reached $1,050 on Sep 4. A clean breakout could open $1,100–$1,150 psychologically/technically.
Support: First area $1,000–$997, followed by $950–$953. Losing $950 would weaken the short-term structure considerably.
Momentum: ZEC is extremely extended after the recent surge. TradingView shows approximately +7.27% over 1 week and +68.45% over 1 month for ZECUSDC. �
TradingView
Fundamental catalyst: ZEC recently broke above $1,000 for the first time in a decade, while reported spot-ETF inflows and institutional interest have strengthened the bullish narrative. �
CoinMarketCap
🎯 My scenario map
Bullish: Hold $1,000 → reclaim $1,050 → $1,100 / $1,150
Neutral: Consolidate between $950–$1,050
Bearish: Lose $950 → possible retracement toward $900–$930
Bias: 🟢 Bullish, but high-risk/overextended. I would be more comfortable with a confirmed breakout above $1,050 or a controlled pullback that holds $950–$1,000 than chasing a vertical candle here.
This is market analysis, not financial advice. Crypto can move sharply in either direction. �
ChartExchange +1
Open the live ZECUSDC chart on TradingView�
#LululemonTumbles20%OnWeakGuidance #USAugustJobGrowthNearlyTriplesForecast #USAugustAvgHourlyEarningsRise3.1% #BitcoinETFsBiggestDailyInflowSinceJanuary