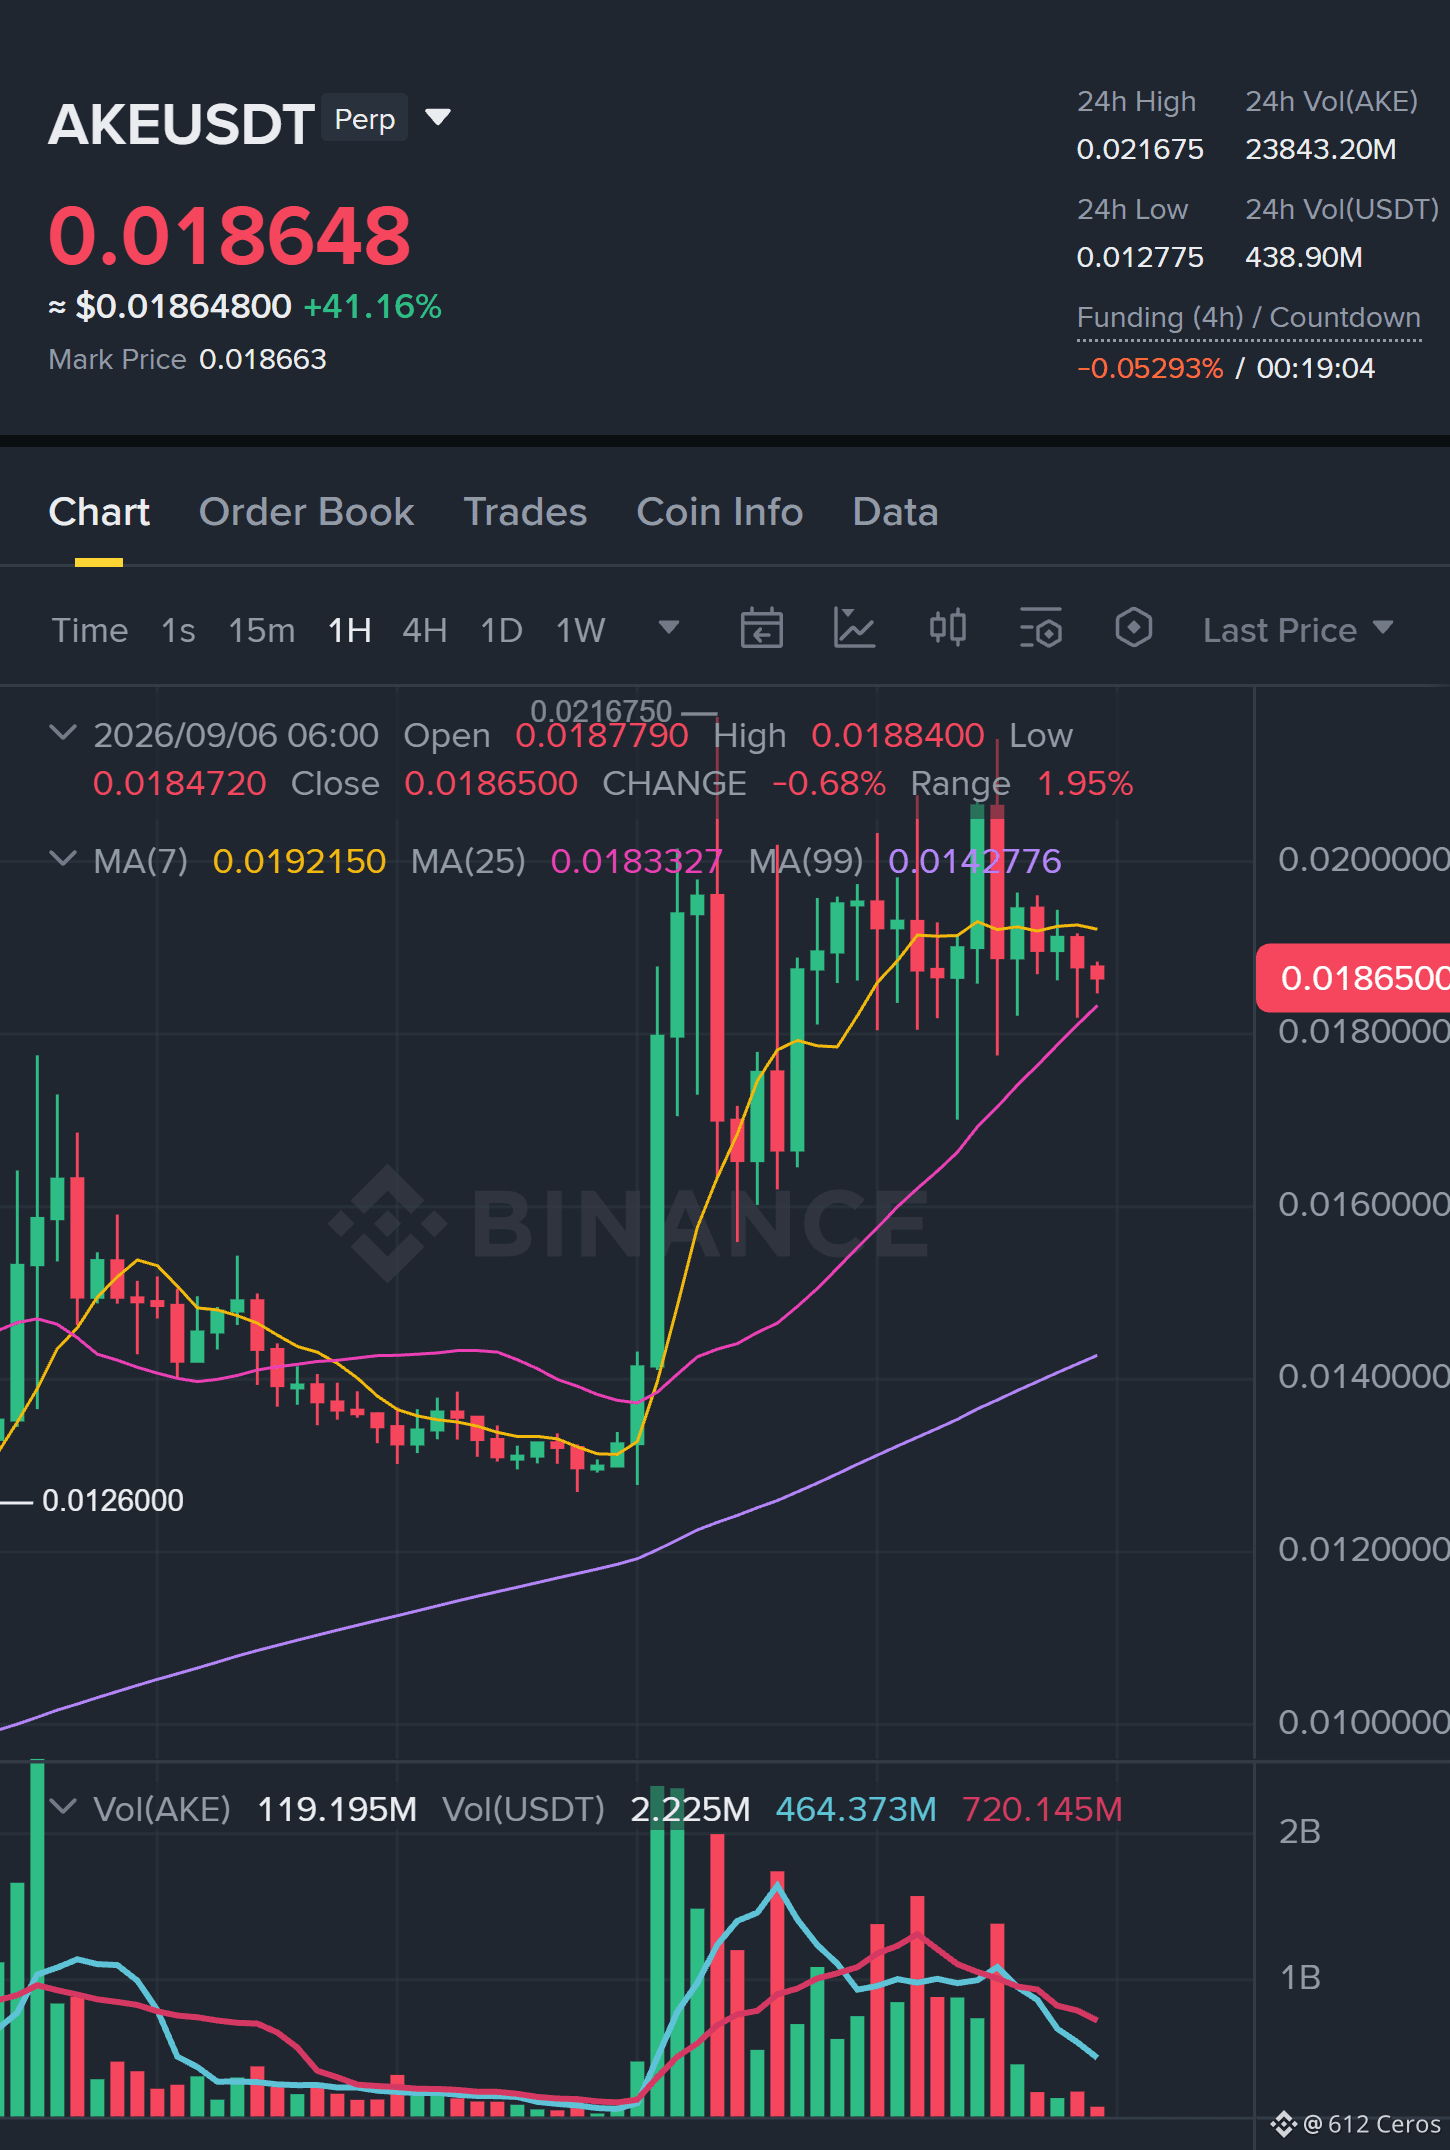
Everyone is staring at the 4h chart, but the real $AKE /USDT signal is hiding in the 15m RSI at 45.6.
$AKE - 🟢 LONG · Conf 81%
Trade Plan:
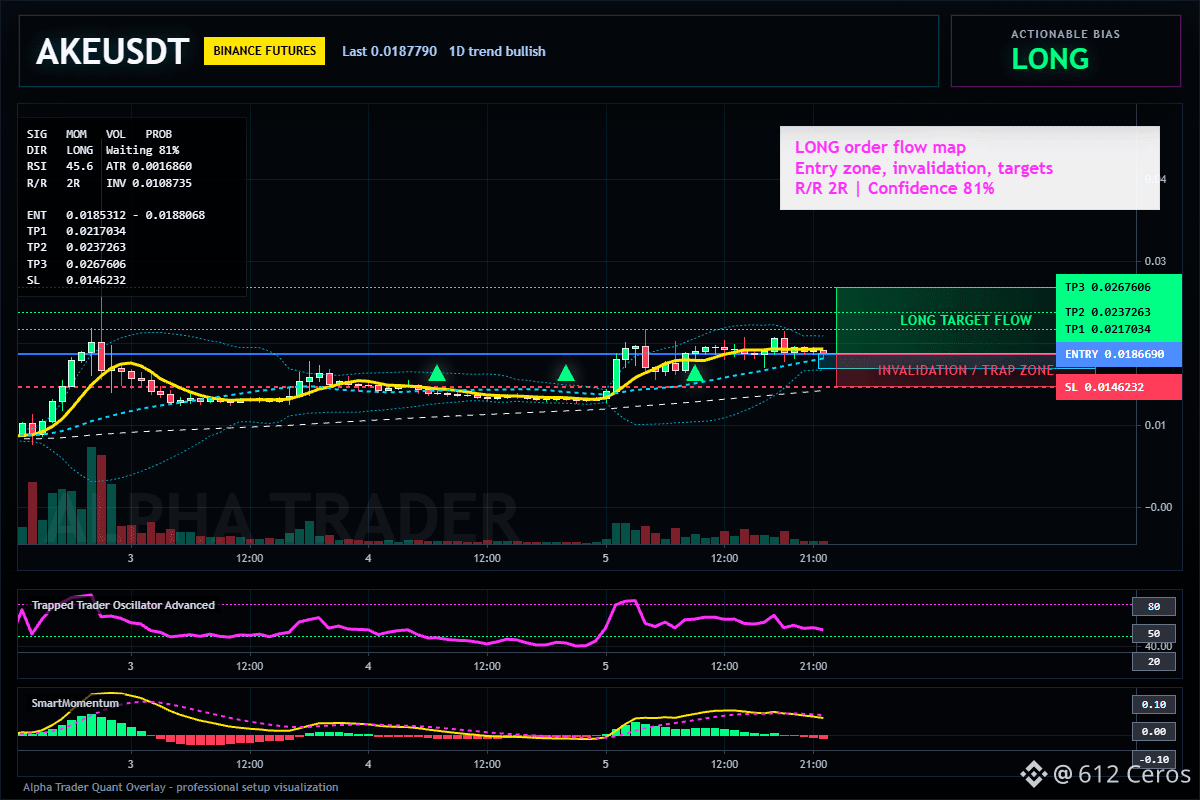
Entry: 0.0185312 – 0.0188068
SL: 0.0146232
TP1: 0.0217034
TP2: 0.0237263
TP3: 0.0267606
Why this setup?
- The daily trend is bullish, and we are in a trend regime, not a chop zone. This is a pullback buy, not a hero move.
- The 15m RSI at 45.6 tells me the local selling pressure is cooling off right at the 4h reference point of 0.0186690.
- Why now? The entry window (0.0185312 to 0.0188068) is open, and the stop at 0.0146232 is wide enough to breathe but tight enough to keep you honest.
- Targets are stacked: TP1 at 0.0217, TP2 at 0.0237, TP3 at 0.0267. The risk-reward here is asymmetric, favoring the upside.
- This is a trend-following setup with 81% confidence. Higher timeframe alignment is on your side, so you can lean in, but never skip the stop.
Debate:
Are you loading the dip at 0.0186 or waiting for a lower entry at the 0.0185 range?
Click here to view the chart 👇️
⚠️ Personal market analysis only. NFA — manage risk and DYOR.
Educational content, not investment advice or a recommendation to buy, sell, deposit, or withdraw any asset. No paid promotion or referral/affiliate links.
$AKE - 🟢 LONG · Conf 81%
Trade Plan:
Entry: 0.0185312 – 0.0188068
SL: 0.0146232
TP1: 0.0217034
TP2: 0.0237263
TP3: 0.0267606
Why this setup?
- The daily trend is bullish, and we are in a trend regime, not a chop zone. This is a pullback buy, not a hero move.
- The 15m RSI at 45.6 tells me the local selling pressure is cooling off right at the 4h reference point of 0.0186690.
- Why now? The entry window (0.0185312 to 0.0188068) is open, and the stop at 0.0146232 is wide enough to breathe but tight enough to keep you honest.
- Targets are stacked: TP1 at 0.0217, TP2 at 0.0237, TP3 at 0.0267. The risk-reward here is asymmetric, favoring the upside.
- This is a trend-following setup with 81% confidence. Higher timeframe alignment is on your side, so you can lean in, but never skip the stop.
Debate:
Are you loading the dip at 0.0186 or waiting for a lower entry at the 0.0185 range?
Click here to view the chart 👇️
⚠️ Personal market analysis only. NFA — manage risk and DYOR.
Educational content, not investment advice or a recommendation to buy, sell, deposit, or withdraw any asset. No paid promotion or referral/affiliate links.