Everyone is staring at the daily range while the 4h quietly broke the rules.
$SNDK /USDT - 🟢 LONG · Conf 80%
Trade Plan:
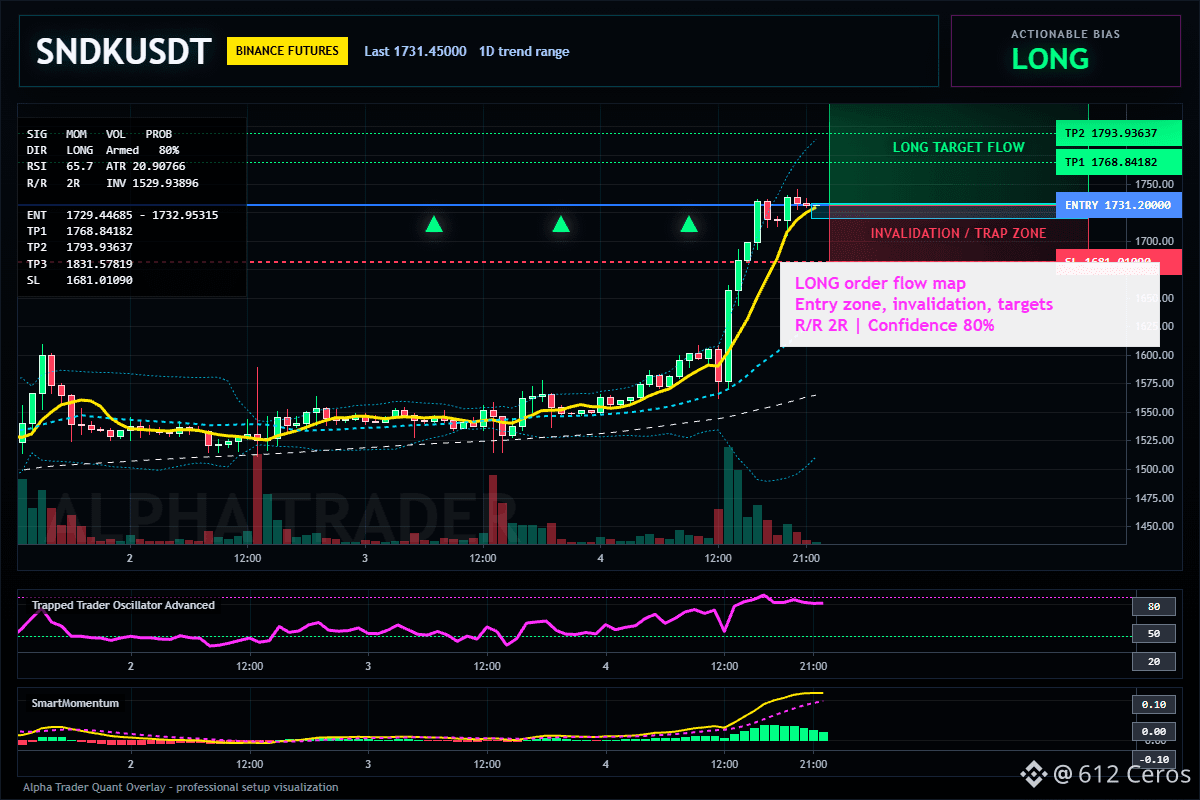
Entry: 1729.44685 – 1732.95315
SL: 1681.01090
TP1: 1768.84182
TP2: 1793.93637
TP3: 1831.57819
Why this setup?
- The daily chart is sideways, but the 4h momentum is screaming LONG with an 80% confidence score.
- RSI on the 15m sits at 65.68, showing buyers are in control but not yet exhausted. This is the sweet spot for continuation.
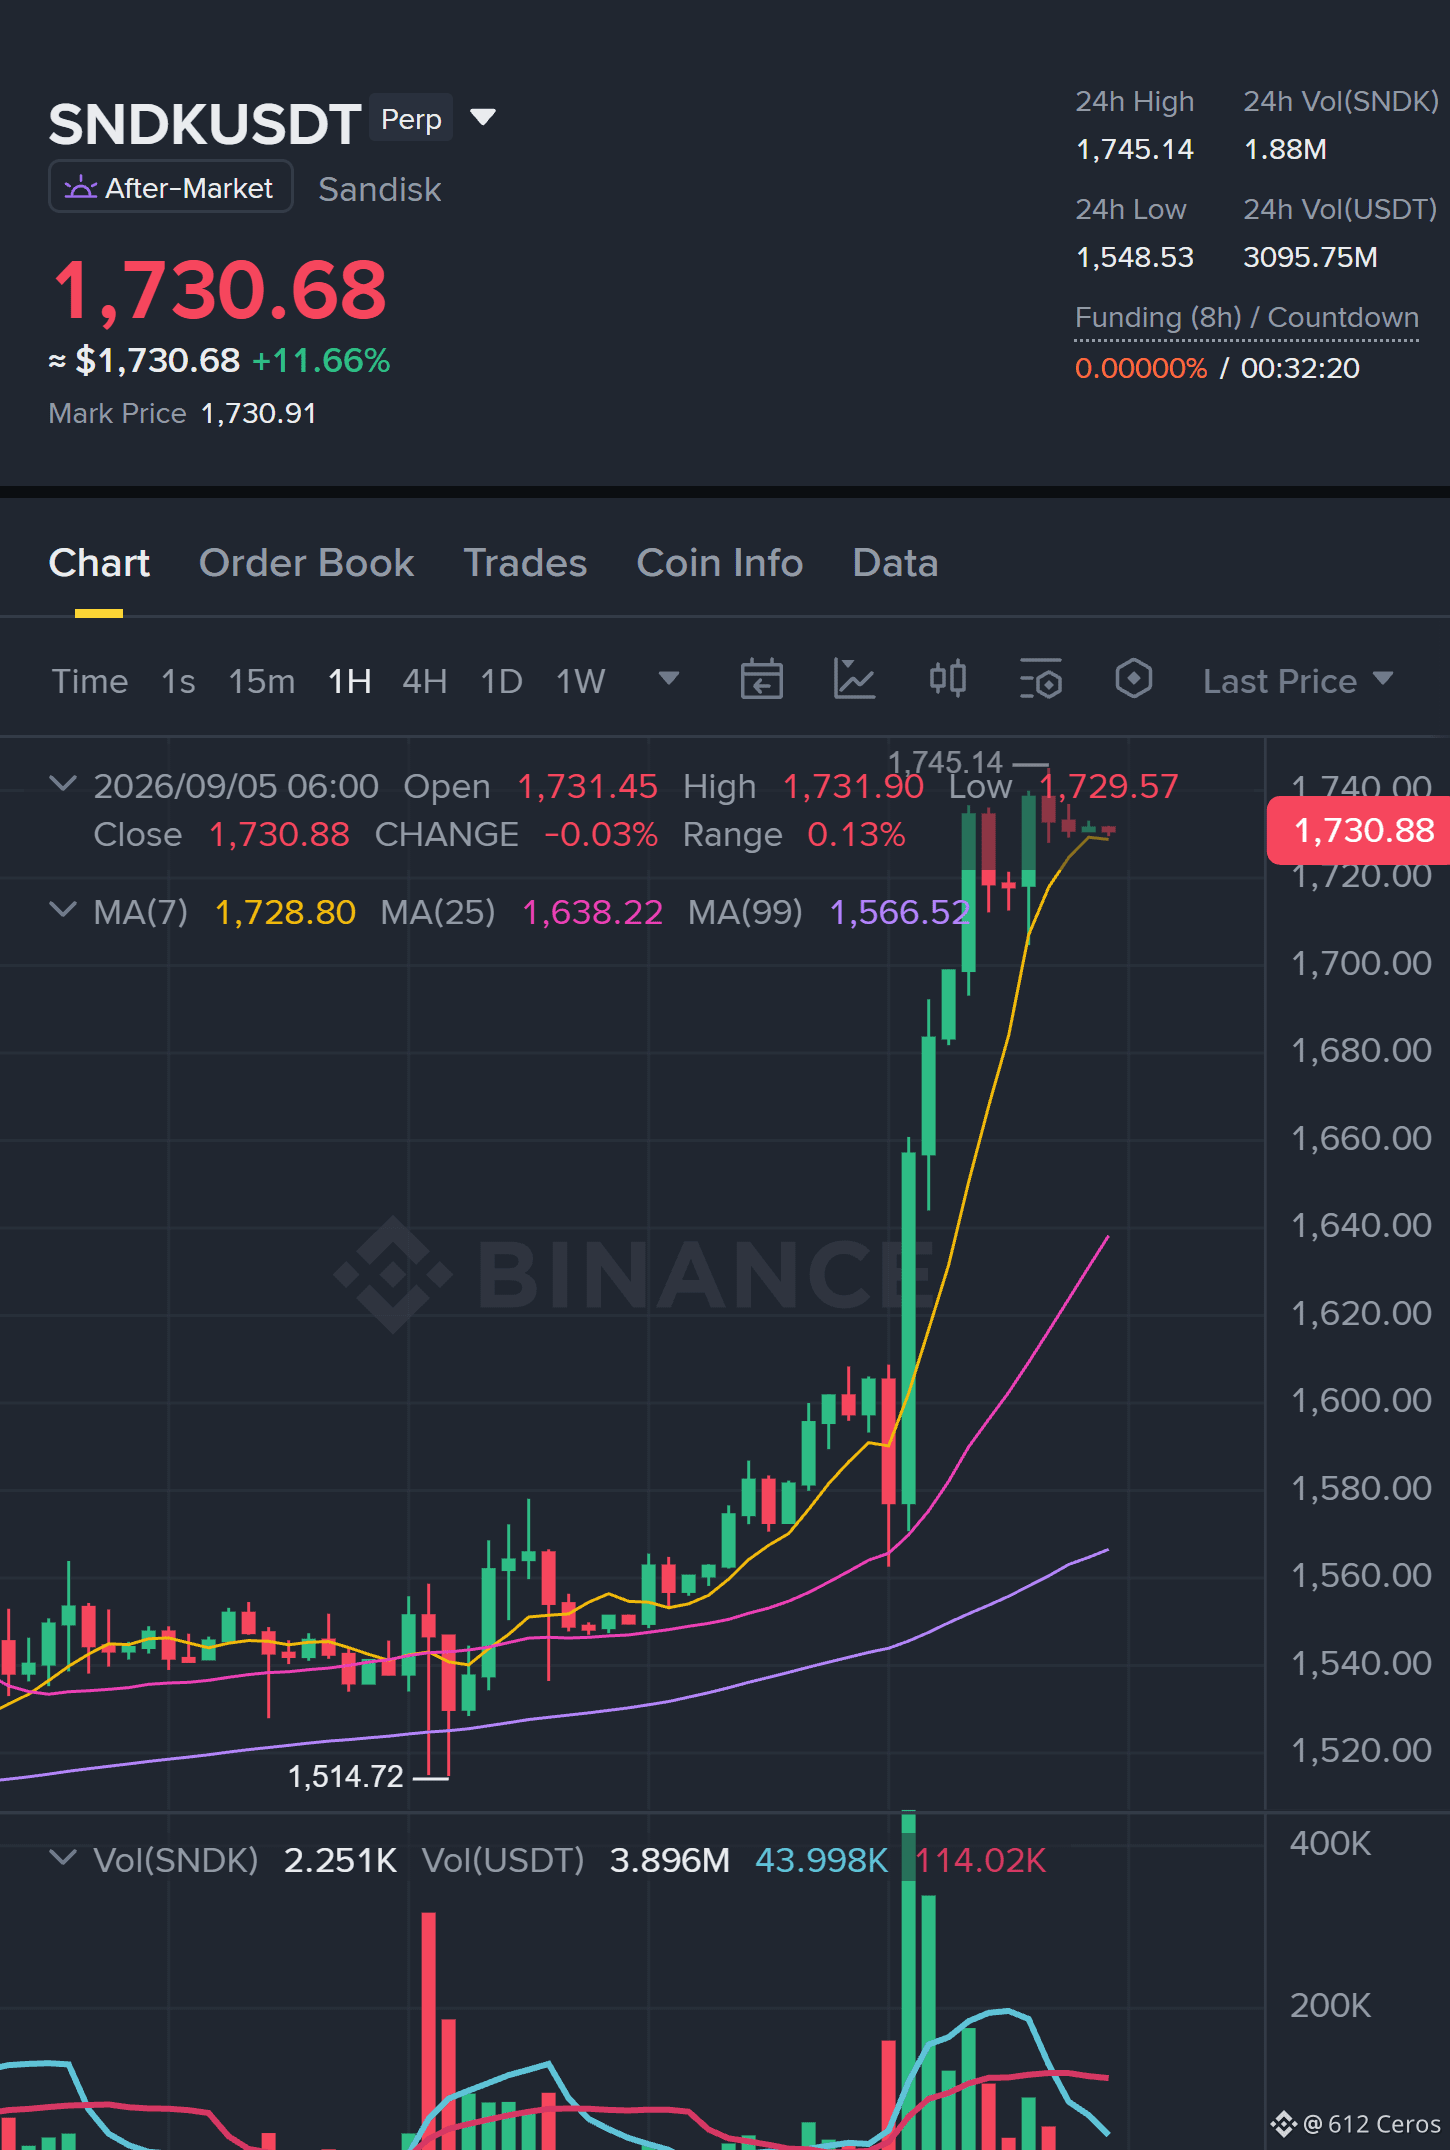
- Price is holding at 1731.20 with a tight entry zone between 1729.45 and 1732.95. The path of least resistance points to TP1 at 1768.84 and TP2 at 1793.94.
- Why now? Because the trend regime is active. We are not fighting the daily range; we are trading the stronger 4h impulse inside it. The stop at 1681.01 is clear, and the risk-to-reward on this setup is the edge.
Debate:
Are we filling TP1 before the weekend close, or does the daily range cap this run at 1750?
Click here to view the chart 👇️
⚠️ Personal market analysis only. NFA — manage risk and DYOR.
Educational content, not investment advice or a recommendation to buy, sell, deposit, or withdraw any asset. No paid promotion or referral/affiliate links.
$SNDK /USDT - 🟢 LONG · Conf 80%
Trade Plan:
Entry: 1729.44685 – 1732.95315
SL: 1681.01090
TP1: 1768.84182
TP2: 1793.93637
TP3: 1831.57819
Why this setup?
- The daily chart is sideways, but the 4h momentum is screaming LONG with an 80% confidence score.
- RSI on the 15m sits at 65.68, showing buyers are in control but not yet exhausted. This is the sweet spot for continuation.
- Price is holding at 1731.20 with a tight entry zone between 1729.45 and 1732.95. The path of least resistance points to TP1 at 1768.84 and TP2 at 1793.94.
- Why now? Because the trend regime is active. We are not fighting the daily range; we are trading the stronger 4h impulse inside it. The stop at 1681.01 is clear, and the risk-to-reward on this setup is the edge.
Debate:
Are we filling TP1 before the weekend close, or does the daily range cap this run at 1750?
Click here to view the chart 👇️
⚠️ Personal market analysis only. NFA — manage risk and DYOR.
Educational content, not investment advice or a recommendation to buy, sell, deposit, or withdraw any asset. No paid promotion or referral/affiliate links.