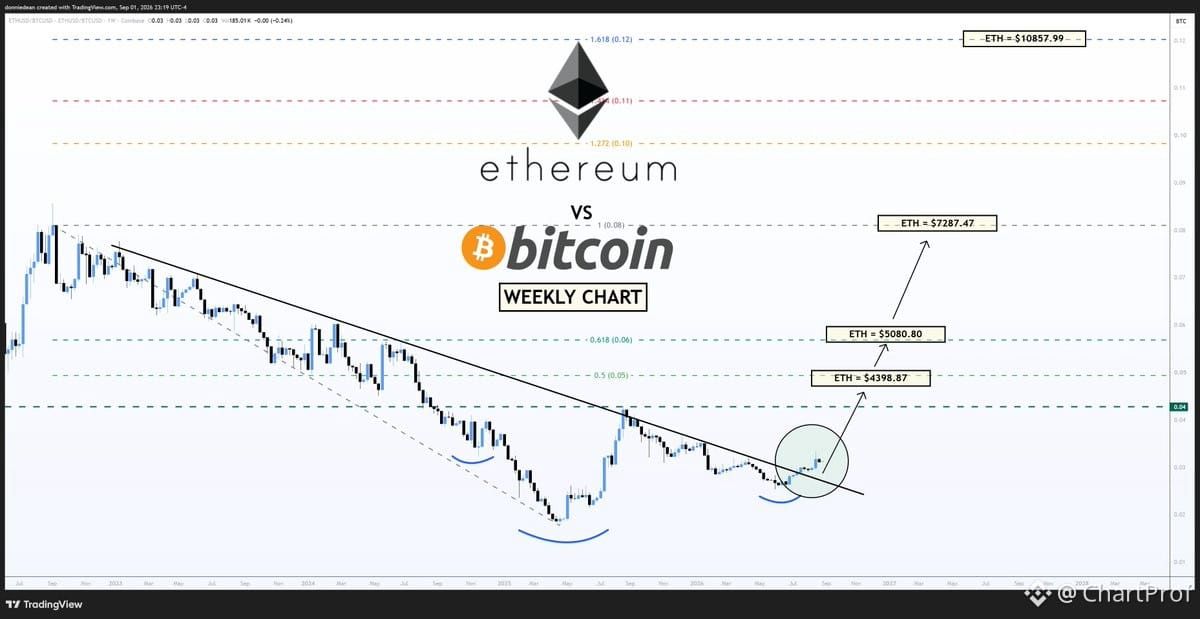
Clean structure forming on the $ETH/$BTC ratio — this is the chart that tells you which horse to ride when both are running.
Breakout confirmed. When this ratio climbs, it means $ETH is outpacing $BTC in percentage terms. Both assets can rise together, but Ethereum moves faster in this setup.
The Golden Ratio extension — a Fibonacci-based projection tool — lands at $10,857 for $ETH. That's not a meme number. It's derived from the measured move of the breakout structure plus historical Fib levels that have acted as magnets in prior cycles.
What this setup teaches: relative strength matters as much as absolute price. If you're long crypto and the ratio is breaking up, you want more $ETH exposure than $BTC during this phase. If the ratio fails and reverses, flip the script.
Watch the ratio itself for confirmation. A sustained move above resistance with volume keeps this thesis alive. If it fades back inside the range, the breakout is false and you rotate back to $BTC.
This is how you read the market in layers — not just "up" or "down,
Breakout confirmed. When this ratio climbs, it means $ETH is outpacing $BTC in percentage terms. Both assets can rise together, but Ethereum moves faster in this setup.
The Golden Ratio extension — a Fibonacci-based projection tool — lands at $10,857 for $ETH. That's not a meme number. It's derived from the measured move of the breakout structure plus historical Fib levels that have acted as magnets in prior cycles.
What this setup teaches: relative strength matters as much as absolute price. If you're long crypto and the ratio is breaking up, you want more $ETH exposure than $BTC during this phase. If the ratio fails and reverses, flip the script.
Watch the ratio itself for confirmation. A sustained move above resistance with volume keeps this thesis alive. If it fades back inside the range, the breakout is false and you rotate back to $BTC.
This is how you read the market in layers — not just "up" or "down,