📊 Market Breakdown: Reading Price Action and Support/Resistance Zones
Take a close look at this price chart. Whether you are trading crypto, forex, or stocks, understanding how price interacts with key zones is what separates disciplined traders from emotional ones.
Here is a quick breakdown of what this setup is teaching us:
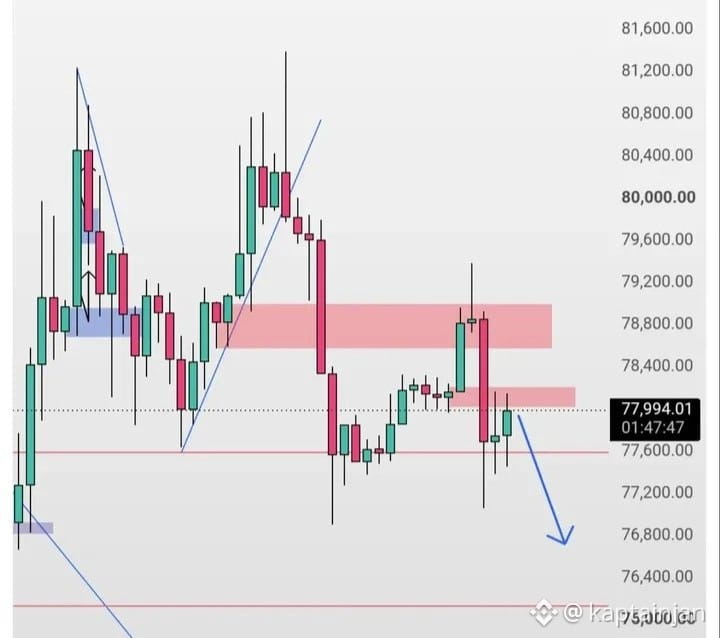
Support Turned Resistance (The Red Zones): Notice how previous support areas often turn into resistance zones when the price breaks below them. When the market rallies back up into these red bands, sellers frequently step in, treating it as a prime area to look for short opportunities.
Trend Structure & Rejection: The chart displays sharp impulsive moves followed by consolidation. Pay attention to how the trend lines mark momentum shifts—when a rising trend line or channel breaks downwards, it often signals a shift in market control from buyers to sellers.
Patience Over Impulse: Notice the downward arrow pointing toward lower levels? That highlights a potential continuation move. Instead of chasing the market, professional traders wait for a retest of key zones or confirmation before taking action.
💡 Trader's Takeaway: Never trade based on hope or FOMO. Let the market come to your levels, watch how candles react inside supply and demand zones, and always manage your risk.
💬 What’s your preferred strategy when trading key support and resistance zones? Drop your thoughts in the comments below! 👇
#TradingEducation
Take a close look at this price chart. Whether you are trading crypto, forex, or stocks, understanding how price interacts with key zones is what separates disciplined traders from emotional ones.
Here is a quick breakdown of what this setup is teaching us:
Support Turned Resistance (The Red Zones): Notice how previous support areas often turn into resistance zones when the price breaks below them. When the market rallies back up into these red bands, sellers frequently step in, treating it as a prime area to look for short opportunities.
Trend Structure & Rejection: The chart displays sharp impulsive moves followed by consolidation. Pay attention to how the trend lines mark momentum shifts—when a rising trend line or channel breaks downwards, it often signals a shift in market control from buyers to sellers.
Patience Over Impulse: Notice the downward arrow pointing toward lower levels? That highlights a potential continuation move. Instead of chasing the market, professional traders wait for a retest of key zones or confirmation before taking action.
💡 Trader's Takeaway: Never trade based on hope or FOMO. Let the market come to your levels, watch how candles react inside supply and demand zones, and always manage your risk.
💬 What’s your preferred strategy when trading key support and resistance zones? Drop your thoughts in the comments below! 👇
#TradingEducation