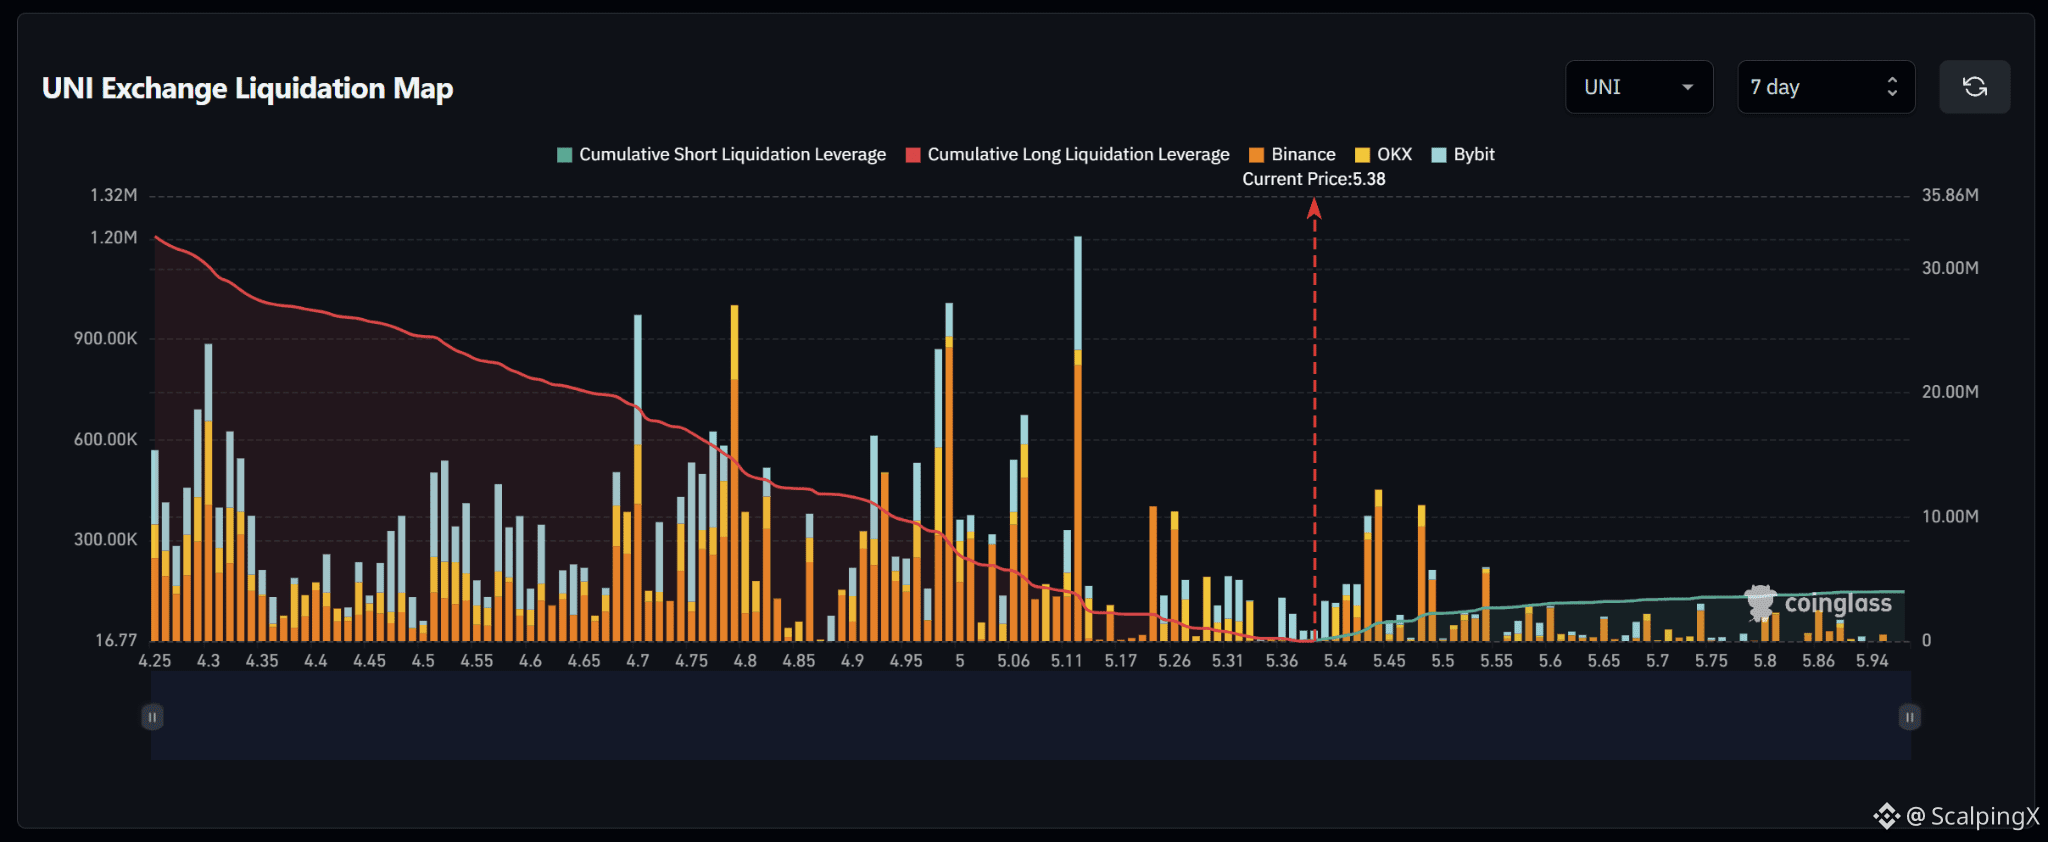
$UNI – Liquidation Map (7 Days) – Current Price 5.38
🔎 The 7-day liquidation map shows roughly $31–32 million in long liquidations below the current price, far exceeding only about $3–4 million in short liquidations above. The liquidity structure therefore strongly favors the downside, with roughly 8–10 times more cumulative liquidity sitting below the market.
📉 Below the market, long-liquidation liquidity begins to build more heavily around 5.31–5.11. The strongest nearby cluster sits around 5.11, where the liquidation bar reaches roughly $1.2 million, while 5.06 and 4.98 are also major concentrations. Losing 5.31 would bring 5.26–5.11 into focus next.
📈 Above the market, short-liquidation liquidity is relatively sparse. The nearest clusters sit around 5.40–5.50, with 5.44 and 5.49 standing out at roughly $400,000–450,000. Beyond 5.55, liquidity density declines noticeably.
🧭 The broader setup strongly favors the downside because long-liquidation exposure below dominates. Losing 5.31 would increase the probability of a sweep toward 5.26–5.11, while breaking above 5.40 would shift attention toward the nearby short-liquidation clusters around 5.44–5.50.
#LiquidationMap
🔎 The 7-day liquidation map shows roughly $31–32 million in long liquidations below the current price, far exceeding only about $3–4 million in short liquidations above. The liquidity structure therefore strongly favors the downside, with roughly 8–10 times more cumulative liquidity sitting below the market.
📉 Below the market, long-liquidation liquidity begins to build more heavily around 5.31–5.11. The strongest nearby cluster sits around 5.11, where the liquidation bar reaches roughly $1.2 million, while 5.06 and 4.98 are also major concentrations. Losing 5.31 would bring 5.26–5.11 into focus next.
📈 Above the market, short-liquidation liquidity is relatively sparse. The nearest clusters sit around 5.40–5.50, with 5.44 and 5.49 standing out at roughly $400,000–450,000. Beyond 5.55, liquidity density declines noticeably.
🧭 The broader setup strongly favors the downside because long-liquidation exposure below dominates. Losing 5.31 would increase the probability of a sweep toward 5.26–5.11, while breaking above 5.40 would shift attention toward the nearby short-liquidation clusters around 5.44–5.50.
#LiquidationMap