🚀 BTC Bottom Is In? History is Rhyming! 📉🔥
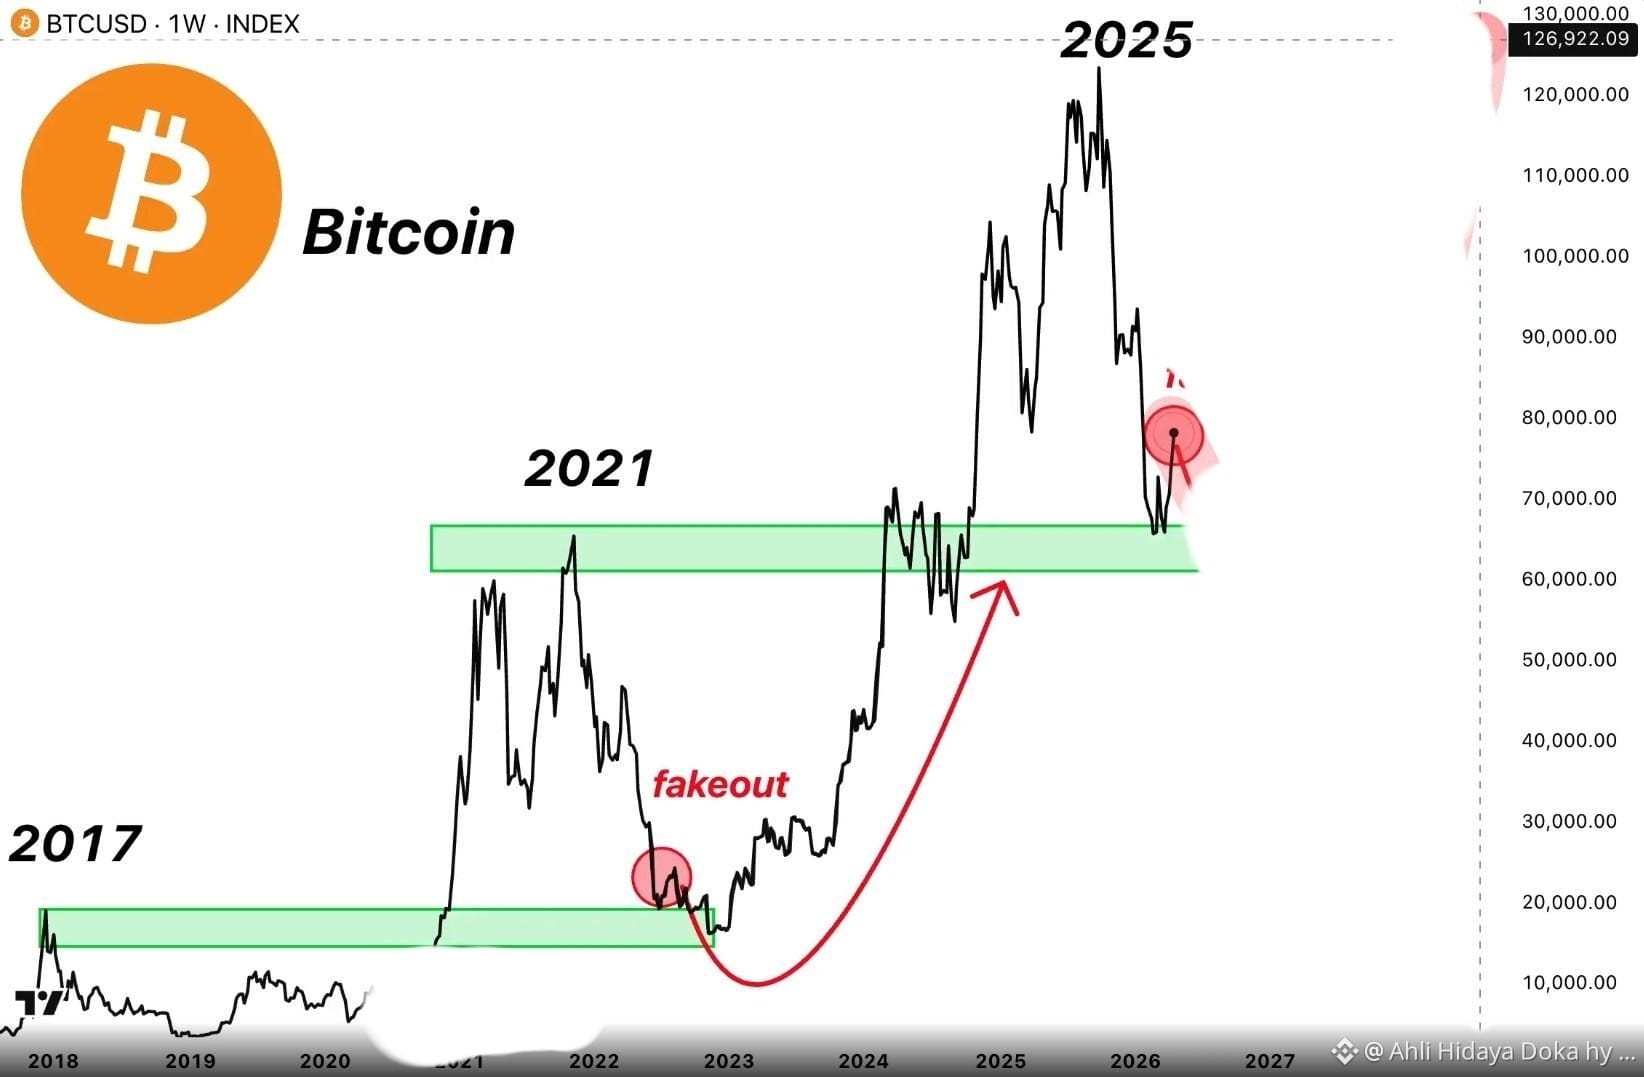
If you look closely at the weekly Bitcoin chart structure, the market is playing out a familiar historical playbook that every seasoned spot trader needs to pay attention to.
Here is why the current setup resembles the major structural behavior we saw back in the 2022-2023 cycle:
The Historical Mirror: Notice how the macro support zone (highlighted in green) is acting as a strong structural floor, mirroring the historic "fakeout" sweep below support that trapped bears right before a massive structural reversal.
Macro Support Holding: The recent correction tested critical demand levels around the $60k-$70k region, holding firm just like previous macro accumulation zones.
Spot Market Outlook: For spot traders, these types of structural retests often present high-conviction accumulation windows before the next macro leg unfolds.
Are we looking at the final local bottom before the next major continuation, or will we see one more retest? Let's discuss your thoughts in the comments below! 👇
#Bitcoin #BTC #CryptoAnalysis #BinanceSquare #SpotTrading #CryptoMarket$BTC $BNB
#dyor
If you look closely at the weekly Bitcoin chart structure, the market is playing out a familiar historical playbook that every seasoned spot trader needs to pay attention to.
Here is why the current setup resembles the major structural behavior we saw back in the 2022-2023 cycle:
The Historical Mirror: Notice how the macro support zone (highlighted in green) is acting as a strong structural floor, mirroring the historic "fakeout" sweep below support that trapped bears right before a massive structural reversal.
Macro Support Holding: The recent correction tested critical demand levels around the $60k-$70k region, holding firm just like previous macro accumulation zones.
Spot Market Outlook: For spot traders, these types of structural retests often present high-conviction accumulation windows before the next macro leg unfolds.
Are we looking at the final local bottom before the next major continuation, or will we see one more retest? Let's discuss your thoughts in the comments below! 👇
#Bitcoin #BTC #CryptoAnalysis #BinanceSquare #SpotTrading #CryptoMarket$BTC $BNB
#dyor