
Halit Buğra
132 Posts

Halit Buğra
Report
Block User
A legend trader
5 Following
14.7K+ Followers
3.5K+ Liked
Posts
·
--
RED PACKET IS LIVE!
I’m sharing a Red Packet with my community — and everyone has a chance to grab the reward.
HOW TO JOIN?
1. Follow me
2. Comment “YES”
3. Repost this post
That’s it. Complete all the tasks and you’re in.
EVERYONE WHO COMPLETES THE TASKS GETS THE REWARD.
Don’t miss it.
LET’S GO!
RED PACKET IS LIVE!
I’m sharing a Red Packet with my community — and everyone has a chance to grab the reward.
HOW TO JOIN?
1. Follow me
2. Comment “YES”
3. Repost this post
That’s it. Complete all the tasks and you’re in.
EVERYONE WHO COMPLETES THE TASKS GETS THE REWARD.
Don’t miss it.
LET’S GO!
I’m sharing a Red Packet with my community — and everyone has a chance to grab the reward.
HOW TO JOIN?
1. Follow me
2. Comment “YES”
3. Repost this post
That’s it. Complete all the tasks and you’re in.
EVERYONE WHO COMPLETES THE TASKS GETS THE REWARD.
Don’t miss it.
LET’S GO!
1.1k
4
63
1.1k
·
--
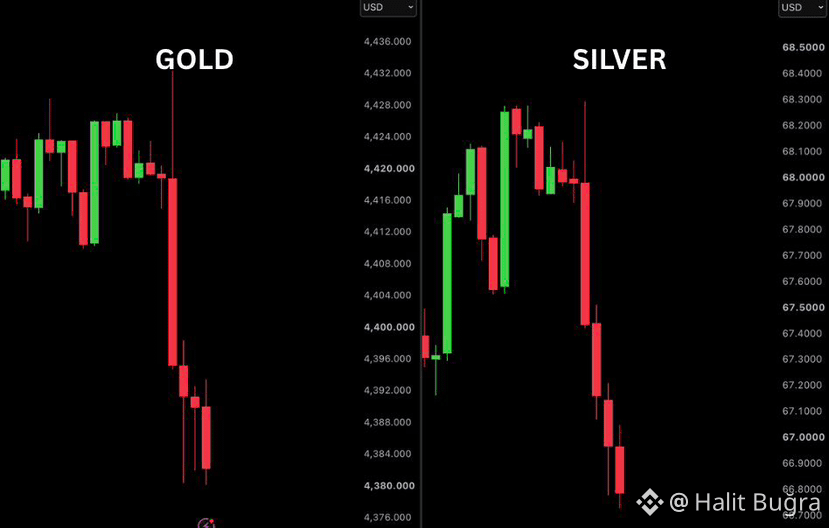
BREAKING: A MASSIVE SHOCK JUST HIT THE PRECIOUS METALS MARKET.
$545 BILLION WIPED FROM GOLD AND SILVER IN JUST 25 MINUTES.
Gold suffered a sudden breakdown, with heavy selling pressure driving price sharply lower from the $4,420 region toward $4,380.
Silver followed with an even more aggressive move, sliding from around $68 to below $67 as sellers took control.
This wasn’t a slow correction. The speed and size of the move show how quickly market sentiment can flip when major positions begin unwinding.
Now all eyes are on the next reaction.
Will buyers aggressively defend these lower levels, or is another wave of selling about to hit Gold and Silver?
BREAKING: A MASSIVE SHOCK JUST HIT THE PRECIOUS METALS MARKET.
$545 BILLION WIPED FROM GOLD AND SILVER IN JUST 25 MINUTES.
Gold suffered a sudden breakdown, with heavy selling pressure driving price sharply lower from the $4,420 region toward $4,380.
Silver followed with an even more aggressive move, sliding from around $68 to below $67 as sellers took control.
This wasn’t a slow correction. The speed and size of the move show how quickly market sentiment can flip when major positions begin unwinding.
Now all eyes are on the next reaction.
Will buyers aggressively defend these lower levels, or is another wave of selling about to hit Gold and Silver?
$545 BILLION WIPED FROM GOLD AND SILVER IN JUST 25 MINUTES.
Gold suffered a sudden breakdown, with heavy selling pressure driving price sharply lower from the $4,420 region toward $4,380.
Silver followed with an even more aggressive move, sliding from around $68 to below $67 as sellers took control.
This wasn’t a slow correction. The speed and size of the move show how quickly market sentiment can flip when major positions begin unwinding.
Now all eyes are on the next reaction.
Will buyers aggressively defend these lower levels, or is another wave of selling about to hit Gold and Silver?
2
2
500
·
--
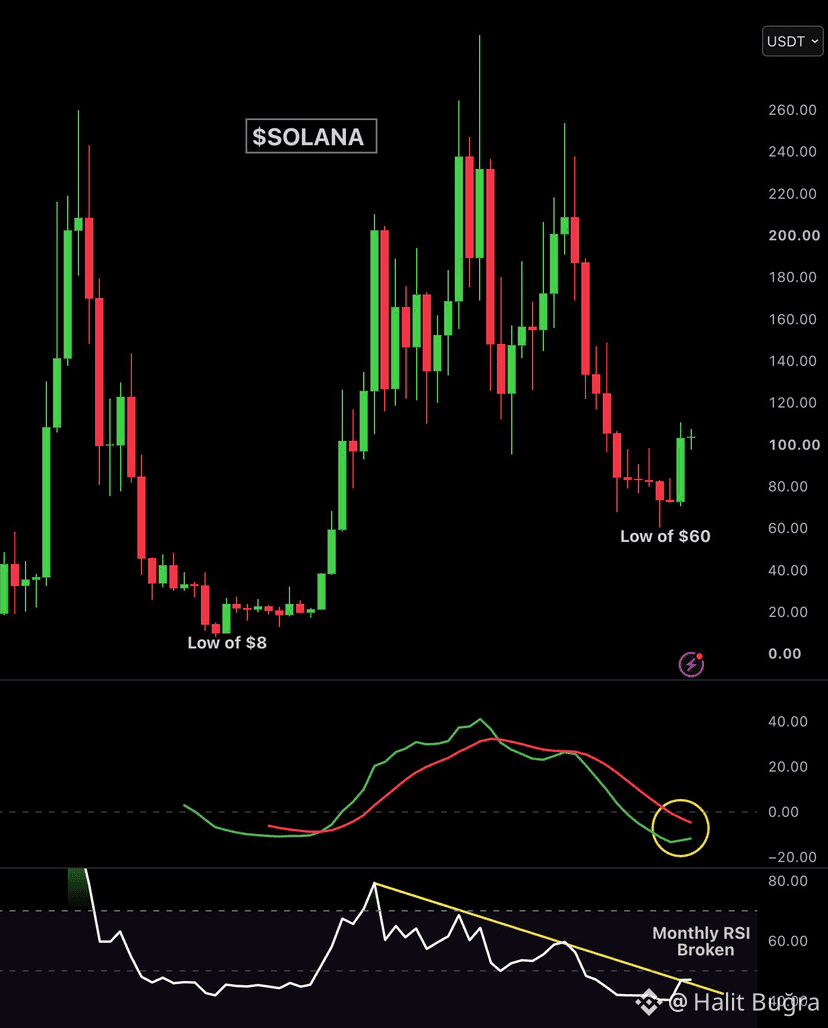
$SOL IS STARTING TO LOOK SERIOUSLY BULLISH.
After 10 straight months without a green monthly close, SOL has finally flipped the script and printed one.
The monthly MACD is now getting close to a bullish crossover, while the monthly RSI has broken above a 2-year downtrend.
These are higher-timeframe signals, and when they start aligning together, the bigger picture becomes hard to ignore.
If momentum continues and SOL holds this shift in structure, this could be the early stage of a much larger bullish reversal.
The next few monthly candles could tell us everything.
Is $SOL waking up for its next major run?
$SOL IS STARTING TO LOOK SERIOUSLY BULLISH.
After 10 straight months without a green monthly close, SOL has finally flipped the script and printed one.
The monthly MACD is now getting close to a bullish crossover, while the monthly RSI has broken above a 2-year downtrend.
These are higher-timeframe signals, and when they start aligning together, the bigger picture becomes hard to ignore.
If momentum continues and SOL holds this shift in structure, this could be the early stage of a much larger bullish reversal.
The next few monthly candles could tell us everything.
Is $SOL waking up for its next major run?
After 10 straight months without a green monthly close, SOL has finally flipped the script and printed one.
The monthly MACD is now getting close to a bullish crossover, while the monthly RSI has broken above a 2-year downtrend.
These are higher-timeframe signals, and when they start aligning together, the bigger picture becomes hard to ignore.
If momentum continues and SOL holds this shift in structure, this could be the early stage of a much larger bullish reversal.
The next few monthly candles could tell us everything.
Is $SOL waking up for its next major run?
7
7
520
·
--
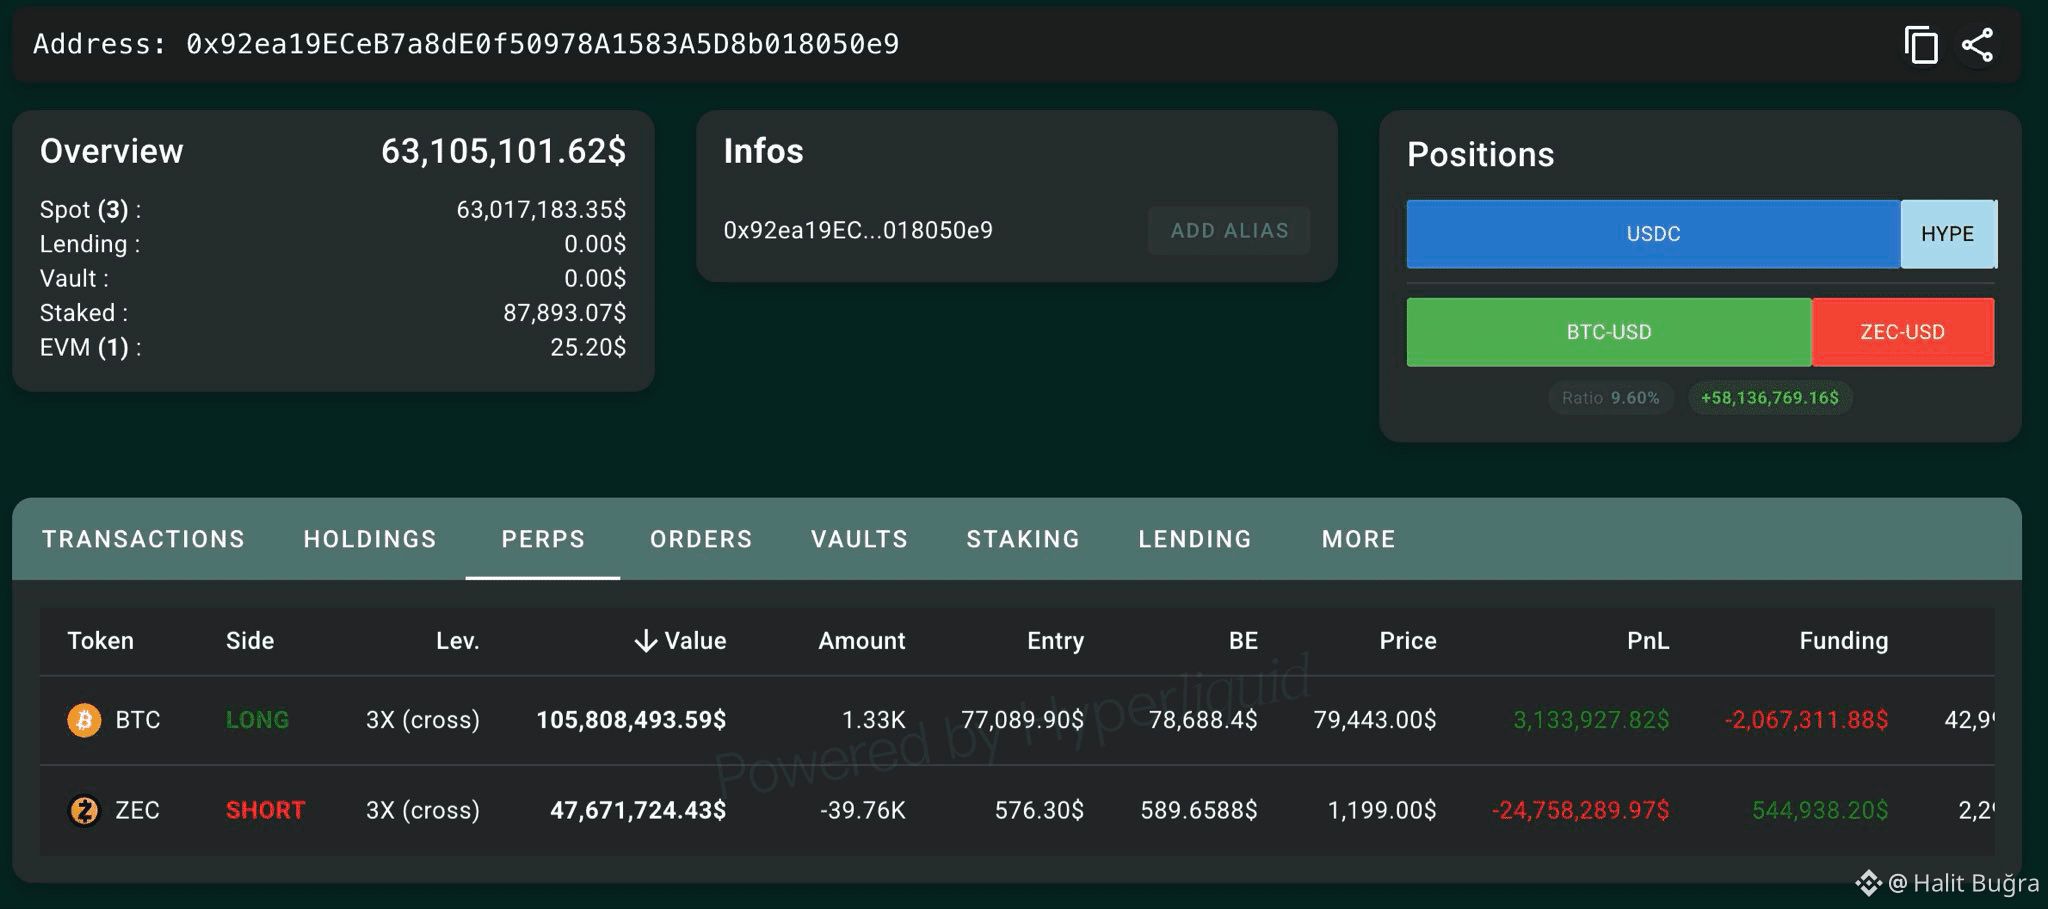
🚨 𝗚𝗔𝗥𝗥𝗘𝗧𝗧 𝗝𝗜𝗡 𝗜𝗦 𝗡𝗢𝗪 𝗗𝗢𝗪𝗡 𝗢𝗩𝗘𝗥 $𝟮𝟰 𝗠𝗜𝗟𝗟𝗜𝗢𝗡 𝗢𝗡 𝗛𝗜𝗦 𝗠𝗔𝗦𝗦𝗜𝗩𝗘 𝗭𝗘𝗖 𝗦𝗛𝗢𝗥𝗧.
Instead of cutting the position, he’s doubling down.
Jin reportedly added another $8.4M to the trade, bringing his total $ZEC short exposure to roughly $47M.
According to the position shown, his average entry sits near $576, while $ZEC is trading around $1,199 — leaving the position with approximately $24.76M in unrealized losses.
His liquidation level is reportedly around $2,292, meaning the trade still has room before forced liquidation, but the size of the drawdown is already enormous.
What makes this even crazier is the history.
Back in June, Jin reportedly made $11.24M shorting Zcash.
Now he’s back on the same side of the trade — except this time ZEC has moved violently against him, wiping out more than twice that previous profit on paper.
And he still hasn’t closed.
$47M short. $24M+ underwater. Still adding.
This is quickly becoming one of the wildest $ZEC whale positions to watch on-chain. 👀
🚨 𝗚𝗔𝗥𝗥𝗘𝗧𝗧 𝗝𝗜𝗡 𝗜𝗦 𝗡𝗢𝗪 𝗗𝗢𝗪𝗡 𝗢𝗩𝗘𝗥 $𝟮𝟰 𝗠𝗜𝗟𝗟𝗜𝗢𝗡 𝗢𝗡 𝗛𝗜𝗦 𝗠𝗔𝗦𝗦𝗜𝗩𝗘 𝗭𝗘𝗖 𝗦𝗛𝗢𝗥𝗧.
Instead of cutting the position, he’s doubling down.
Jin reportedly added another $8.4M to the trade, bringing his total $ZEC short exposure to roughly $47M.
According to the position shown, his average entry sits near $576, while $ZEC is trading around $1,199 — leaving the position with approximately $24.76M in unrealized losses.
His liquidation level is reportedly around $2,292, meaning the trade still has room before forced liquidation, but the size of the drawdown is already enormous.
What makes this even crazier is the history.
Back in June, Jin reportedly made $11.24M shorting Zcash.
Now he’s back on the same side of the trade — except this time ZEC has moved violently against him, wiping out more than twice that previous profit on paper.
And he still hasn’t closed.
$47M short. $24M+ underwater. Still adding.
This is quickly becoming one of the wildest $ZEC whale positions to watch on-chain. 👀
Instead of cutting the position, he’s doubling down.
Jin reportedly added another $8.4M to the trade, bringing his total $ZEC short exposure to roughly $47M.
According to the position shown, his average entry sits near $576, while $ZEC is trading around $1,199 — leaving the position with approximately $24.76M in unrealized losses.
His liquidation level is reportedly around $2,292, meaning the trade still has room before forced liquidation, but the size of the drawdown is already enormous.
What makes this even crazier is the history.
Back in June, Jin reportedly made $11.24M shorting Zcash.
Now he’s back on the same side of the trade — except this time ZEC has moved violently against him, wiping out more than twice that previous profit on paper.
And he still hasn’t closed.
$47M short. $24M+ underwater. Still adding.
This is quickly becoming one of the wildest $ZEC whale positions to watch on-chain. 👀
8
6
340
·
--
RED PACKET IS LIVE!
I’m sharing a RED PACKET with my community.
Want to grab your share?
How to participate:
1. Follow me
2. Comment “YES” below
3. Repost this post
4. Stay active and keep notifications ON
That’s it.
Don’t just scroll past — join in before you miss your chance.
Who’s ready?
COMMENT “YES” NOW!
LET’S GO!
RED PACKET IS LIVE!
I’m sharing a RED PACKET with my community.
Want to grab your share?
How to participate:
1. Follow me
2. Comment “YES” below
3. Repost this post
4. Stay active and keep notifications ON
That’s it.
Don’t just scroll past — join in before you miss your chance.
Who’s ready?
COMMENT “YES” NOW!
LET’S GO!
I’m sharing a RED PACKET with my community.
Want to grab your share?
How to participate:
1. Follow me
2. Comment “YES” below
3. Repost this post
4. Stay active and keep notifications ON
That’s it.
Don’t just scroll past — join in before you miss your chance.
Who’s ready?
COMMENT “YES” NOW!
LET’S GO!
1.1k
4
56
1.1k
·
--
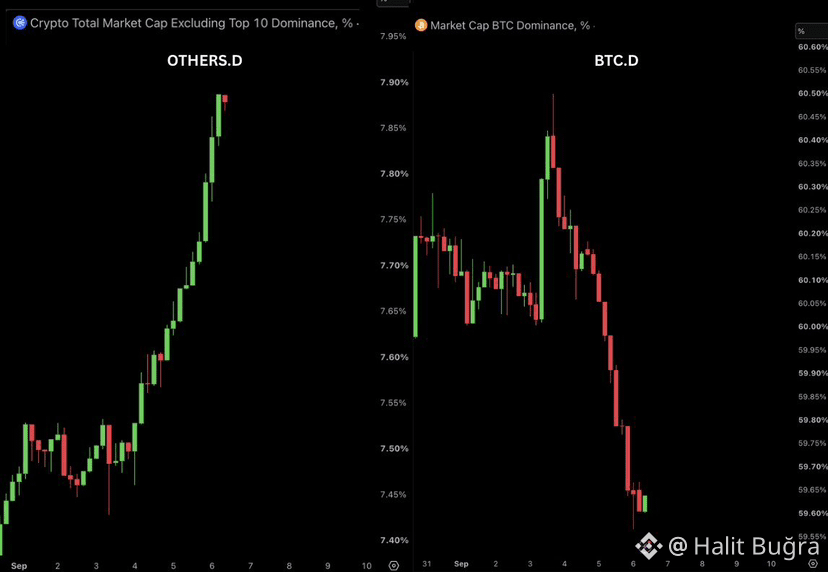
BITCOIN DOMINANCE IS DUMPING — ALTCOIN DOMINANCE IS PUMPING.
This is exactly the kind of market shift altcoin traders have been waiting for.
When BTC dominance starts losing strength, it can signal that capital is rotating away from Bitcoin and flowing deeper into the altcoin market.
If this trend continues, stronger alts could start outperforming $BTC and we may see momentum spread across multiple sectors.
The key now is continuation.
Falling BTC dominance + rising ALT dominance could create the conditions for a much stronger altcoin phase.
Keep your eyes on the charts.
The rotation may just be getting started.
BITCOIN DOMINANCE IS DUMPING — ALTCOIN DOMINANCE IS PUMPING.
This is exactly the kind of market shift altcoin traders have been waiting for.
When BTC dominance starts losing strength, it can signal that capital is rotating away from Bitcoin and flowing deeper into the altcoin market.
If this trend continues, stronger alts could start outperforming $BTC and we may see momentum spread across multiple sectors.
The key now is continuation.
Falling BTC dominance + rising ALT dominance could create the conditions for a much stronger altcoin phase.
Keep your eyes on the charts.
The rotation may just be getting started.
This is exactly the kind of market shift altcoin traders have been waiting for.
When BTC dominance starts losing strength, it can signal that capital is rotating away from Bitcoin and flowing deeper into the altcoin market.
If this trend continues, stronger alts could start outperforming $BTC and we may see momentum spread across multiple sectors.
The key now is continuation.
Falling BTC dominance + rising ALT dominance could create the conditions for a much stronger altcoin phase.
Keep your eyes on the charts.
The rotation may just be getting started.
7
9
1.4k
·
--
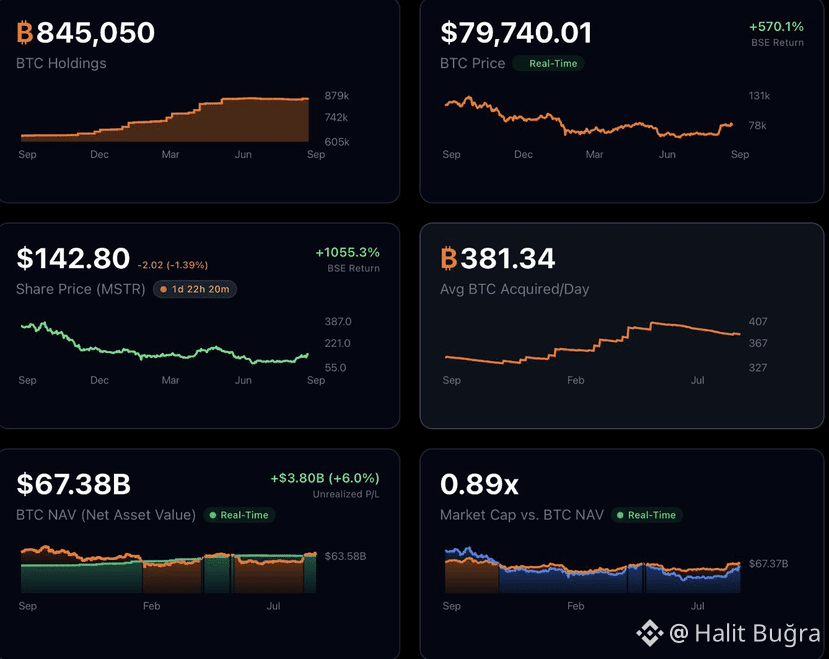
𝗕𝗥𝗘𝗔𝗞𝗜𝗡𝗚: 𝗠𝗜𝗖𝗛𝗔𝗘𝗟 𝗦𝗔𝗬𝗟𝗢𝗥’𝗦 𝗦𝗧𝗥𝗔𝗧𝗘𝗚𝗬 𝗜𝗦 𝗡𝗢𝗪 𝗦𝗜𝗧𝗧𝗜𝗡𝗚 𝗢𝗡 𝗔 𝗠𝗔𝗦𝗦𝗜𝗩𝗘 $𝟯.𝟴 𝗕𝗜𝗟𝗟𝗜𝗢𝗡 𝗜𝗡 𝗨𝗡𝗥𝗘𝗔𝗟𝗜𝗭𝗘𝗗 𝗚𝗔𝗜𝗡𝗦 𝗢𝗡 𝗜𝗧𝗦 $𝗕𝗧𝗖 𝗣𝗢𝗦𝗜𝗧𝗜𝗢𝗡.
Strategy’s aggressive Bitcoin bet is once again showing just how powerful its long-term accumulation strategy can become when $BTC moves higher.
Michael Saylor has spent years positioning Bitcoin as a core treasury asset, repeatedly adding BTC through different market cycles instead of treating it as a short-term trade.
Now, billions in unrealized gains highlight the scale of that conviction.
The gains remain “unrealized,” meaning they exist on paper and can rise or fall with Bitcoin’s price. But the numbers show why Strategy has become one of the biggest institutional symbols of Bitcoin adoption.
Saylor didn’t just talk about Bitcoin.
He built an entire corporate strategy around it.
𝗕𝗥𝗘𝗔𝗞𝗜𝗡𝗚: 𝗠𝗜𝗖𝗛𝗔𝗘𝗟 𝗦𝗔𝗬𝗟𝗢𝗥’𝗦 𝗦𝗧𝗥𝗔𝗧𝗘𝗚𝗬 𝗜𝗦 𝗡𝗢𝗪 𝗦𝗜𝗧𝗧𝗜𝗡𝗚 𝗢𝗡 𝗔 𝗠𝗔𝗦𝗦𝗜𝗩𝗘 $𝟯.𝟴 𝗕𝗜𝗟𝗟𝗜𝗢𝗡 𝗜𝗡 𝗨𝗡𝗥𝗘𝗔𝗟𝗜𝗭𝗘𝗗 𝗚𝗔𝗜𝗡𝗦 𝗢𝗡 𝗜𝗧𝗦 $𝗕𝗧𝗖 𝗣𝗢𝗦𝗜𝗧𝗜𝗢𝗡.
Strategy’s aggressive Bitcoin bet is once again showing just how powerful its long-term accumulation strategy can become when $BTC moves higher.
Michael Saylor has spent years positioning Bitcoin as a core treasury asset, repeatedly adding BTC through different market cycles instead of treating it as a short-term trade.
Now, billions in unrealized gains highlight the scale of that conviction.
The gains remain “unrealized,” meaning they exist on paper and can rise or fall with Bitcoin’s price. But the numbers show why Strategy has become one of the biggest institutional symbols of Bitcoin adoption.
Saylor didn’t just talk about Bitcoin.
He built an entire corporate strategy around it.
Strategy’s aggressive Bitcoin bet is once again showing just how powerful its long-term accumulation strategy can become when $BTC moves higher.
Michael Saylor has spent years positioning Bitcoin as a core treasury asset, repeatedly adding BTC through different market cycles instead of treating it as a short-term trade.
Now, billions in unrealized gains highlight the scale of that conviction.
The gains remain “unrealized,” meaning they exist on paper and can rise or fall with Bitcoin’s price. But the numbers show why Strategy has become one of the biggest institutional symbols of Bitcoin adoption.
Saylor didn’t just talk about Bitcoin.
He built an entire corporate strategy around it.
7
9
594
·
--
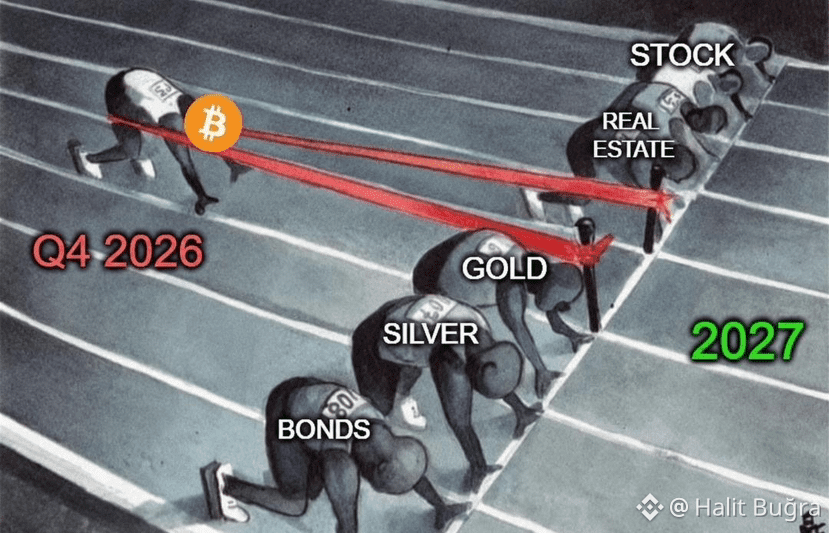
BULL MARKET 2027 COULD CHANGE THE RACE COMPLETELY.
Bitcoin appears ready to break away from the pack while stocks, real estate, gold, silver, and bonds fight to keep pace.
The message behind this image is clear: traditional assets may have their moments, but Bitcoin could enter 2027 carrying much stronger momentum.
If capital starts rotating toward risk assets and crypto liquidity expands, Bitcoin could become one of the biggest stories of the next market cycle.
Nothing moves in a straight line, though. Corrections, volatility, macro conditions, and investor sentiment can quickly reshape the race.
2027 could be a year worth watching closely.
DYOR…
BULL MARKET 2027 COULD CHANGE THE RACE COMPLETELY.
Bitcoin appears ready to break away from the pack while stocks, real estate, gold, silver, and bonds fight to keep pace.
The message behind this image is clear: traditional assets may have their moments, but Bitcoin could enter 2027 carrying much stronger momentum.
If capital starts rotating toward risk assets and crypto liquidity expands, Bitcoin could become one of the biggest stories of the next market cycle.
Nothing moves in a straight line, though. Corrections, volatility, macro conditions, and investor sentiment can quickly reshape the race.
2027 could be a year worth watching closely.
DYOR…
Bitcoin appears ready to break away from the pack while stocks, real estate, gold, silver, and bonds fight to keep pace.
The message behind this image is clear: traditional assets may have their moments, but Bitcoin could enter 2027 carrying much stronger momentum.
If capital starts rotating toward risk assets and crypto liquidity expands, Bitcoin could become one of the biggest stories of the next market cycle.
Nothing moves in a straight line, though. Corrections, volatility, macro conditions, and investor sentiment can quickly reshape the race.
2027 could be a year worth watching closely.
DYOR…
2
309
·
--
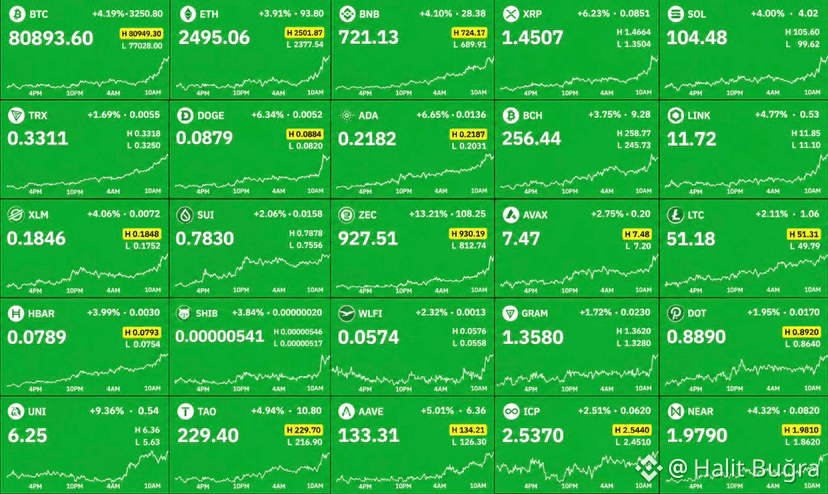
🚨 BREAKING: $125 BILLION FLOODS INTO THE CRYPTO MARKET AS BITCOIN SMASHES THROUGH $81,000!
The crypto market just witnessed a powerful wave of fresh capital, with roughly $125,000,000,000 added to total market value as Bitcoin surged to $81K.
The rapid move caught leveraged traders on the wrong side of the market, triggering another aggressive short squeeze.
In just 60 minutes, more than $150 MILLION worth of leveraged positions were liquidated, adding even more fuel to the volatility.
And Bitcoin isn’t moving alone.
Ethereum, BNB, XRP, Solana, Dogecoin, Cardano and several other major altcoins are flashing green as buying pressure spreads across the broader market.
When shorts are forced to close, they have to buy back into the market — which can accelerate an already fast rally and create a cascade of liquidations.
BTC reclaiming $81K + billions flowing back into crypto + heavy short liquidations = momentum is heating up fast.
Now the big question:
Is this just another short squeeze… or the beginning of a much bigger crypto breakout? 👀🔥
🚨 BREAKING: $125 BILLION FLOODS INTO THE CRYPTO MARKET AS BITCOIN SMASHES THROUGH $81,000!
The crypto market just witnessed a powerful wave of fresh capital, with roughly $125,000,000,000 added to total market value as Bitcoin surged to $81K.
The rapid move caught leveraged traders on the wrong side of the market, triggering another aggressive short squeeze.
In just 60 minutes, more than $150 MILLION worth of leveraged positions were liquidated, adding even more fuel to the volatility.
And Bitcoin isn’t moving alone.
Ethereum, BNB, XRP, Solana, Dogecoin, Cardano and several other major altcoins are flashing green as buying pressure spreads across the broader market.
When shorts are forced to close, they have to buy back into the market — which can accelerate an already fast rally and create a cascade of liquidations.
BTC reclaiming $81K + billions flowing back into crypto + heavy short liquidations = momentum is heating up fast.
Now the big question:
Is this just another short squeeze… or the beginning of a much bigger crypto breakout? 👀🔥
The crypto market just witnessed a powerful wave of fresh capital, with roughly $125,000,000,000 added to total market value as Bitcoin surged to $81K.
The rapid move caught leveraged traders on the wrong side of the market, triggering another aggressive short squeeze.
In just 60 minutes, more than $150 MILLION worth of leveraged positions were liquidated, adding even more fuel to the volatility.
And Bitcoin isn’t moving alone.
Ethereum, BNB, XRP, Solana, Dogecoin, Cardano and several other major altcoins are flashing green as buying pressure spreads across the broader market.
When shorts are forced to close, they have to buy back into the market — which can accelerate an already fast rally and create a cascade of liquidations.
BTC reclaiming $81K + billions flowing back into crypto + heavy short liquidations = momentum is heating up fast.
Now the big question:
Is this just another short squeeze… or the beginning of a much bigger crypto breakout? 👀🔥
9
11
769
·
--
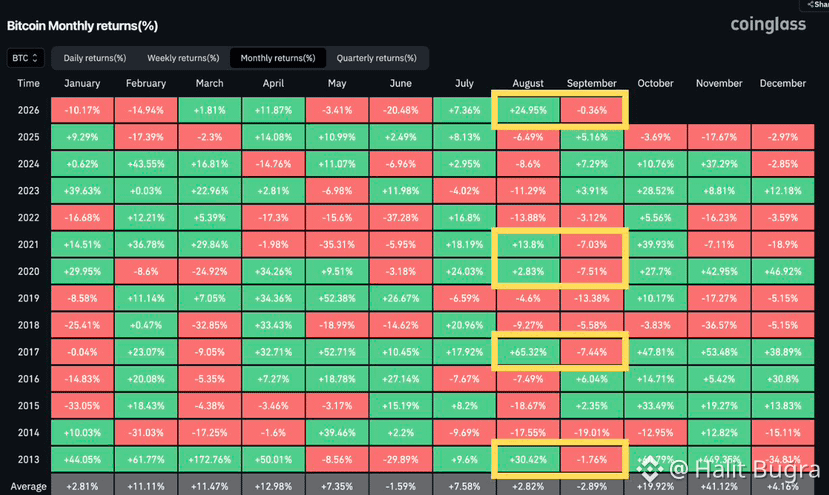
BITCOIN IS ENTERING SEPTEMBER WITH HISTORY WORKING AGAINST IT.
Every time Bitcoin has managed to close August in the green, September has historically had a strong tendency to reverse the momentum and finish in the red.
That makes the current setup especially interesting.
August strength suggests buyers were willing to absorb selling pressure, but September has long carried a reputation as one of Bitcoin’s more difficult months.
Now the market faces another test.
If $BTC follows the historical pattern, August’s bullish close could turn into a September pullback, with traders potentially taking profits and liquidity getting tested below current levels.
But if Bitcoin breaks the pattern and closes September green, the signal could be much more important.
It would show that current demand is strong enough to overcome a seasonal trend traders have been watching for years — potentially strengthening the case for continued momentum into Q4.
History favors caution.
The market is trying to rewrite history.
Will September punish Bitcoin bulls again, or is this finally the year BTC breaks the cycle?
BITCOIN IS ENTERING SEPTEMBER WITH HISTORY WORKING AGAINST IT.
Every time Bitcoin has managed to close August in the green, September has historically had a strong tendency to reverse the momentum and finish in the red.
That makes the current setup especially interesting.
August strength suggests buyers were willing to absorb selling pressure, but September has long carried a reputation as one of Bitcoin’s more difficult months.
Now the market faces another test.
If $BTC follows the historical pattern, August’s bullish close could turn into a September pullback, with traders potentially taking profits and liquidity getting tested below current levels.
But if Bitcoin breaks the pattern and closes September green, the signal could be much more important.
It would show that current demand is strong enough to overcome a seasonal trend traders have been watching for years — potentially strengthening the case for continued momentum into Q4.
History favors caution.
The market is trying to rewrite history.
Will September punish Bitcoin bulls again, or is this finally the year BTC breaks the cycle?
Every time Bitcoin has managed to close August in the green, September has historically had a strong tendency to reverse the momentum and finish in the red.
That makes the current setup especially interesting.
August strength suggests buyers were willing to absorb selling pressure, but September has long carried a reputation as one of Bitcoin’s more difficult months.
Now the market faces another test.
If $BTC follows the historical pattern, August’s bullish close could turn into a September pullback, with traders potentially taking profits and liquidity getting tested below current levels.
But if Bitcoin breaks the pattern and closes September green, the signal could be much more important.
It would show that current demand is strong enough to overcome a seasonal trend traders have been watching for years — potentially strengthening the case for continued momentum into Q4.
History favors caution.
The market is trying to rewrite history.
Will September punish Bitcoin bulls again, or is this finally the year BTC breaks the cycle?
9
10
204
·
--
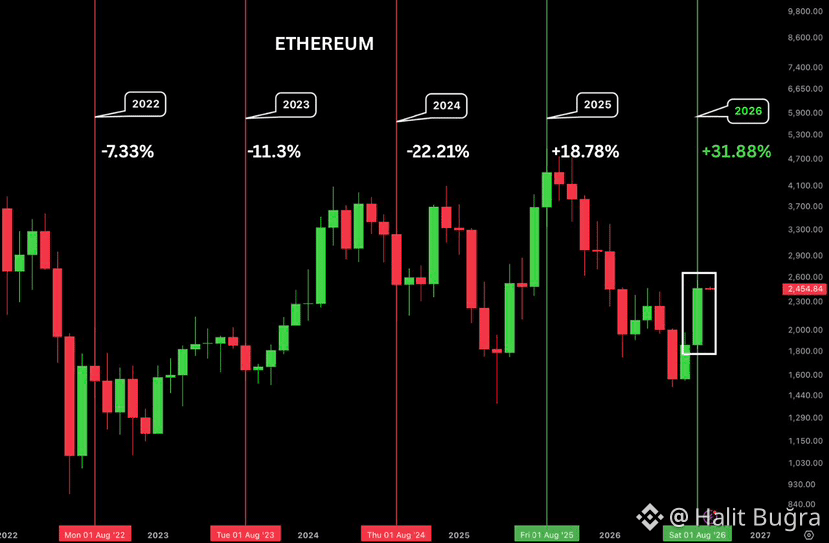
ETHEREUM JUST PULLED OFF ITS STRONGEST AUGUST IN 4 YEARS.
August has usually been a rough month for ETH.
2022: -7.33%
2023: -11.30%
2024: -22.21%
2025: +18.78%
But 2026 completely changed the picture.
ETH closed August +31.88%, marking a huge shift from the weakness we saw in previous years.
What stands out isn’t just the number — it’s the change in momentum. After spending months under pressure, buyers stepped in aggressively and turned August into a breakout month.
Now comes the important part.
Can ETH carry this strength into September, or was August the big move everyone was waiting for?
Either way, +31.88% in a single month is hard to ignore.
$ETH is showing real strength again. 👀
ETHEREUM JUST PULLED OFF ITS STRONGEST AUGUST IN 4 YEARS.
August has usually been a rough month for ETH.
2022: -7.33%
2023: -11.30%
2024: -22.21%
2025: +18.78%
But 2026 completely changed the picture.
ETH closed August +31.88%, marking a huge shift from the weakness we saw in previous years.
What stands out isn’t just the number — it’s the change in momentum. After spending months under pressure, buyers stepped in aggressively and turned August into a breakout month.
Now comes the important part.
Can ETH carry this strength into September, or was August the big move everyone was waiting for?
Either way, +31.88% in a single month is hard to ignore.
$ETH is showing real strength again. 👀
August has usually been a rough month for ETH.
2022: -7.33%
2023: -11.30%
2024: -22.21%
2025: +18.78%
But 2026 completely changed the picture.
ETH closed August +31.88%, marking a huge shift from the weakness we saw in previous years.
What stands out isn’t just the number — it’s the change in momentum. After spending months under pressure, buyers stepped in aggressively and turned August into a breakout month.
Now comes the important part.
Can ETH carry this strength into September, or was August the big move everyone was waiting for?
Either way, +31.88% in a single month is hard to ignore.
$ETH is showing real strength again. 👀
9
12
360
·
--
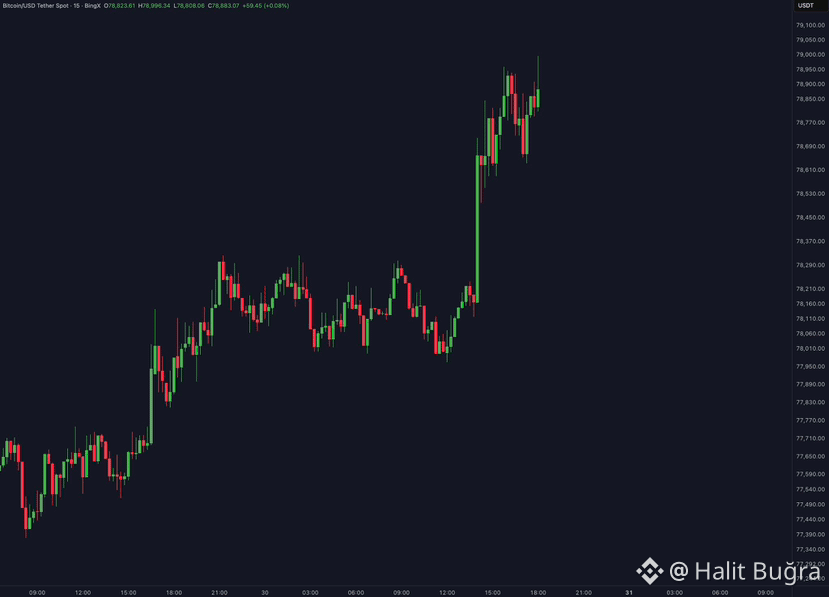
BITCOIN JUST HIT $79,000. 💥
BTC is showing serious strength as momentum continues to build across the market.
The $79K zone is now a key level to watch. Holding above it could open the door toward $80K and potentially trigger another wave of market momentum.
Volatility is rising, traders are watching closely, and the next few moves could define Bitcoin’s short-term direction.
All eyes on BTC. 👀🔥
BITCOIN JUST HIT $79,000. 💥
BTC is showing serious strength as momentum continues to build across the market.
The $79K zone is now a key level to watch. Holding above it could open the door toward $80K and potentially trigger another wave of market momentum.
Volatility is rising, traders are watching closely, and the next few moves could define Bitcoin’s short-term direction.
All eyes on BTC. 👀🔥
BTC is showing serious strength as momentum continues to build across the market.
The $79K zone is now a key level to watch. Holding above it could open the door toward $80K and potentially trigger another wave of market momentum.
Volatility is rising, traders are watching closely, and the next few moves could define Bitcoin’s short-term direction.
All eyes on BTC. 👀🔥
7
8
400
·
--
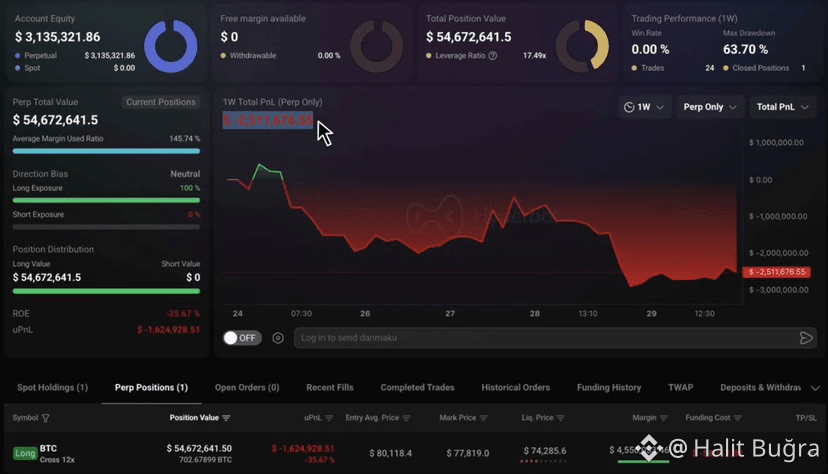
SOMEONE IS ABOUT TO LOSE EVERYTHING?
A massive $54.73 MILLION Bitcoin long position is now under serious pressure.
Entry price: $80,118
The position is already sitting on an unrealized loss of roughly $1.56 MILLION.
The critical number is $74,286 — the reported liquidation level.
If Bitcoin keeps dropping toward that zone, this trade could turn into a brutal liquidation event.
With this much capital on the line, every move matters now.
One position. Tens of millions exposed. A liquidation level getting dangerously close.
Bitcoin volatility could make the next move extremely interesting.
SOMEONE IS ABOUT TO LOSE EVERYTHING?
A massive $54.73 MILLION Bitcoin long position is now under serious pressure.
Entry price: $80,118
The position is already sitting on an unrealized loss of roughly $1.56 MILLION.
The critical number is $74,286 — the reported liquidation level.
If Bitcoin keeps dropping toward that zone, this trade could turn into a brutal liquidation event.
With this much capital on the line, every move matters now.
One position. Tens of millions exposed. A liquidation level getting dangerously close.
Bitcoin volatility could make the next move extremely interesting.
A massive $54.73 MILLION Bitcoin long position is now under serious pressure.
Entry price: $80,118
The position is already sitting on an unrealized loss of roughly $1.56 MILLION.
The critical number is $74,286 — the reported liquidation level.
If Bitcoin keeps dropping toward that zone, this trade could turn into a brutal liquidation event.
With this much capital on the line, every move matters now.
One position. Tens of millions exposed. A liquidation level getting dangerously close.
Bitcoin volatility could make the next move extremely interesting.
7
9
333
·
--
Partly True
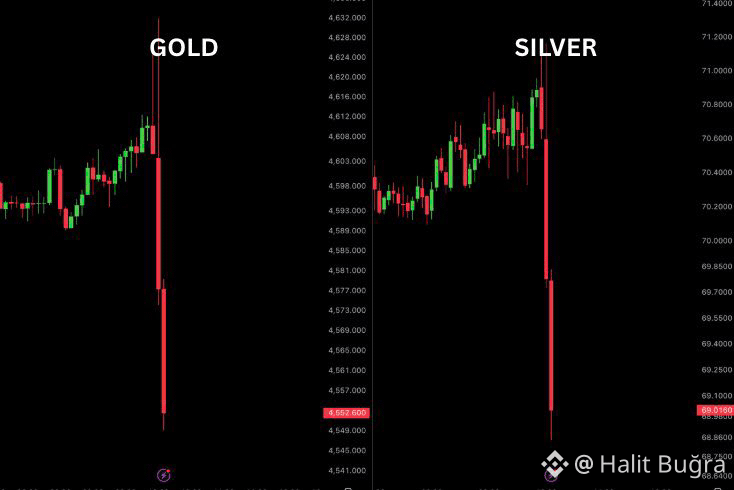
GOLD AND SILVER JUST SAW A MASSIVE DUMP.
$670 billion reportedly wiped out in just 7 minutes.
Selling pressure hit both precious metals aggressively, creating a huge liquidity flush.
Gold and silver are normally considered defensive assets, so a move this sharp deserves attention.
If buyers absorb the sell-off quickly, we could see a strong recovery.
But if key support levels break, another wave of selling could follow.
Watch the dollar, bonds, and equities closely.
Volatility is rising fast…
GOLD AND SILVER JUST SAW A MASSIVE DUMP.
$670 billion reportedly wiped out in just 7 minutes.
Selling pressure hit both precious metals aggressively, creating a huge liquidity flush.
Gold and silver are normally considered defensive assets, so a move this sharp deserves attention.
If buyers absorb the sell-off quickly, we could see a strong recovery.
But if key support levels break, another wave of selling could follow.
Watch the dollar, bonds, and equities closely.
Volatility is rising fast…
$670 billion reportedly wiped out in just 7 minutes.
Selling pressure hit both precious metals aggressively, creating a huge liquidity flush.
Gold and silver are normally considered defensive assets, so a move this sharp deserves attention.
If buyers absorb the sell-off quickly, we could see a strong recovery.
But if key support levels break, another wave of selling could follow.
Watch the dollar, bonds, and equities closely.
Volatility is rising fast…
7
8
931
·
--
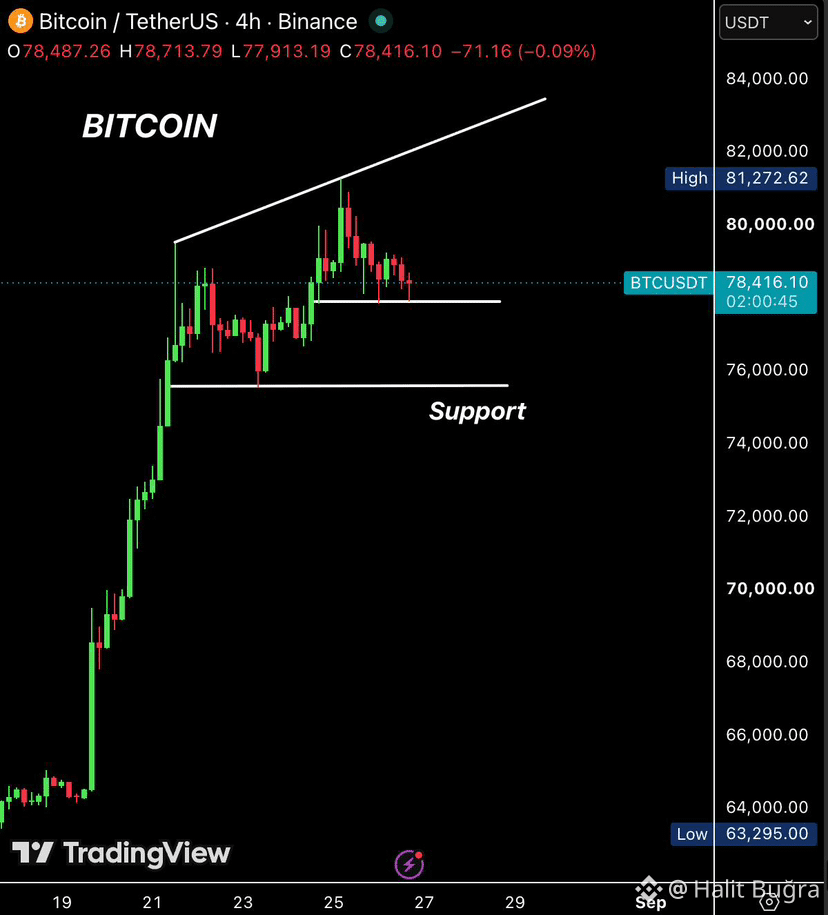
𝗕𝗜𝗧𝗖𝗢𝗜𝗡 𝗜𝗦 𝗖𝗢𝗡𝗦𝗢𝗟𝗜𝗗𝗔𝗧𝗜𝗡𝗚 𝗔𝗙𝗧𝗘𝗥 𝗔 𝗠𝗔𝗦𝗦𝗜𝗩𝗘 $𝟭𝟱,𝟬𝟬𝟬 𝗥𝗘𝗖𝗢𝗩𝗘𝗥𝗬.
$BTC bounced aggressively from $63,300 and is now trading around $78,200.
Despite the current sideways movement, the broader structure remains constructive.
Bitcoin is still printing higher highs and higher lows, which means buyers continue to defend the trend.
The key level right now is $78,000.
Local support sits around $77,800, while the stronger demand zone remains between $75,500 and $76,000.
On the upside, $81,270 is the major level to watch.
This resistance becomes even more important because it aligns with the weekly MA 50. A clean breakout above this area could significantly strengthen bullish momentum.
From here, I’m watching two possible scenarios.
If Bitcoin holds $78,000, breaks the local trendline and buyers regain momentum, the next major target could be around $83,000.
But if $78,000 fails to hold, I’d expect liquidity below the current range to get tested.
That could send BTC back toward the $75,500–$76,000 support zone before Friday.
For now, there’s no reason to overcomplicate it.
$78,000 is the decision level.
Hold it → bulls can attack $81,270 and potentially $83,000.
Lose it → $76,000 becomes the next major test.
The next breakout from this consolidation could decide Bitcoin’s short-term direction.
𝗕𝗜𝗧𝗖𝗢𝗜𝗡 𝗜𝗦 𝗖𝗢𝗡𝗦𝗢𝗟𝗜𝗗𝗔𝗧𝗜𝗡𝗚 𝗔𝗙𝗧𝗘𝗥 𝗔 𝗠𝗔𝗦𝗦𝗜𝗩𝗘 $𝟭𝟱,𝟬𝟬𝟬 𝗥𝗘𝗖𝗢𝗩𝗘𝗥𝗬.
$BTC bounced aggressively from $63,300 and is now trading around $78,200.
Despite the current sideways movement, the broader structure remains constructive.
Bitcoin is still printing higher highs and higher lows, which means buyers continue to defend the trend.
The key level right now is $78,000.
Local support sits around $77,800, while the stronger demand zone remains between $75,500 and $76,000.
On the upside, $81,270 is the major level to watch.
This resistance becomes even more important because it aligns with the weekly MA 50. A clean breakout above this area could significantly strengthen bullish momentum.
From here, I’m watching two possible scenarios.
If Bitcoin holds $78,000, breaks the local trendline and buyers regain momentum, the next major target could be around $83,000.
But if $78,000 fails to hold, I’d expect liquidity below the current range to get tested.
That could send BTC back toward the $75,500–$76,000 support zone before Friday.
For now, there’s no reason to overcomplicate it.
$78,000 is the decision level.
Hold it → bulls can attack $81,270 and potentially $83,000.
Lose it → $76,000 becomes the next major test.
The next breakout from this consolidation could decide Bitcoin’s short-term direction.
$BTC bounced aggressively from $63,300 and is now trading around $78,200.
Despite the current sideways movement, the broader structure remains constructive.
Bitcoin is still printing higher highs and higher lows, which means buyers continue to defend the trend.
The key level right now is $78,000.
Local support sits around $77,800, while the stronger demand zone remains between $75,500 and $76,000.
On the upside, $81,270 is the major level to watch.
This resistance becomes even more important because it aligns with the weekly MA 50. A clean breakout above this area could significantly strengthen bullish momentum.
From here, I’m watching two possible scenarios.
If Bitcoin holds $78,000, breaks the local trendline and buyers regain momentum, the next major target could be around $83,000.
But if $78,000 fails to hold, I’d expect liquidity below the current range to get tested.
That could send BTC back toward the $75,500–$76,000 support zone before Friday.
For now, there’s no reason to overcomplicate it.
$78,000 is the decision level.
Hold it → bulls can attack $81,270 and potentially $83,000.
Lose it → $76,000 becomes the next major test.
The next breakout from this consolidation could decide Bitcoin’s short-term direction.
6
7
199
·
--
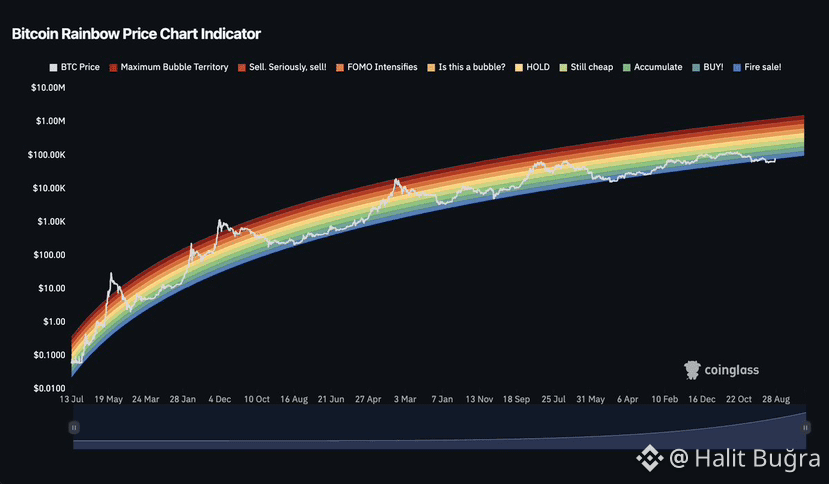
$BTC JUST RECLAIMED THE RAINBOW CHART — AND THE BIGGER PICTURE IS STARTING TO LOOK VERY INTERESTING.
Bitcoin has pushed back into the Rainbow Chart’s long-term valuation bands, putting BTC back inside a historical framework that tracks its price through different market-cycle zones.
The important part isn’t simply that Bitcoin crossed a colorful line.
The Rainbow Chart is built around a logarithmic growth model, so traders often use it as a broad cycle reference rather than a short-term trading indicator. Moving higher through these bands can signal that Bitcoin is progressing into a stronger phase of its long-term cycle.
What makes this especially interesting is what could happen if momentum continues.
If BTC holds its position and starts climbing through the higher valuation bands, market attention could shift rapidly from consolidation toward price discovery and cycle expansion.
But there’s an important catch.
The Rainbow Chart is not a prediction machine. Bitcoin has deviated from historical models before, and macro conditions, liquidity, institutional flows, regulation, and overall risk appetite can completely change how a cycle develops.
So reclaiming the chart alone doesn’t guarantee a massive rally.
Still, seeing Bitcoin regain this long-term structure is something worth watching closely.
If BTC keeps moving through the Rainbow bands instead of falling back below them, the next stage of this cycle could become much more interesting.
The real question now:
Is Bitcoin simply returning to its historical trend…
or preparing for the next major expansion?
$BTC JUST RECLAIMED THE RAINBOW CHART — AND THE BIGGER PICTURE IS STARTING TO LOOK VERY INTERESTING.
Bitcoin has pushed back into the Rainbow Chart’s long-term valuation bands, putting BTC back inside a historical framework that tracks its price through different market-cycle zones.
The important part isn’t simply that Bitcoin crossed a colorful line.
The Rainbow Chart is built around a logarithmic growth model, so traders often use it as a broad cycle reference rather than a short-term trading indicator. Moving higher through these bands can signal that Bitcoin is progressing into a stronger phase of its long-term cycle.
What makes this especially interesting is what could happen if momentum continues.
If BTC holds its position and starts climbing through the higher valuation bands, market attention could shift rapidly from consolidation toward price discovery and cycle expansion.
But there’s an important catch.
The Rainbow Chart is not a prediction machine. Bitcoin has deviated from historical models before, and macro conditions, liquidity, institutional flows, regulation, and overall risk appetite can completely change how a cycle develops.
So reclaiming the chart alone doesn’t guarantee a massive rally.
Still, seeing Bitcoin regain this long-term structure is something worth watching closely.
If BTC keeps moving through the Rainbow bands instead of falling back below them, the next stage of this cycle could become much more interesting.
The real question now:
Is Bitcoin simply returning to its historical trend…
or preparing for the next major expansion?
Bitcoin has pushed back into the Rainbow Chart’s long-term valuation bands, putting BTC back inside a historical framework that tracks its price through different market-cycle zones.
The important part isn’t simply that Bitcoin crossed a colorful line.
The Rainbow Chart is built around a logarithmic growth model, so traders often use it as a broad cycle reference rather than a short-term trading indicator. Moving higher through these bands can signal that Bitcoin is progressing into a stronger phase of its long-term cycle.
What makes this especially interesting is what could happen if momentum continues.
If BTC holds its position and starts climbing through the higher valuation bands, market attention could shift rapidly from consolidation toward price discovery and cycle expansion.
But there’s an important catch.
The Rainbow Chart is not a prediction machine. Bitcoin has deviated from historical models before, and macro conditions, liquidity, institutional flows, regulation, and overall risk appetite can completely change how a cycle develops.
So reclaiming the chart alone doesn’t guarantee a massive rally.
Still, seeing Bitcoin regain this long-term structure is something worth watching closely.
If BTC keeps moving through the Rainbow bands instead of falling back below them, the next stage of this cycle could become much more interesting.
The real question now:
Is Bitcoin simply returning to its historical trend…
or preparing for the next major expansion?
6
7
535
·
--
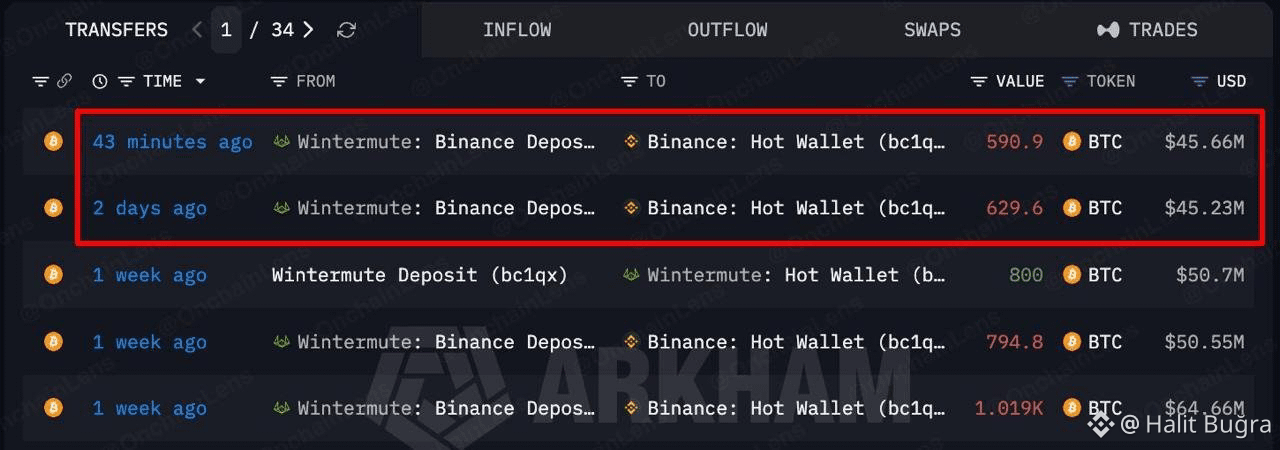
WINTERMUTE JUST MOVED ANOTHER 590.9 $BTC WORTH AROUND $45.66 MILLION.
The transfers are getting bigger.
This week alone, Wintermute has moved approximately 3,834.3 $BTC , valued at around $256.8 million.
Large movements from a major market maker always deserve attention, especially when hundreds of millions in Bitcoin start shifting within a short period.
The key now is where this liquidity ends up. If a significant portion moves toward exchanges, traders could start watching for potential sell-side pressure.
If the BTC is being repositioned between wallets or used for liquidity operations, the market impact could be very different.
Either way, $256.8M worth of Bitcoin moving in a single week is not something to ignore.
Keep watching the flows. The next destination matters.
WINTERMUTE JUST MOVED ANOTHER 590.9 $BTC WORTH AROUND $45.66 MILLION.
The transfers are getting bigger.
This week alone, Wintermute has moved approximately 3,834.3 $BTC , valued at around $256.8 million.
Large movements from a major market maker always deserve attention, especially when hundreds of millions in Bitcoin start shifting within a short period.
The key now is where this liquidity ends up. If a significant portion moves toward exchanges, traders could start watching for potential sell-side pressure.
If the BTC is being repositioned between wallets or used for liquidity operations, the market impact could be very different.
Either way, $256.8M worth of Bitcoin moving in a single week is not something to ignore.
Keep watching the flows. The next destination matters.
The transfers are getting bigger.
This week alone, Wintermute has moved approximately 3,834.3 $BTC , valued at around $256.8 million.
Large movements from a major market maker always deserve attention, especially when hundreds of millions in Bitcoin start shifting within a short period.
The key now is where this liquidity ends up. If a significant portion moves toward exchanges, traders could start watching for potential sell-side pressure.
If the BTC is being repositioned between wallets or used for liquidity operations, the market impact could be very different.
Either way, $256.8M worth of Bitcoin moving in a single week is not something to ignore.
Keep watching the flows. The next destination matters.
8
9
429
·
--
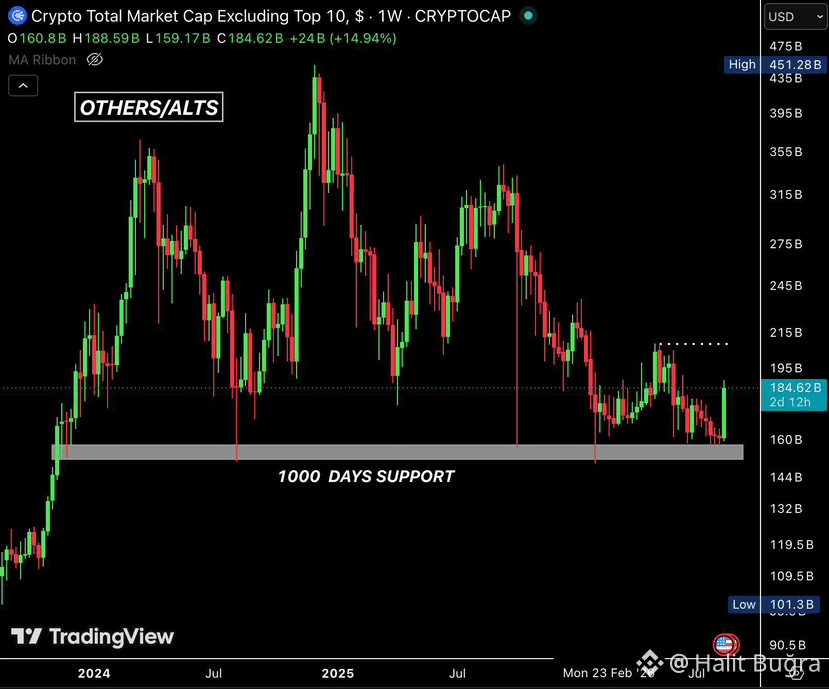
ALTCOINS ARE FINALLY WAKING UP
The altcoin market is starting to show signs of life again.
Total alt market cap has bounced from a long-term support range that has held for roughly 1,000 days, gaining around 15% this week as Bitcoin pushed through major resistance and reached $79K.
That bounce matters, but there’s an important detail: altcoins are still heavily dependent on Bitcoin.
Right now, $BTC is setting the direction. When Bitcoin expands higher, liquidity and confidence spill into ETH and larger-cap alts first, with the rest of the market following.
Bitcoin dominance is the key metric I’m watching.
BTC.D remains above 60%, showing that Bitcoin is still absorbing a large share of market liquidity. That usually isn’t the ideal environment for a broad low-cap altcoin run.
Historically, a move in BTC dominance below the 58% area would provide a much stronger signal that capital is rotating away from Bitcoin and deeper into the altcoin market.
So yes, the structure is improving.
Alts are bouncing, market sentiment is getting stronger, and Bitcoin breaking resistance gives the entire market more room to move.
But a bounce is not automatically an altseason.
For now, I’m watching whether BTC can hold its breakout while dominance begins trending lower. If those two conditions start happening together, the next phase for altcoins could become much more interesting.
Until then, confirmation matters more than excitement.
ALTCOINS ARE FINALLY WAKING UP
The altcoin market is starting to show signs of life again.
Total alt market cap has bounced from a long-term support range that has held for roughly 1,000 days, gaining around 15% this week as Bitcoin pushed through major resistance and reached $79K.
That bounce matters, but there’s an important detail: altcoins are still heavily dependent on Bitcoin.
Right now, $BTC is setting the direction. When Bitcoin expands higher, liquidity and confidence spill into ETH and larger-cap alts first, with the rest of the market following.
Bitcoin dominance is the key metric I’m watching.
BTC.D remains above 60%, showing that Bitcoin is still absorbing a large share of market liquidity. That usually isn’t the ideal environment for a broad low-cap altcoin run.
Historically, a move in BTC dominance below the 58% area would provide a much stronger signal that capital is rotating away from Bitcoin and deeper into the altcoin market.
So yes, the structure is improving.
Alts are bouncing, market sentiment is getting stronger, and Bitcoin breaking resistance gives the entire market more room to move.
But a bounce is not automatically an altseason.
For now, I’m watching whether BTC can hold its breakout while dominance begins trending lower. If those two conditions start happening together, the next phase for altcoins could become much more interesting.
Until then, confirmation matters more than excitement.
The altcoin market is starting to show signs of life again.
Total alt market cap has bounced from a long-term support range that has held for roughly 1,000 days, gaining around 15% this week as Bitcoin pushed through major resistance and reached $79K.
That bounce matters, but there’s an important detail: altcoins are still heavily dependent on Bitcoin.
Right now, $BTC is setting the direction. When Bitcoin expands higher, liquidity and confidence spill into ETH and larger-cap alts first, with the rest of the market following.
Bitcoin dominance is the key metric I’m watching.
BTC.D remains above 60%, showing that Bitcoin is still absorbing a large share of market liquidity. That usually isn’t the ideal environment for a broad low-cap altcoin run.
Historically, a move in BTC dominance below the 58% area would provide a much stronger signal that capital is rotating away from Bitcoin and deeper into the altcoin market.
So yes, the structure is improving.
Alts are bouncing, market sentiment is getting stronger, and Bitcoin breaking resistance gives the entire market more room to move.
But a bounce is not automatically an altseason.
For now, I’m watching whether BTC can hold its breakout while dominance begins trending lower. If those two conditions start happening together, the next phase for altcoins could become much more interesting.
Until then, confirmation matters more than excitement.
8
10
604
·
--
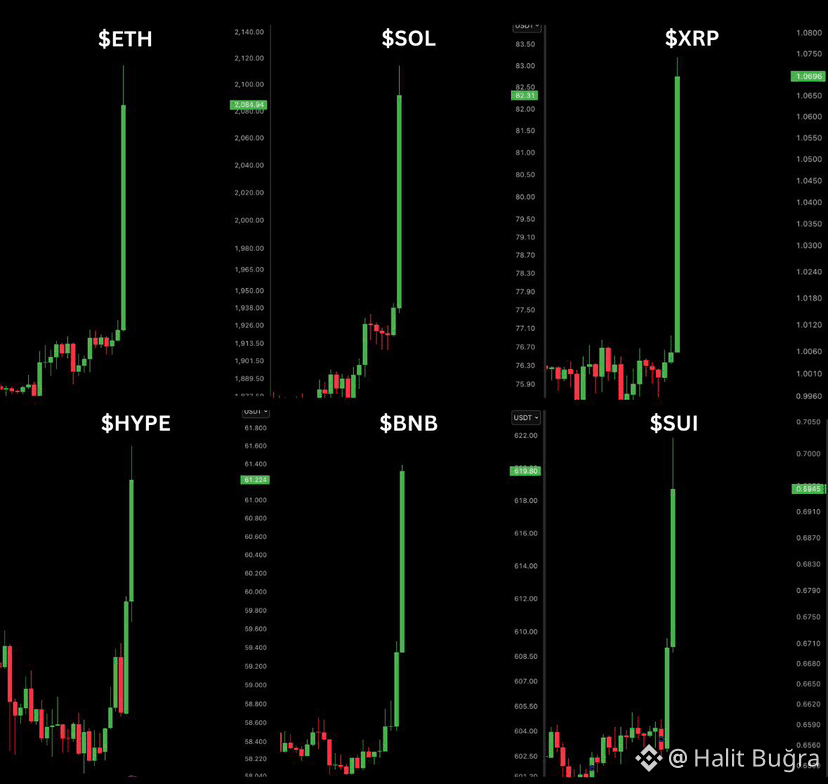
WE ARE BACK — THE CRYPTO MARKET JUST WOKE UP.
Green candles are hitting across the board, and this isn’t limited to one corner of the market.
$ETH pushed above $2,080.
$SOL exploded toward $82.
$XRP jumped above $1.06.
$HYPE surged past $61.
$BNB ripped toward $620.
$SUI climbed close to $0.70.
The important part is the synchronization. Multiple major assets are moving sharply at the same time, showing a sudden return of aggressive buying pressure.
After a long period of weakness and hesitation, this kind of broad market reaction is exactly what traders have been waiting to see.
One candle doesn’t confirm a full trend reversal, but momentum has clearly returned.
Now the real test begins: can buyers hold these levels and turn this explosive move into something bigger?
WE ARE SO BACK.
WE ARE BACK — THE CRYPTO MARKET JUST WOKE UP.
Green candles are hitting across the board, and this isn’t limited to one corner of the market.
$ETH pushed above $2,080.
$SOL exploded toward $82.
$XRP jumped above $1.06.
$HYPE surged past $61.
$BNB ripped toward $620.
$SUI climbed close to $0.70.
The important part is the synchronization. Multiple major assets are moving sharply at the same time, showing a sudden return of aggressive buying pressure.
After a long period of weakness and hesitation, this kind of broad market reaction is exactly what traders have been waiting to see.
One candle doesn’t confirm a full trend reversal, but momentum has clearly returned.
Now the real test begins: can buyers hold these levels and turn this explosive move into something bigger?
WE ARE SO BACK.
Green candles are hitting across the board, and this isn’t limited to one corner of the market.
$ETH pushed above $2,080.
$SOL exploded toward $82.
$XRP jumped above $1.06.
$HYPE surged past $61.
$BNB ripped toward $620.
$SUI climbed close to $0.70.
The important part is the synchronization. Multiple major assets are moving sharply at the same time, showing a sudden return of aggressive buying pressure.
After a long period of weakness and hesitation, this kind of broad market reaction is exactly what traders have been waiting to see.
One candle doesn’t confirm a full trend reversal, but momentum has clearly returned.
Now the real test begins: can buyers hold these levels and turn this explosive move into something bigger?
WE ARE SO BACK.
7
9
773
·
--
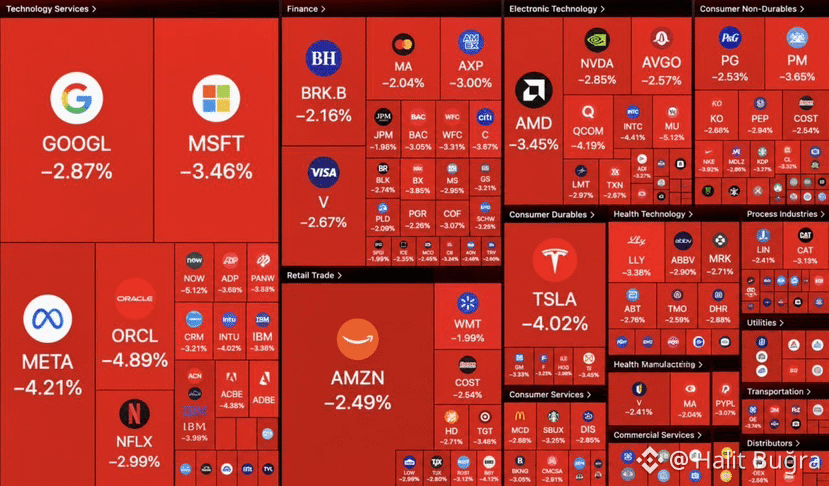
$200 BILLION VANISHED FROM U.S. STOCKS IN JUST 30 MINUTES.
Wall Street was hit by a brutal wave of selling as stocks flashed red across the board.
The trigger?
U.S. 30-year Treasury yields surged to their highest level in 19 years, putting fresh pressure on risk assets.
Higher long-term yields can tighten financial conditions and make equities less attractive, especially expensive growth and technology stocks.
When bond yields move this aggressively, markets pay attention fast.
The question now: is this just a sharp shakeout—or the beginning of something much bigger?
$200 BILLION VANISHED FROM U.S. STOCKS IN JUST 30 MINUTES.
Wall Street was hit by a brutal wave of selling as stocks flashed red across the board.
The trigger?
U.S. 30-year Treasury yields surged to their highest level in 19 years, putting fresh pressure on risk assets.
Higher long-term yields can tighten financial conditions and make equities less attractive, especially expensive growth and technology stocks.
When bond yields move this aggressively, markets pay attention fast.
The question now: is this just a sharp shakeout—or the beginning of something much bigger?
Wall Street was hit by a brutal wave of selling as stocks flashed red across the board.
The trigger?
U.S. 30-year Treasury yields surged to their highest level in 19 years, putting fresh pressure on risk assets.
Higher long-term yields can tighten financial conditions and make equities less attractive, especially expensive growth and technology stocks.
When bond yields move this aggressively, markets pay attention fast.
The question now: is this just a sharp shakeout—or the beginning of something much bigger?
8
10
528
Log in to explore more content
Join global crypto users on Binance Square
⚡️ Get latest and useful information about crypto.
💬 Trusted by the world’s largest crypto exchange.
👍 Discover real insights from verified creators.
Email / Phone number
Trending Topics
AppleDebutsFoldablePhone
1,020 views
66 Discussing
#appledebutsfoldablephone iPhone Fold 2026: Apple’s Secret Plan to Kill the Samsung Galaxy Z Fold 8iPhone Fold 2026: Apple’s Secret Plan to Kill the Samsung Galaxy Z Fold 8
Apple is poised to make its long-anticipated entry into the foldable smartphone market with the iPhone Fold, set for release in 2026. This strategic move positions Apple as a direct competitor to Samsung, which has maintained a dominant presence in the foldable segment since the launch of its Galaxy Z Fold series in 2019. By using its globally recognized brand and tightly integrated ecosystem, Apple aims to challenge Samsung’s leadership. However, this ambitious step brings with it critical considerations, including pricing strategies, supply chain readiness, and consumer trust in a first-generation foldable device.$NIL $IDOL $SPORTFUN
Isabella-I
·1 Likes
·16 views
US10YTreasuryYieldHitsHighestSinceNov2023
4,937 views
132 Discussing
USTreasuryToBuyBackUpTo$6BLongDatedDebt
8,693 views
127 Discussing