DYDX: Holds $0.10 Support Baseline After Liquidity Sweep – Strategic Long Execution Targeting Upper Triangle Boundary
dYdX (DYDX) is flashing clear bullish reversal signals on the daily timeframe as price action coils tightly into the terminal apex of a macro triangle pattern. The mid-August false breakdown (fakeout) beneath the lower boundary was swiftly absorbed by buy-side demand, clearing out overhang supply and establishing a solid technical base for an upcoming expansion leg.
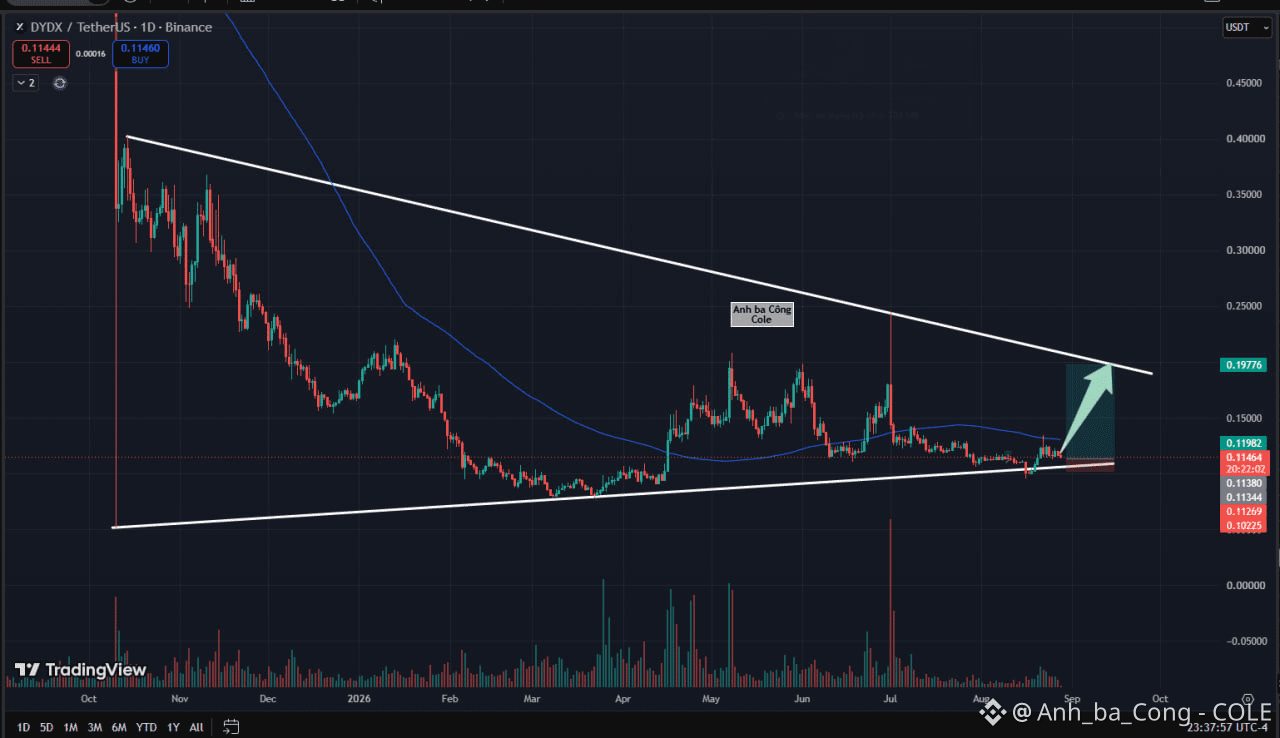
Based on the visual data from the daily chart , the recent dip below the lower triangle support and the $0.100 psychological round-number level served purely as a liquidity sweep to shake out weak hands. Daily price candles immediately bounced back, holding firmly above $0.100 to confirm aggressive buy-side absorption at this baseline. Supported by favorable broader market sentiment, sell-side exhaustion at this key junction sets the stage for a strong push toward the upper trendline ceiling.
This technical framework presents a high-edge trend-following Long opportunity with superior risk-to-reward parameters. The optimal trading strategy is to initiate Long positions around the current $0.114 level, placing a tight protective stop-loss parameter directly beneath the lower triangle floor near $0.102. The strategic take-profit target aims toward the upper triangle boundary near the $0.200 handle.
Disclaimer: This is not financial advice, DYOR. $DYDX $HEMI $SKR
dYdX (DYDX) is flashing clear bullish reversal signals on the daily timeframe as price action coils tightly into the terminal apex of a macro triangle pattern. The mid-August false breakdown (fakeout) beneath the lower boundary was swiftly absorbed by buy-side demand, clearing out overhang supply and establishing a solid technical base for an upcoming expansion leg.
Based on the visual data from the daily chart , the recent dip below the lower triangle support and the $0.100 psychological round-number level served purely as a liquidity sweep to shake out weak hands. Daily price candles immediately bounced back, holding firmly above $0.100 to confirm aggressive buy-side absorption at this baseline. Supported by favorable broader market sentiment, sell-side exhaustion at this key junction sets the stage for a strong push toward the upper trendline ceiling.
This technical framework presents a high-edge trend-following Long opportunity with superior risk-to-reward parameters. The optimal trading strategy is to initiate Long positions around the current $0.114 level, placing a tight protective stop-loss parameter directly beneath the lower triangle floor near $0.102. The strategic take-profit target aims toward the upper triangle boundary near the $0.200 handle.
Disclaimer: This is not financial advice, DYOR. $DYDX $HEMI $SKR