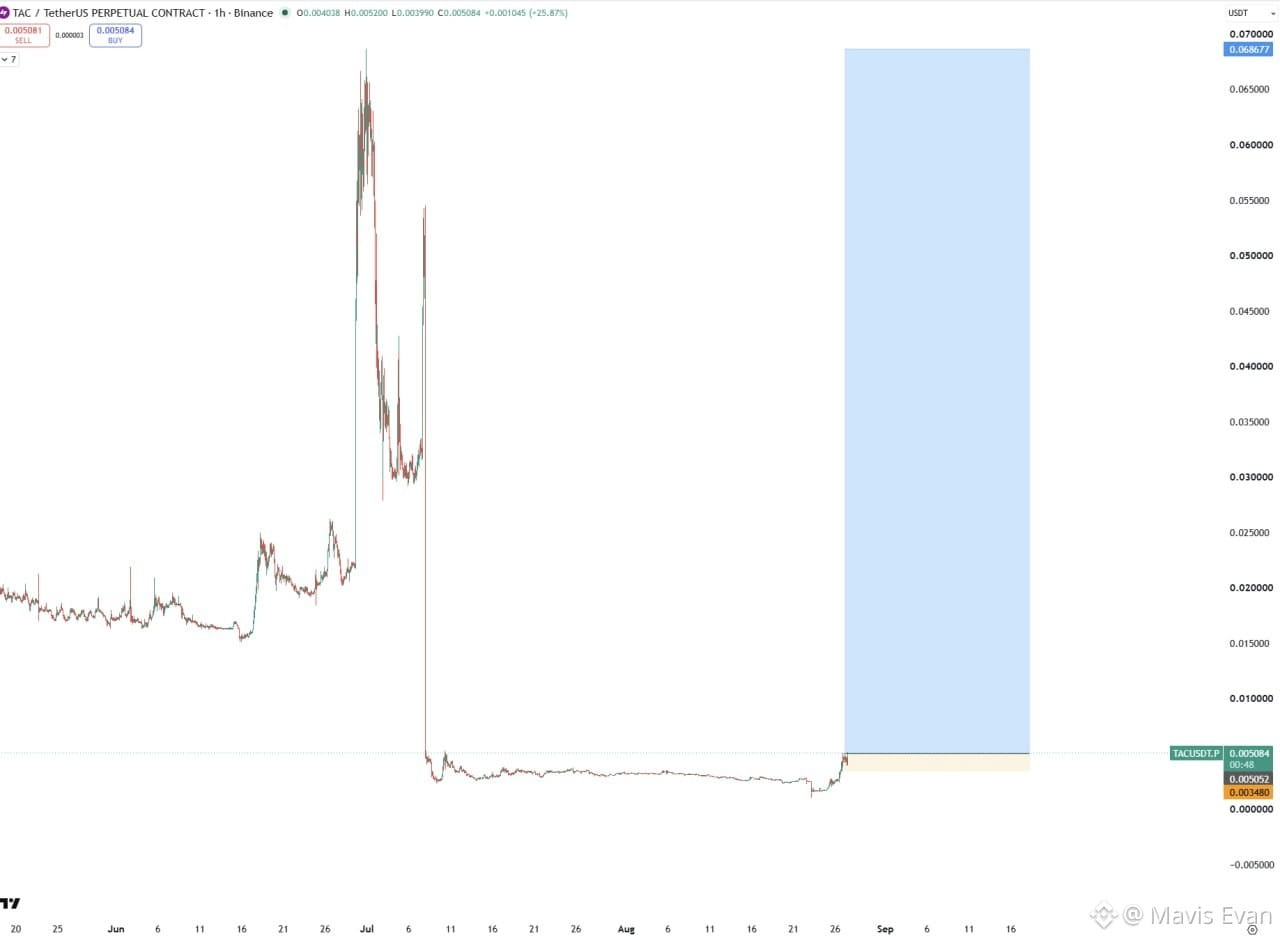

I’m watching $TAC closely because the chart is starting to show the kind of structure that can turn explosive when momentum returns.
Last time we had a couple of interesting movers with $BANK & $AKE . Now I’m watching $BTR & TAC for the next possible expansion. My analysis of this TAC chart shows a long consolidation after the major sell-off, followed by a strong reclaim from the lows.
The important part is the base. TAC has spent weeks moving sideways around the lower zone, and now price is pushing back above that area. If buyers keep defending the demand zone, this could become a much bigger move.
Current price: $0.005084
Entry Zone: $0.003480 – $0.005052
TP1: $0.035000
TP2: $0.068677
SL: $0.002000
Why I’m interested in $TAC:
• Long accumulation structure
• Strong move after a deep liquidity sweep
• Price is reclaiming the previous demand area
• Large upside gap remains on the chart
• A breakout above the recent range could bring aggressive momentum
I’m not saying price goes straight to the target. Crypto doesn’t move that cleanly. If you want to take this setup, the condition I’m watching is simple: TAC needs to hold the lower support and continue building higher.
If buyers actually step in with volume, the first major area I’m watching is $0.035000. Above that, the chart opens toward $0.068677.
This is why you need to watch the structure, not just the candle. The setup is interesting because the risk zone is clearly defined while the upside is much larger.
Last time it was BANK & $AKE .
Now I’m watching $BTR & $TAC .
Manage your risk. This is a high-volatility setup, not guaranteed profit.
Last time we had a couple of interesting movers with $BANK & $AKE . Now I’m watching $BTR & TAC for the next possible expansion. My analysis of this TAC chart shows a long consolidation after the major sell-off, followed by a strong reclaim from the lows.
The important part is the base. TAC has spent weeks moving sideways around the lower zone, and now price is pushing back above that area. If buyers keep defending the demand zone, this could become a much bigger move.
Current price: $0.005084
Entry Zone: $0.003480 – $0.005052
TP1: $0.035000
TP2: $0.068677
SL: $0.002000
Why I’m interested in $TAC:
• Long accumulation structure
• Strong move after a deep liquidity sweep
• Price is reclaiming the previous demand area
• Large upside gap remains on the chart
• A breakout above the recent range could bring aggressive momentum
I’m not saying price goes straight to the target. Crypto doesn’t move that cleanly. If you want to take this setup, the condition I’m watching is simple: TAC needs to hold the lower support and continue building higher.
If buyers actually step in with volume, the first major area I’m watching is $0.035000. Above that, the chart opens toward $0.068677.
This is why you need to watch the structure, not just the candle. The setup is interesting because the risk zone is clearly defined while the upside is much larger.
Last time it was BANK & $AKE .
Now I’m watching $BTR & $TAC .
Manage your risk. This is a high-volatility setup, not guaranteed profit.