
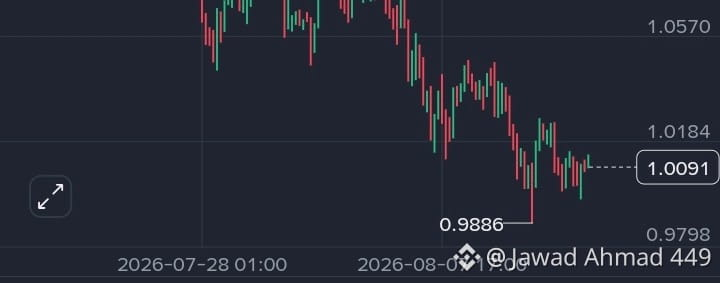
XRP/USDT — The Chart Is Not Showing Strength Yet
The 4H XRP/USDT structure is still bearish. The most important thing here is not the current price around $1.009, but the sequence of lower highs and lower lows.
From the chart:
Major high: $1.1641
Current area: ~$1.009
Major recent low: $0.9886
First important resistance: $1.0184
Stronger resistance: $1.0570
Order book shown: 43.93% Bid vs 56.07% Ask
1. The structure is the real story
XRP has been declining from $1.1641 and repeatedly failing to establish a meaningful higher high.
That means buyers have not yet demonstrated that they can change the 4H trend.
The recent bounce from $0.9886 → $1.009 is therefore better treated as a recovery inside a bearish structure, unless price starts breaking resistance.
2. $0.9886 is the key battlefield
This is currently the level I would watch most closely.
If XRP holds above $0.9886 and starts producing higher lows, buyers may attempt a recovery.
But if $0.9886 breaks decisively, the market could enter another liquidation/stop-loss phase because traders who bought the recent bounce may begin exiting.
A clean breakdown is much more important than a temporary wick below the level.
3. $1.0184 is the first test for bulls
XRP is sitting just below the visible $1.0184 resistance area.
For a bullish reversal, I would want to see:
Break → close above $1.0184 → retest → hold → continuation
Simply touching $1.0184 does not mean the trend has reversed.
If price gets rejected there, sellers can use that liquidity to push price back toward the $1.00 area and potentially retest $0.9886.
4. $1.057 is where the picture becomes much more interesting
The $1.0570 area is considerably more important than $1.0184 because reclaiming it would begin to challenge the series of lower highs visible on the 4H chart.
So I would divide the setup into three zones:
Below $0.9886: bearish continuation risk
$0.9886–$1.0184: battle/range zone
Above $1.0184: recovery attempt
Above $1.057: much stronger evidence of a structural reversal
5. Don't blindly trust the 56% Ask reading
The screenshot shows approximately:
Bid: 43.93%
Ask: 56.07%
That gives sellers a visible advantage in the displayed order book.
But this is not a guaranteed prediction of price direction.
Order-book liquidity can be cancelled, moved, spoofed, or consumed very quickly. The important question is not simply “Are there more asks?”
The better question is:
What happens when price actually reaches those orders?
If large asks repeatedly disappear while aggressive buyers continue lifting offers, that can indicate absorption.
If asks remain and price repeatedly fails underneath resistance, sellers are likely controlling that zone.
6. The deeper signal: volume + reaction
The next move should be judged by how XRP reacts, not simply where it trades.
A bullish scenario would look like:
$0.9886 holds → higher low → $1.0184 breaks → retest holds → $1.057 challenged
A bearish scenario:
$1.0184 rejection → lower high → $0.9886 breaks → selling accelerates
That distinction is much more useful than trying to predict the exact next candle.
My read
At the moment, I would not call this a confirmed bullish reversal.
The chart is still structurally bearish on the 4H. The first thing bulls need to accomplish is reclaiming $1.0184, and the stronger confirmation would come from reclaiming $1.057.
Until that happens, rallies can still be interpreted as relief bounces inside a larger downtrend.
Key levels to watch:
🔴 $0.9886 — critical support
🟡 $1.0184 — first resistance / confirmation test
🟠 $1.0570 — major structural resistance
🟢 Above $1.057 — bullish structure becomes significantly stronger
The biggest mistake here would be buying simply because XRP is near $1.00. A psychological number is not a reversal signal. Price structure, liquidity reaction, and confirmation matter more than the round number.