(Binance Square Feed)
**English Column for Binance:**
**Headline:** **Mastering the Silent Indicator: How to Interpret Price & Volume Like a Pro**
**Introduction:**
In the fast-paced world of cryptocurrency, where green and red candles flash with dizzying speed, most traders are exclusively obsessed with one thing: **Price.** But price, by itself, is only telling you *what* happened, not *why* it happened or how *strong* the movement is.
To truly understand market conviction, you must look at the foundation beneath the price movement: **Volume.**
Think of price as the automobile, and volume as the fuel. Without fuel, an automobile isn't going very far. Learning to read the interaction between volume and price is the closest thing a trader has to seeing the future commitment of buyers and sellers. Today, we break down four critical scenarios that every crypto trader on Binance needs to master.
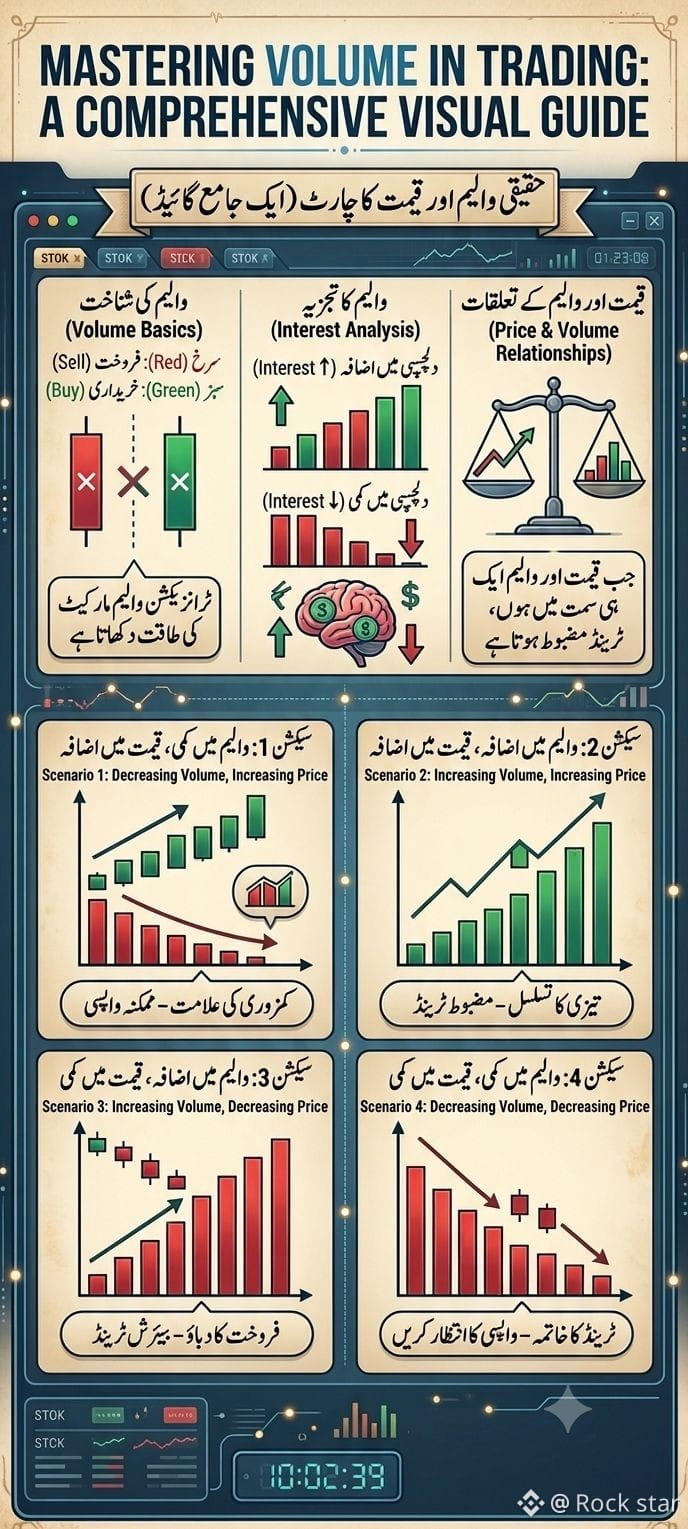
### **Understanding the Scenarios (Based on Visual Guide):**
The relationships described below analyze when price moves against volume (Divergence) and when they move together (Convergence).
#### **Scenario 1: The Weakening Rally (Cautionary Signal)**
**[Visual Ref: Scenario 1: Decreasing Volume, Increasing Price]**
* **What Happens:** You see the price of a token rising steadily, but as you glance down, the volume bars are shrinking. Fewer tokens are being traded at these higher levels.
* **Interpretation:** This is a major warning sign. The visual guide labels this **"Weakness Signal - Potential Reversal."** It means that while the price is high, the "fuel" (trader interest) is evaporating. The market lacks the conviction to keep buying at these expensive prices. Be careful; a sudden drop might be imminent.
#### **Scenario 2: The Bullish Confirmation (Strong Buy)**
**[Visual Ref: Scenario 2: Increasing Volume, Increasing Price]**
**English Column for Binance:**
**Headline:** **Mastering the Silent Indicator: How to Interpret Price & Volume Like a Pro**
**Introduction:**
In the fast-paced world of cryptocurrency, where green and red candles flash with dizzying speed, most traders are exclusively obsessed with one thing: **Price.** But price, by itself, is only telling you *what* happened, not *why* it happened or how *strong* the movement is.
To truly understand market conviction, you must look at the foundation beneath the price movement: **Volume.**
Think of price as the automobile, and volume as the fuel. Without fuel, an automobile isn't going very far. Learning to read the interaction between volume and price is the closest thing a trader has to seeing the future commitment of buyers and sellers. Today, we break down four critical scenarios that every crypto trader on Binance needs to master.
### **Understanding the Scenarios (Based on Visual Guide):**
The relationships described below analyze when price moves against volume (Divergence) and when they move together (Convergence).
#### **Scenario 1: The Weakening Rally (Cautionary Signal)**
**[Visual Ref: Scenario 1: Decreasing Volume, Increasing Price]**
* **What Happens:** You see the price of a token rising steadily, but as you glance down, the volume bars are shrinking. Fewer tokens are being traded at these higher levels.
* **Interpretation:** This is a major warning sign. The visual guide labels this **"Weakness Signal - Potential Reversal."** It means that while the price is high, the "fuel" (trader interest) is evaporating. The market lacks the conviction to keep buying at these expensive prices. Be careful; a sudden drop might be imminent.
#### **Scenario 2: The Bullish Confirmation (Strong Buy)**
**[Visual Ref: Scenario 2: Increasing Volume, Increasing Price]**