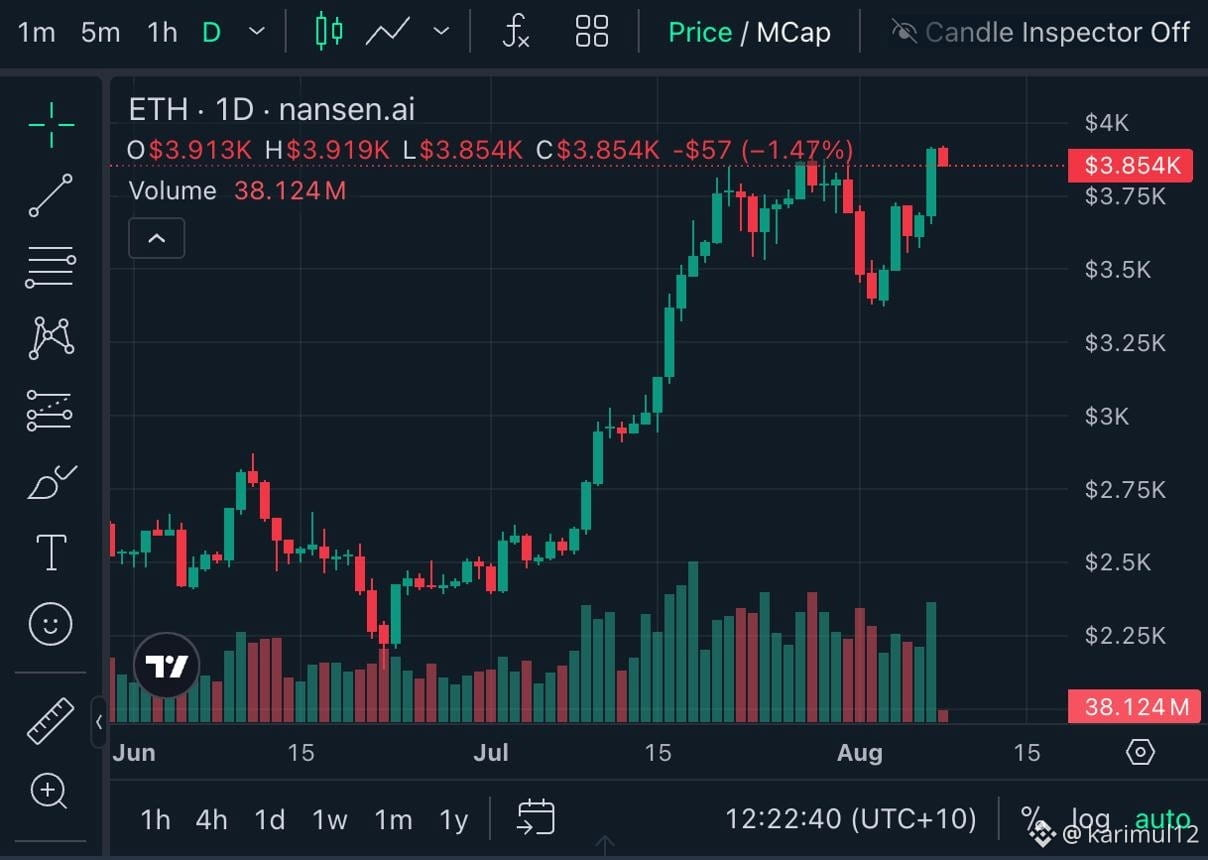
$ETH – Latest Technical Analysis
Market Sentiment: 🟡 Neutral with a Bearish Bias
🕯️ Candlestick Analysis
Recent daily candles show long lower wicks near the major support zone, indicating buyers are stepping in after sell-offs.
However, ETH is still struggling to print a strong bullish engulfing candle above resistance, suggesting that buyers have not fully regained control.
The current candle structure points to indecision, with a breakout or breakdown likely to determine the next major move.
📊 Key Levels
Support: Around $1,500–$1,520
Resistance: Around $1,600–$1,650
A daily close above resistance could confirm a short-term bullish reversal, while a break below support would increase the risk of further downside.
Short-Term Outlook (Next 1–2 Weeks)
🟢 Bullish: A strong green candle with high volume above resistance could target the next resistance zone.
🔴 Bearish: Consecutive bearish candles below support would signal continued selling pressure.
Overall View:
Ethereum is trading at a critical technical level. Watch the daily candlestick close and trading volume closely—these are likely to provide the clearest signal of the next directional move. This is market analysis, not financial advice.
#Ethereum #SolanaGains7%InSevenDays TrumpDiscloses$600MCryptoIncome#SamsungSKHynixSharesRiseYTD #DowHitsRecordClose
Market Sentiment: 🟡 Neutral with a Bearish Bias
🕯️ Candlestick Analysis
Recent daily candles show long lower wicks near the major support zone, indicating buyers are stepping in after sell-offs.
However, ETH is still struggling to print a strong bullish engulfing candle above resistance, suggesting that buyers have not fully regained control.
The current candle structure points to indecision, with a breakout or breakdown likely to determine the next major move.
📊 Key Levels
Support: Around $1,500–$1,520
Resistance: Around $1,600–$1,650
A daily close above resistance could confirm a short-term bullish reversal, while a break below support would increase the risk of further downside.
Short-Term Outlook (Next 1–2 Weeks)
🟢 Bullish: A strong green candle with high volume above resistance could target the next resistance zone.
🔴 Bearish: Consecutive bearish candles below support would signal continued selling pressure.
Overall View:
Ethereum is trading at a critical technical level. Watch the daily candlestick close and trading volume closely—these are likely to provide the clearest signal of the next directional move. This is market analysis, not financial advice.
#Ethereum #SolanaGains7%InSevenDays TrumpDiscloses$600MCryptoIncome#SamsungSKHynixSharesRiseYTD #DowHitsRecordClose