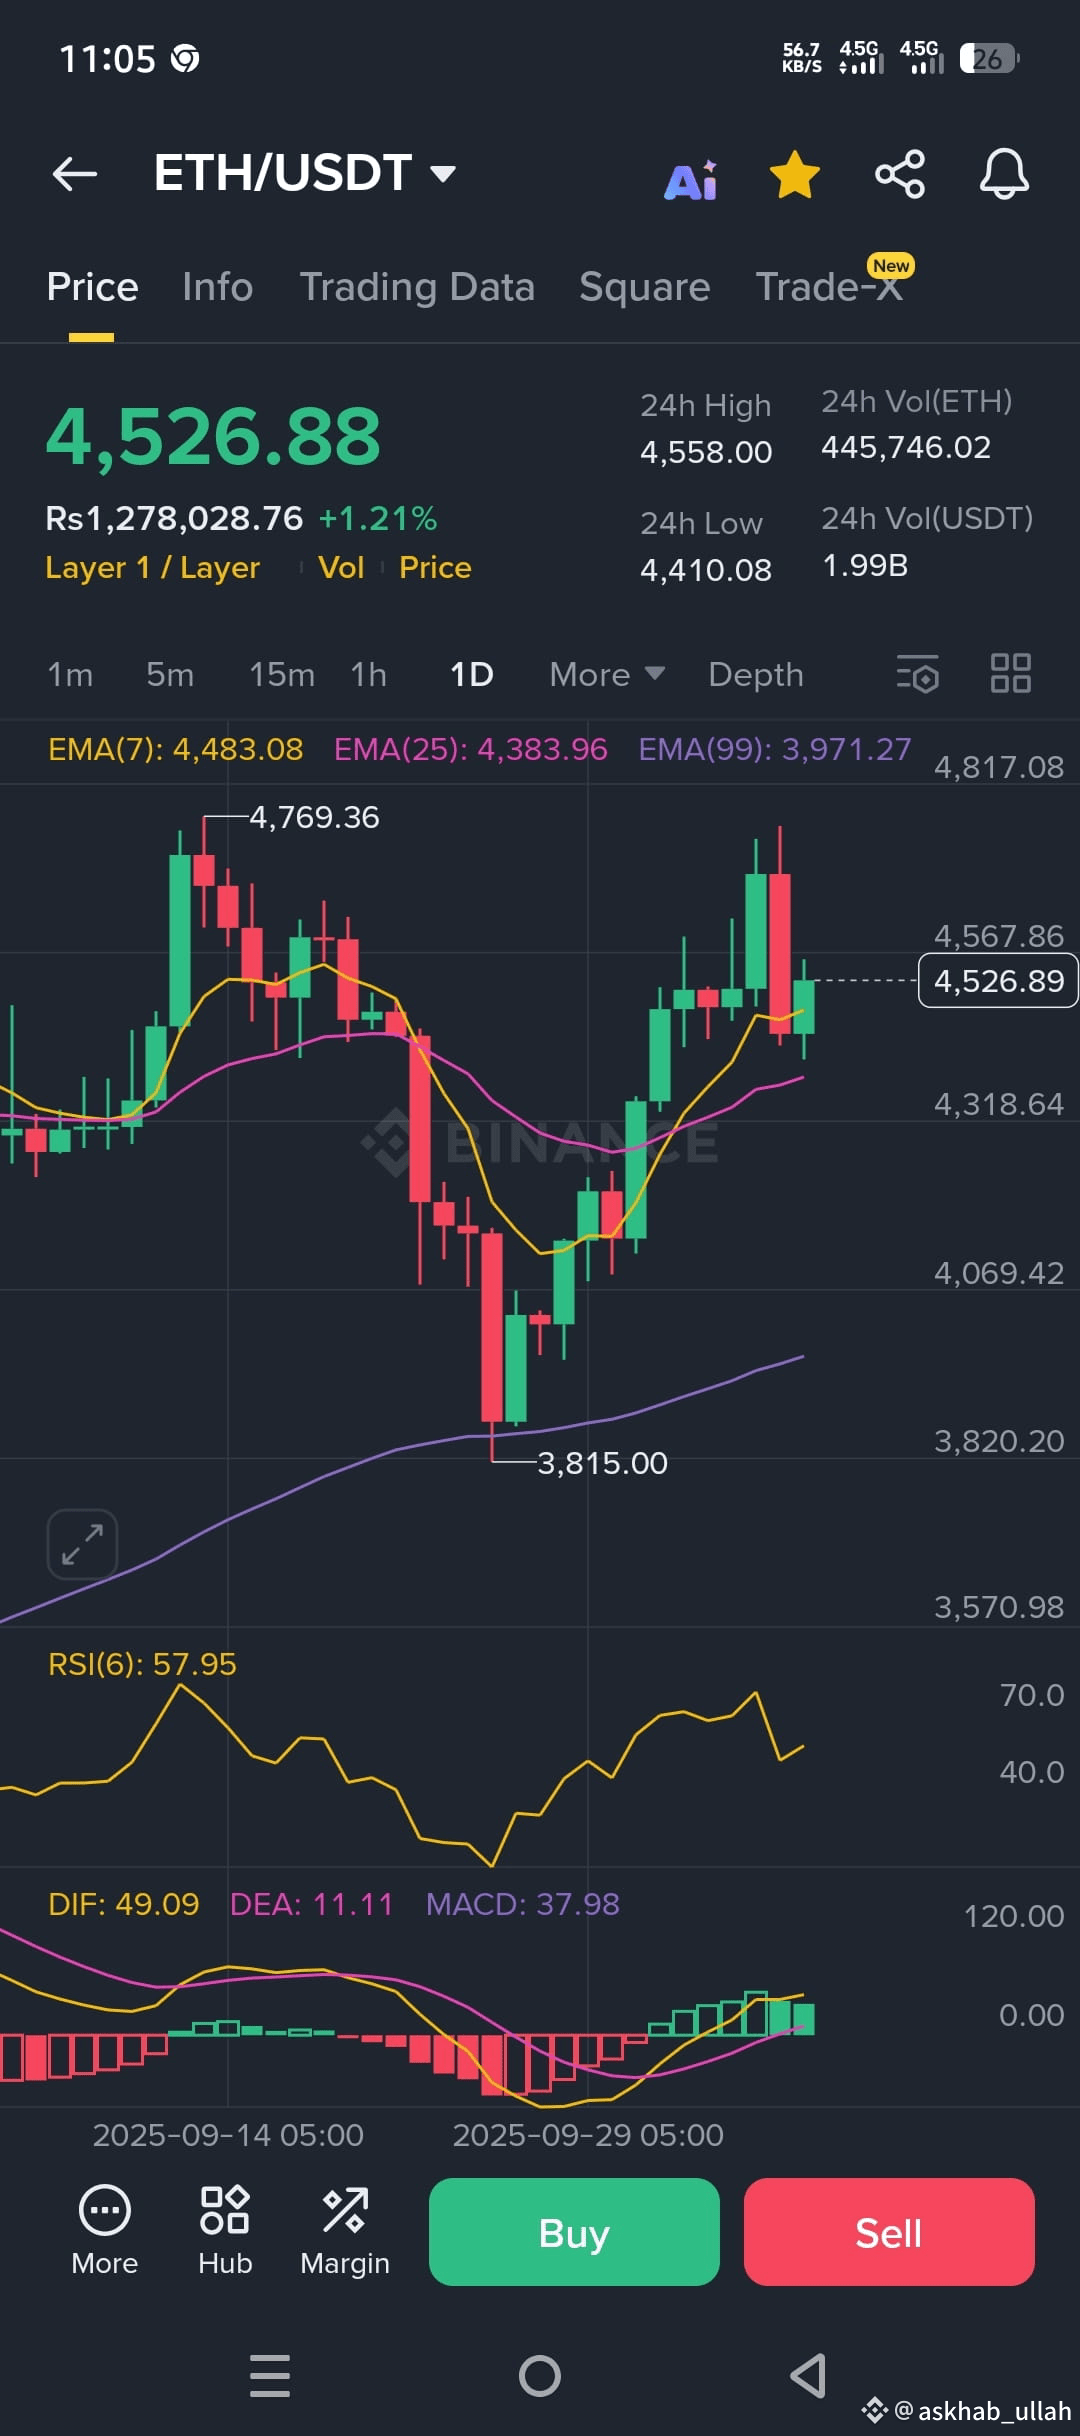
#ETH Let's analyze your ETH/USDT (1D timeframe) chart technically 👇
📊 1. Current Price Action
Current price: $4,526.88
24h High/Low: $4,558 / $4,410
Change: +1.21% (bullish momentum starting)
📈 2. Moving Averages (EMA)
EMA(7): 4,483.08
EMA(25): 4,383.96
EMA(99): 3,971.27
✅ Bullish signal: Price is above all EMAs, showing a short- to medium-term uptrend.
✅ EMA(7) > EMA(25) → short-term bullish crossover confirmed.
⚠️ However, price is near resistance (around $4,560–4,580), so a small pullback is possible.
📊 3. RSI (Relative Strength Index)
RSI(6): 57.95
🟢 RSI is neutral-to-bullish, meaning ETH still has room to go up before becoming overbought (70+).
No major bearish divergence seen right
$ETH
$BTC
$BNB
📊 1. Current Price Action
Current price: $4,526.88
24h High/Low: $4,558 / $4,410
Change: +1.21% (bullish momentum starting)
📈 2. Moving Averages (EMA)
EMA(7): 4,483.08
EMA(25): 4,383.96
EMA(99): 3,971.27
✅ Bullish signal: Price is above all EMAs, showing a short- to medium-term uptrend.
✅ EMA(7) > EMA(25) → short-term bullish crossover confirmed.
⚠️ However, price is near resistance (around $4,560–4,580), so a small pullback is possible.
📊 3. RSI (Relative Strength Index)
RSI(6): 57.95
🟢 RSI is neutral-to-bullish, meaning ETH still has room to go up before becoming overbought (70+).
No major bearish divergence seen right
$ETH
$BTC
$BNB