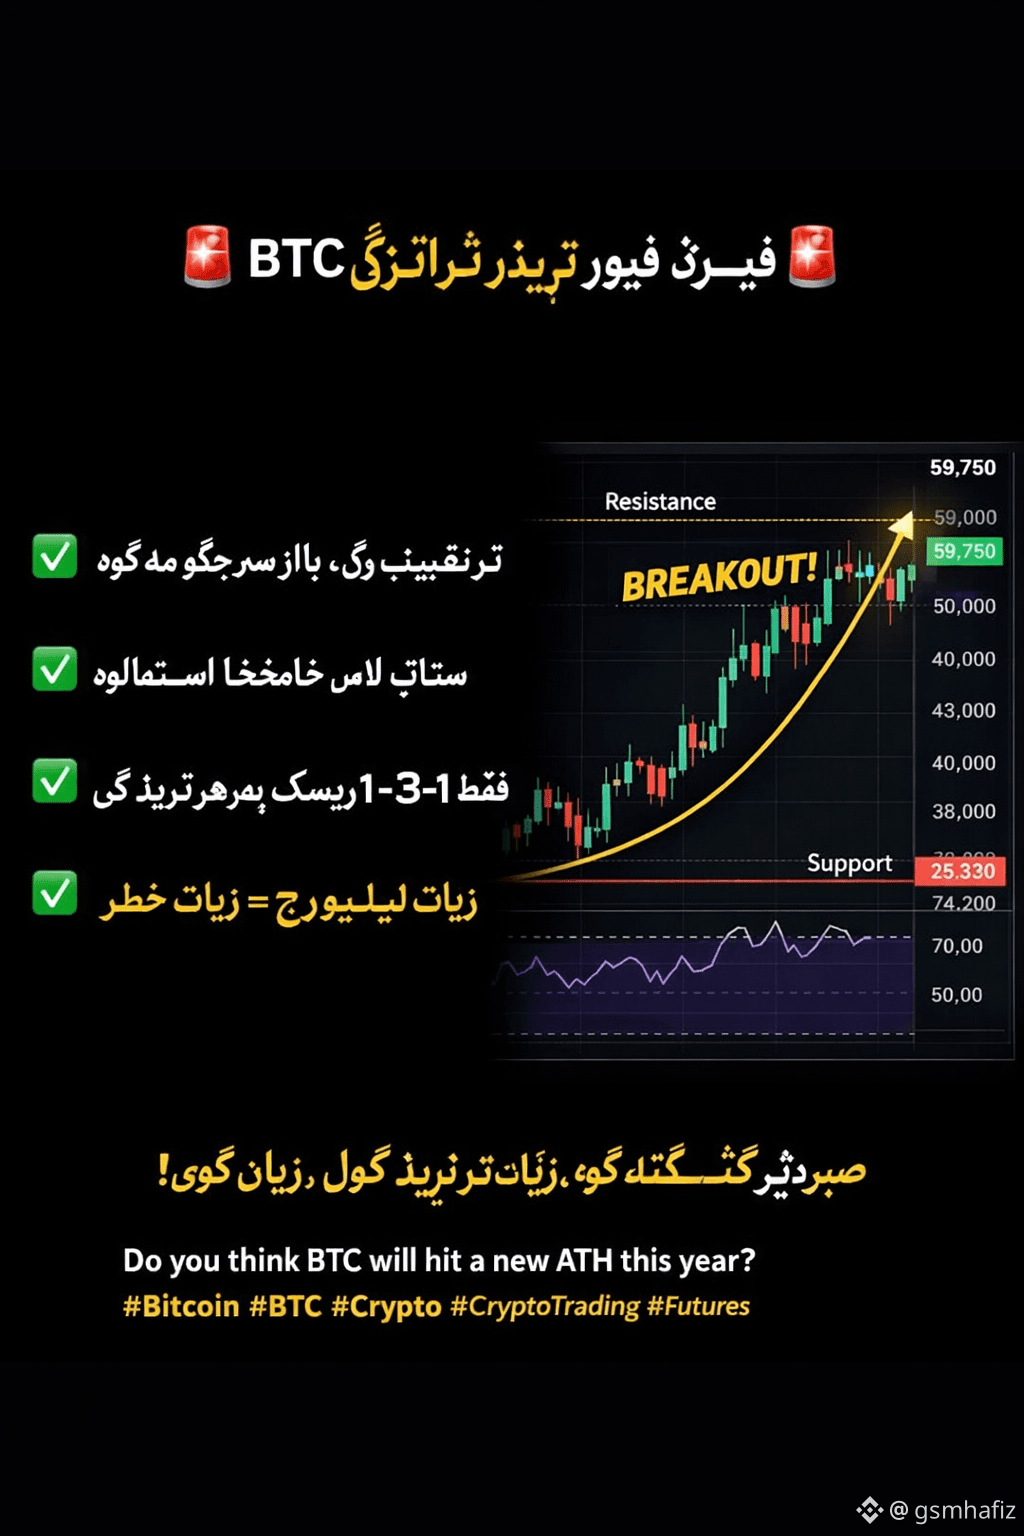
This image is about Bitcoin (BTC) Futures trading strategy and shows a bullish breakout scenario in the market.
📊 Chart Overview
The chart shows BTC price moving in an upward trend with higher highs and higher lows.
A resistance level is marked near the top of the chart.
The word “BREAKOUT” indicates that the price is attempting to break above this resistance.
When resistance breaks, traders usually expect strong bullish momentum.
📈 Key Technical Signals
Uptrend Structure
The curved yellow line represents a strong upward trend, showing that buyers are in control of the market.
Resistance Breakout
If BTC breaks above the resistance zone, it can trigger more buying pressure and push the price higher.
Support Level
The support line below shows the area where buyers previously defended the price.
RSI Indicator
The indicator at the bottom suggests the market still has room to move up, meaning the trend may continue.
⚠️ Risk Management Points (From the Image)
Follow the trend direction.
Always use a stop loss.
Risk only 1–3% per trade.
High leverage increases risk.
📊 Trading Interpretation
If the breakout above resistance is confirmed with strong volume, BTC Futures traders may consider a long position. However, if the breakout fails, the price could pull back to the support area.
📌 Conclusion
This chart represents a classic bullish breakout setup often used in Bitcoin Futures trading, where traders wait for confirmation above resistance before entering a long trade.#Trump'sCyberStrategy #RFKJr.RunningforUSPresidentin2028 #AltcoinSeasonTalkTwoYearLow #MarketPullback #RFKJr.RunningforUSPresidentin2028
📊 Chart Overview
The chart shows BTC price moving in an upward trend with higher highs and higher lows.
A resistance level is marked near the top of the chart.
The word “BREAKOUT” indicates that the price is attempting to break above this resistance.
When resistance breaks, traders usually expect strong bullish momentum.
📈 Key Technical Signals
Uptrend Structure
The curved yellow line represents a strong upward trend, showing that buyers are in control of the market.
Resistance Breakout
If BTC breaks above the resistance zone, it can trigger more buying pressure and push the price higher.
Support Level
The support line below shows the area where buyers previously defended the price.
RSI Indicator
The indicator at the bottom suggests the market still has room to move up, meaning the trend may continue.
⚠️ Risk Management Points (From the Image)
Follow the trend direction.
Always use a stop loss.
Risk only 1–3% per trade.
High leverage increases risk.
📊 Trading Interpretation
If the breakout above resistance is confirmed with strong volume, BTC Futures traders may consider a long position. However, if the breakout fails, the price could pull back to the support area.
📌 Conclusion
This chart represents a classic bullish breakout setup often used in Bitcoin Futures trading, where traders wait for confirmation above resistance before entering a long trade.#Trump'sCyberStrategy #RFKJr.RunningforUSPresidentin2028 #AltcoinSeasonTalkTwoYearLow #MarketPullback #RFKJr.RunningforUSPresidentin2028