AI Chart Analysis !
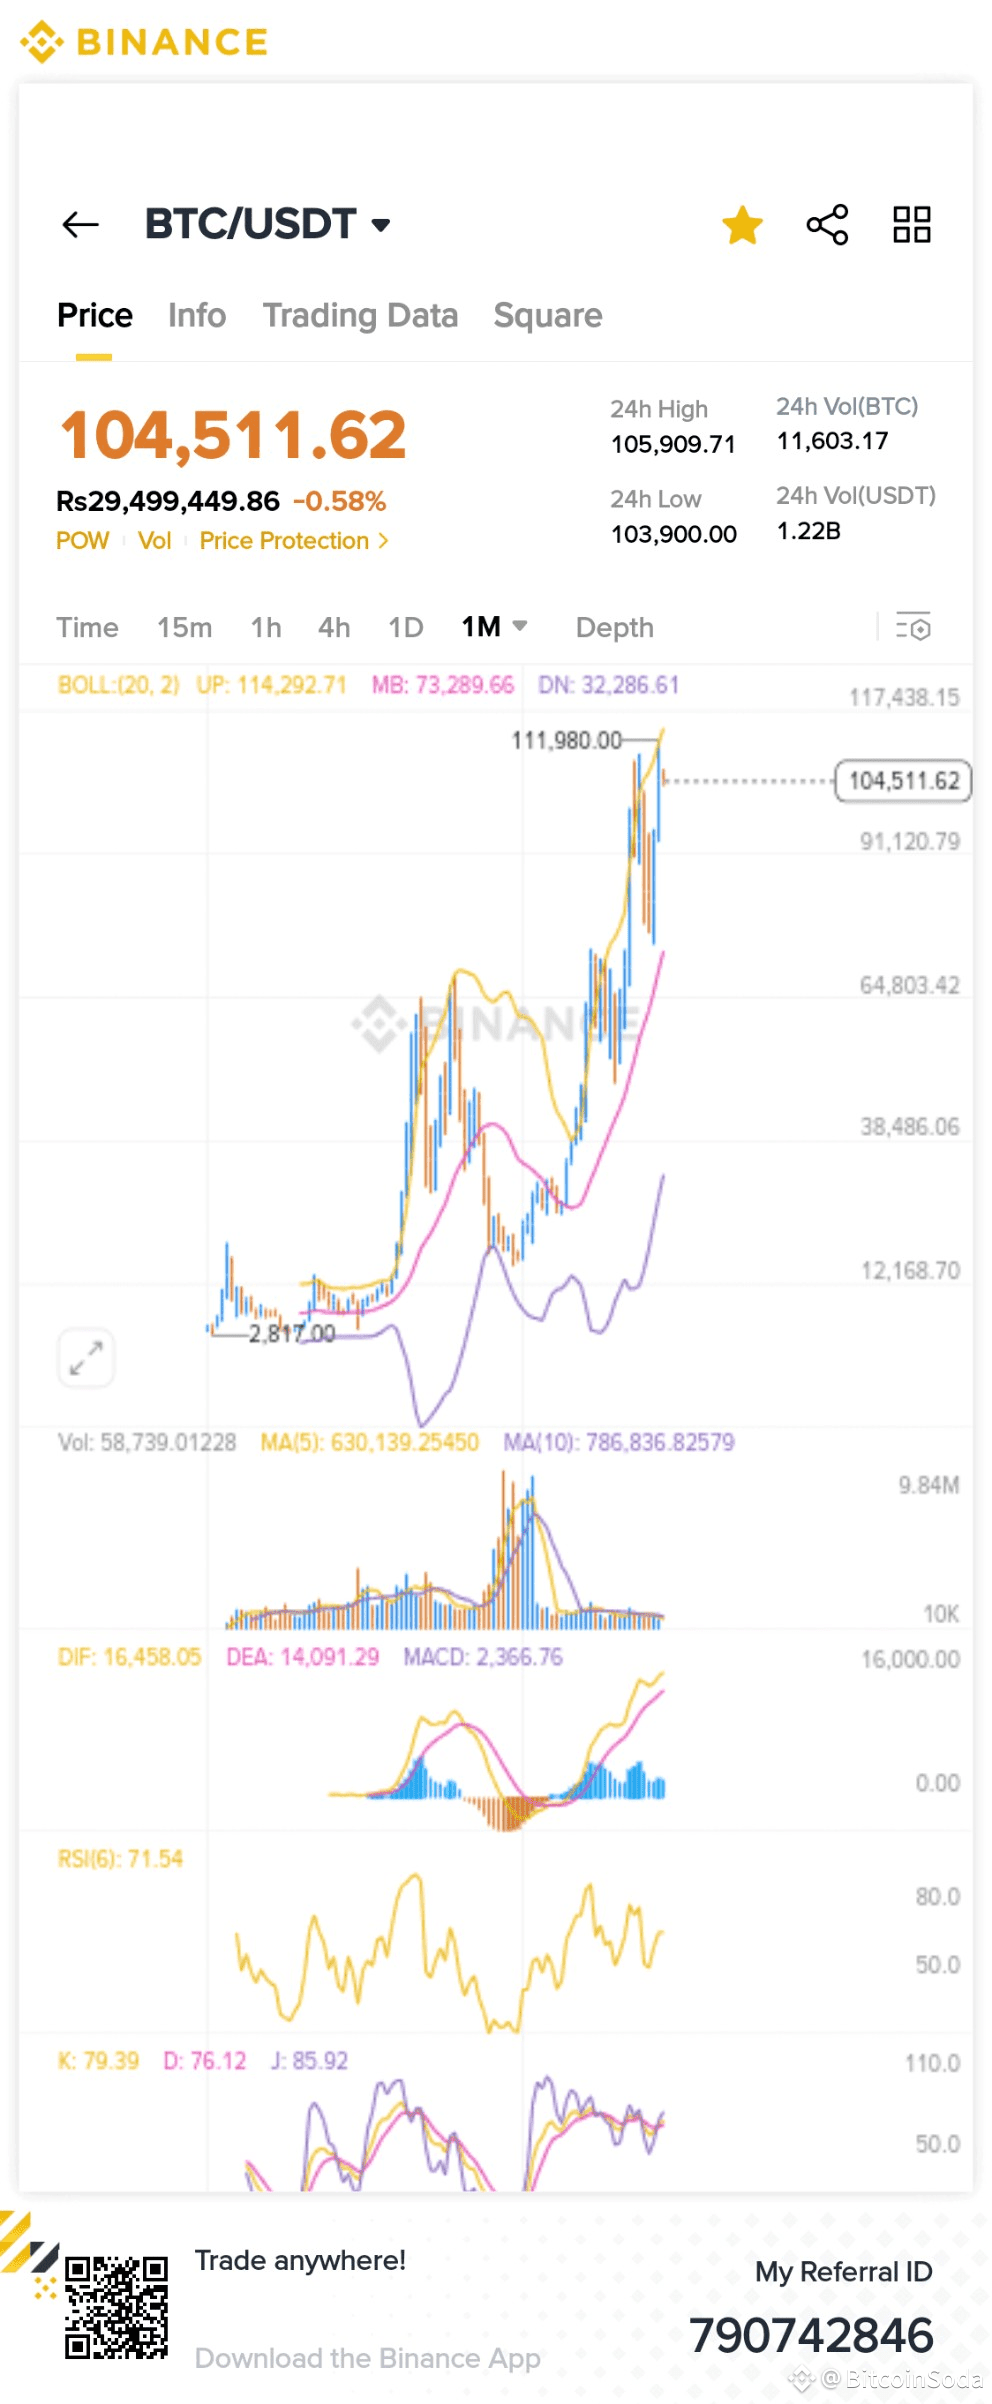
Bitcoin Chart Analysis (Based on Provided Image)
Disclaimer: This analysis is based solely on the provided static image of a Bitcoin chart from Binance, captured at a specific moment in time (displaying a price of $104,511.62). Market conditions are constantly changing, and this should not be considered financial advice.
Key Observations from the Chart:
* Price: Bitcoin (BTC) is currently trading at $104,511.62 against USDT.
* 24h High: $105,909.71
* 24h Low: $103,900.00
* 24h Change: -0.58%
* Bollinger Bands (BOLL):
* Upper Band (UP): 114,292.71
* Middle Band (MB): 73,286.66
* Lower Band (DN): 32,286.61
* Interpretation: The price is significantly above the Middle Band and approaching the Upper Band, suggesting it's potentially overextended to the upside. While not explicitly visible if it's outside the bands, the strong move upwards indicates high volatility and a potential for mean reversion.
* Volume:
* Vol: 58,739.01228
* MA(5): 630,139.53450
* MA(10): 786,936.82579
* Interpretation: The current volume (58k) is significantly lower than both its 5-period (630k) and 10-period (786k) moving averages. This divergence, where price is high but volume is comparatively low on the immediate candlestick, can sometimes signal a weakening of the upward momentum and a potential for a reversal. The high past volume, however, supported the previous strong rally.
* MACD (Moving Average Convergence Divergence):
* DIF: 16,458.05
* DEA: 14,091.29
* MACD Histogram: 2,366.76
* Interpretation: The MACD line (DIF) is above the Signal line (DEA), and the histogram is positive. This indicates bullish momentum. However, without seeing the historical MACD trend (e.g., if it's flattening or showing divergence from price), it's hard to definitively say if it's signaling a coming dive based only on these numbers. If the histogram is decreasing or the lines are converging after a long run up, it could indicate weakening momentum.
* RSI (Relative Strength Index):
* RSI(6): 71.54
* Interpretation: An RSI of 71.54 is above the 70 threshold, indicating that Bitcoin is currently in overbought territory. This is a strong technical signal that a pullback or correction is likely to occur in the near future.
* Stochastic KDJ:
* K: 79.39
* D: 76.12
* J: 85.92
* Interpretation: All three lines (K, D, J) are well above 80 (and J is above 100), indicating extremely overbought conditions. The J line being particularly high often signals that the asset is very far from its recent price range and ripe for a correction.
Overall Summary of Analysis:
The chart shows Bitcoin at a very high price point following a strong rally. While MACD still indicates bullish momentum, the RSI and Stochastic KDJ are flashing strong overbought signals. The current volume being lower than its short-term moving averages also suggests weakening immediate buying pressure. These technical indicators collectively point towards a high probability of a near-term price correction or "dive."