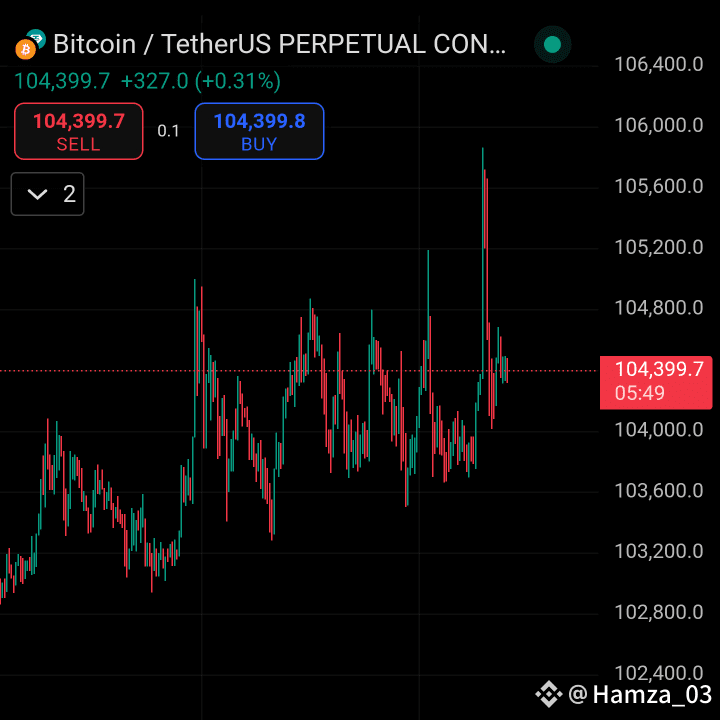
BTC Technical Setup: Bounce Incoming or Trap?
Support/Demand Zone
103,600 – 104,000: This area has seen multiple touches with wicks rejecting downward movement. Price bounced from this zone several times, indicating it is acting as a short-term demand/support zone.
Resistance / Key Reversal Zone
105,600+: Strong rejection candle near this level followed by a drop suggests a short-term resistance zone or a liquidity grab (possible stop-hunt above previous highs).
Price Structure
The chart shows a choppy consolidation between ~103,600 and 105,600, with several fakeouts. No clear trend yet, but:
Higher lows slightly forming (if 104k holds).
Volume spike likely occurred on the upper wick (possible exhaustion).
Possible Scenarios
1. Bullish Bias (if 104k holds)
Retest and bounce above 104,400–104,500 could trigger a move back toward 105,200 and possibly 105,600 again.
Break and close above 105,600 confirms a reversal to the upside.
2. Bearish Bias (if 104k breaks)
Clean breakdown below 104k with volume could lead to a test of 103,200 or lower toward 102,800 and eventually 102k.
$BTC
#Write2Earn
Conclusion:
This looks like a support/demand zone test. If you see bullish confirmation candles near 104,000 (e.g. engulfing or hammer), it could signal a short-term reversal. Otherwise, a breakdown might confirm distribution and continuation lower.
Support/Demand Zone
103,600 – 104,000: This area has seen multiple touches with wicks rejecting downward movement. Price bounced from this zone several times, indicating it is acting as a short-term demand/support zone.
Resistance / Key Reversal Zone
105,600+: Strong rejection candle near this level followed by a drop suggests a short-term resistance zone or a liquidity grab (possible stop-hunt above previous highs).
Price Structure
The chart shows a choppy consolidation between ~103,600 and 105,600, with several fakeouts. No clear trend yet, but:
Higher lows slightly forming (if 104k holds).
Volume spike likely occurred on the upper wick (possible exhaustion).
Possible Scenarios
1. Bullish Bias (if 104k holds)
Retest and bounce above 104,400–104,500 could trigger a move back toward 105,200 and possibly 105,600 again.
Break and close above 105,600 confirms a reversal to the upside.
2. Bearish Bias (if 104k breaks)
Clean breakdown below 104k with volume could lead to a test of 103,200 or lower toward 102,800 and eventually 102k.
$BTC
#Write2Earn
Conclusion:
This looks like a support/demand zone test. If you see bullish confirmation candles near 104,000 (e.g. engulfing or hammer), it could signal a short-term reversal. Otherwise, a breakdown might confirm distribution and continuation lower.