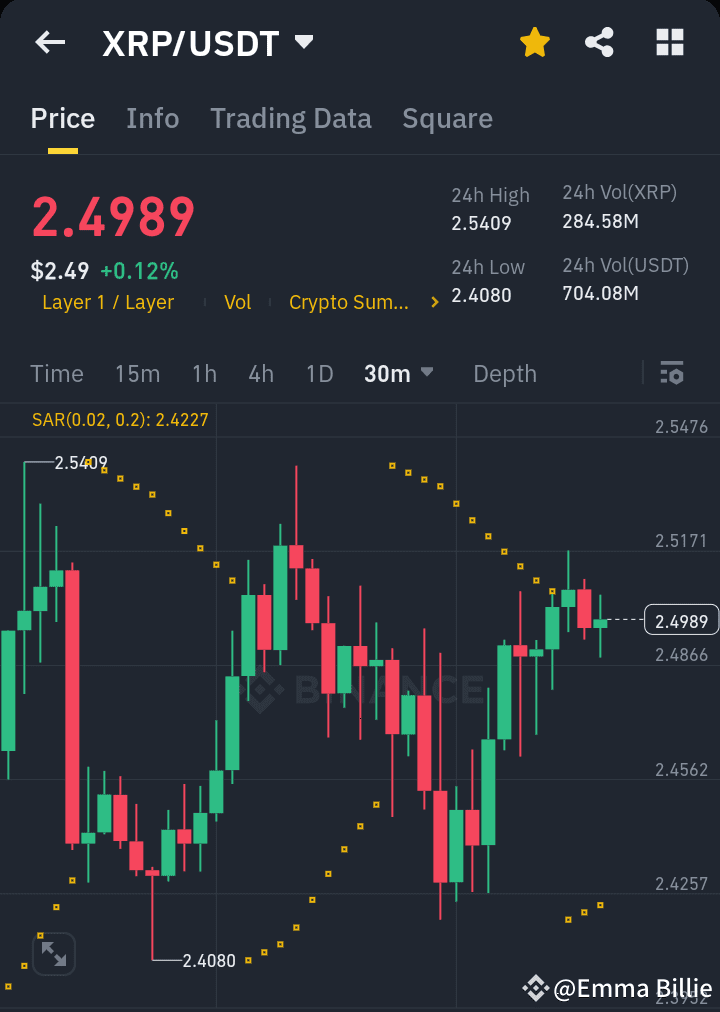
Market Movement Analysis for XRP/USDT
$XRP
1. Current Price: $2.4989 (+0.12%)
2. 24h High: $2.5409
3. 24h Low: $2.4080
4. Technical Indicators:
Parabolic SAR is below the price, indicating a potential uptrend.
Support Level: $2.4080 (recent low)
Resistance Level: $2.5409 (recent high)
Higher Lows Formation suggests bullish momentum.
Next Movement Prediction
If the price stays above $2.4866, it could move towards $2.5171 and then retest $2.5409.
A break above $2.5409 could push XRP towards $2.57 - $2.60.
If it falls below $2.4866, it may test $2.4562 and possibly drop to $2.4257.
Trading Signal
📈 Long Trade (Buy)
Entry: $2.4900 - $2.5000
Take Profit 1: $2.5171
Take Profit 2: $2.5409
Stop Loss: $2.4560
📉 Short Trade (Sell)
Entry: Below $2.4560
Take Profit 1: $2.4257
Take Profit 2: $2.4080
Stop Loss: $2.5000
Profit Expectation
Long Trade: Potential 2% to 4% profit.
Short Trade: Potential 2% to 4% profit.
Final Recommendation
Bullish bias in the short term; buying on dips is favorable.
Watch $2.5000 as a key support level.
Manage risk with stop-loss and profit-taking levels.
#USJobsSlump #BBWDocuSeries #TrumpCongressSpeech #MarketRebound #GPSonBinance
$XRP
1. Current Price: $2.4989 (+0.12%)
2. 24h High: $2.5409
3. 24h Low: $2.4080
4. Technical Indicators:
Parabolic SAR is below the price, indicating a potential uptrend.
Support Level: $2.4080 (recent low)
Resistance Level: $2.5409 (recent high)
Higher Lows Formation suggests bullish momentum.
Next Movement Prediction
If the price stays above $2.4866, it could move towards $2.5171 and then retest $2.5409.
A break above $2.5409 could push XRP towards $2.57 - $2.60.
If it falls below $2.4866, it may test $2.4562 and possibly drop to $2.4257.
Trading Signal
📈 Long Trade (Buy)
Entry: $2.4900 - $2.5000
Take Profit 1: $2.5171
Take Profit 2: $2.5409
Stop Loss: $2.4560
📉 Short Trade (Sell)
Entry: Below $2.4560
Take Profit 1: $2.4257
Take Profit 2: $2.4080
Stop Loss: $2.5000
Profit Expectation
Long Trade: Potential 2% to 4% profit.
Short Trade: Potential 2% to 4% profit.
Final Recommendation
Bullish bias in the short term; buying on dips is favorable.
Watch $2.5000 as a key support level.
Manage risk with stop-loss and profit-taking levels.
#USJobsSlump #BBWDocuSeries #TrumpCongressSpeech #MarketRebound #GPSonBinance