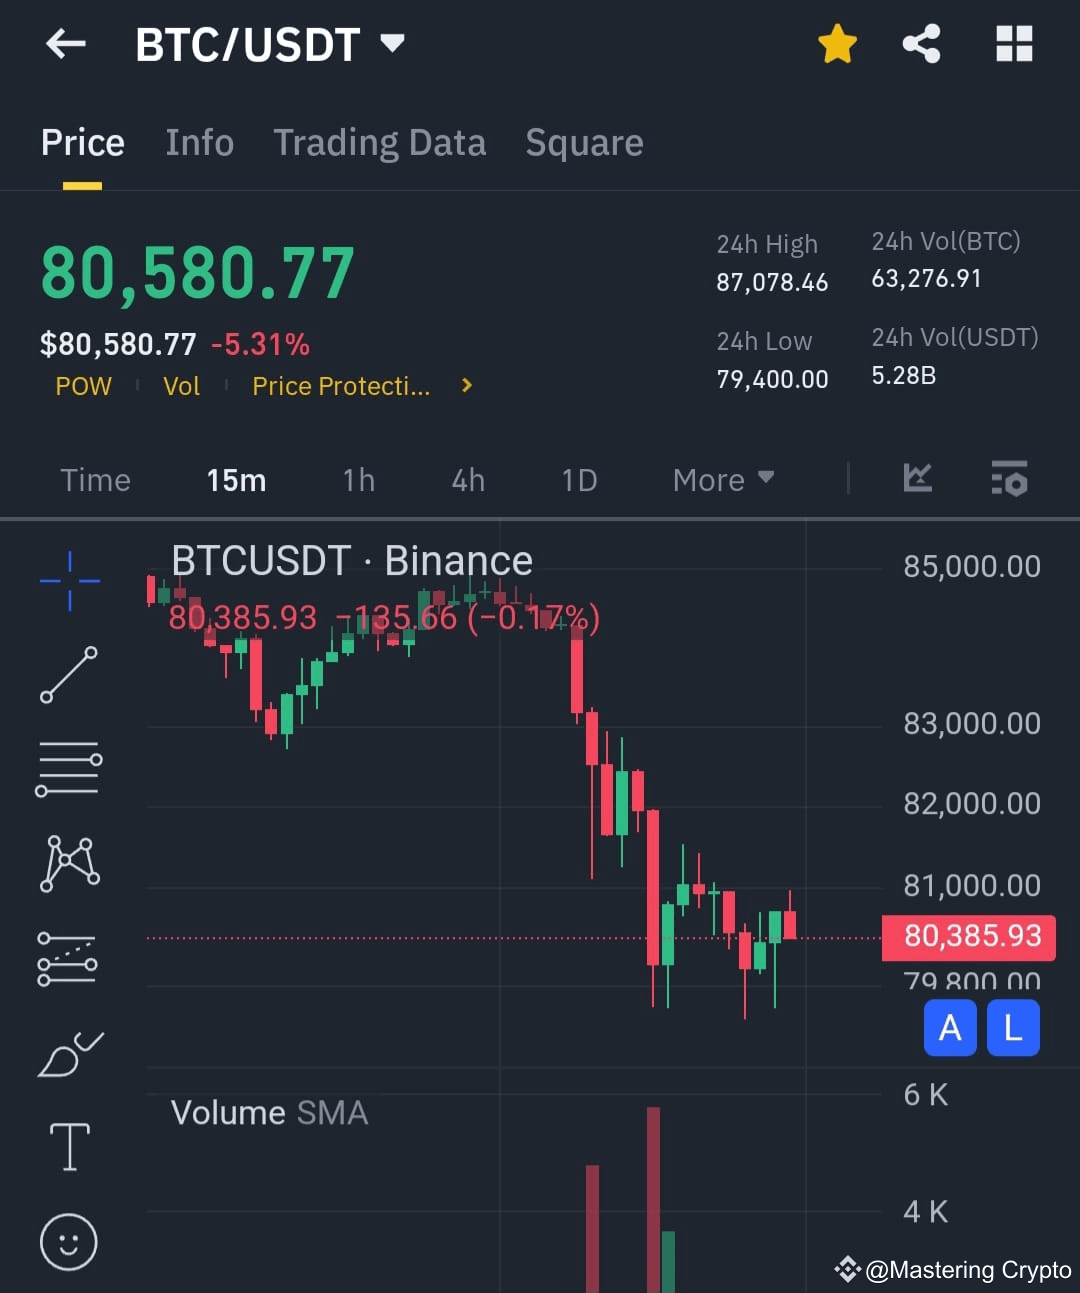

$BTC is currently facing resistance after a steep drop but is attempting a recovery. A break above $82,500 would be bullish, while failing to hold $79,400 could lead to further downside. Traders should watch RSI and MACD for confirmation of trend reversal. BTC recently fell below its 25-day and 99-day moving averages, indicating a bearish trend. The price has bounced off the $79,400 support level but is still struggling to break above key resistances.
The MACD remains in the negative zone, indicating continued bearish momentum. However, a crossover may suggest a potential trend reversal if the price stabilizes.
Support & Resistance Levels
Immediate Support: $79,400 (recent low)
Major Support: $77,000 (psychological level)
Immediate Resistance: $82,500 (25-day MA)
Major Resistance: $85,500 (previous high)
$BTC
#SHELLAirdropOnBinance #BTCDipOrRebound
The MACD remains in the negative zone, indicating continued bearish momentum. However, a crossover may suggest a potential trend reversal if the price stabilizes.
Support & Resistance Levels
Immediate Support: $79,400 (recent low)
Major Support: $77,000 (psychological level)
Immediate Resistance: $82,500 (25-day MA)
Major Resistance: $85,500 (previous high)
$BTC
#SHELLAirdropOnBinance #BTCDipOrRebound