
Syed Omer Hussain
266 Posts

Syed Omer Hussain
Report
Block User
Open Trade
High-Frequency Trader
2.4 Years
123 Following
820 Followers
1.7K+ Liked
Posts
Portfolio
All
Quotes
Videos
lolll after crashing trillions of dollars they stay cool this is really called a thug life 🤣🤣🤣
lolll after crashing trillions of dollars they stay cool this is really called a thug life 🤣🤣🤣
3
586
$NVDA wow after crashing market bears are dancing 🤣🤣🤣🤣
$NVDA wow after crashing market bears are dancing 🤣🤣🤣🤣
113
·
--
Bearish
why the hell market when start to fall then keep fall what is money protection in it, just a crap always watch bearish momentum $BTC
why the hell market when start to fall then keep fall what is money protection in it, just a crap always watch bearish momentum $BTC
122
$SNDK you have one enough damage now for heaven sake just go upward
$SNDK you have one enough damage now for heaven sake just go upward
2
746
#BTC Options Positioning Ahead of the Oct 30 Expiry: Put/Call, Max Pain, Gamma Zones 📐
1) Put/Call (open interest basis, Deribit)
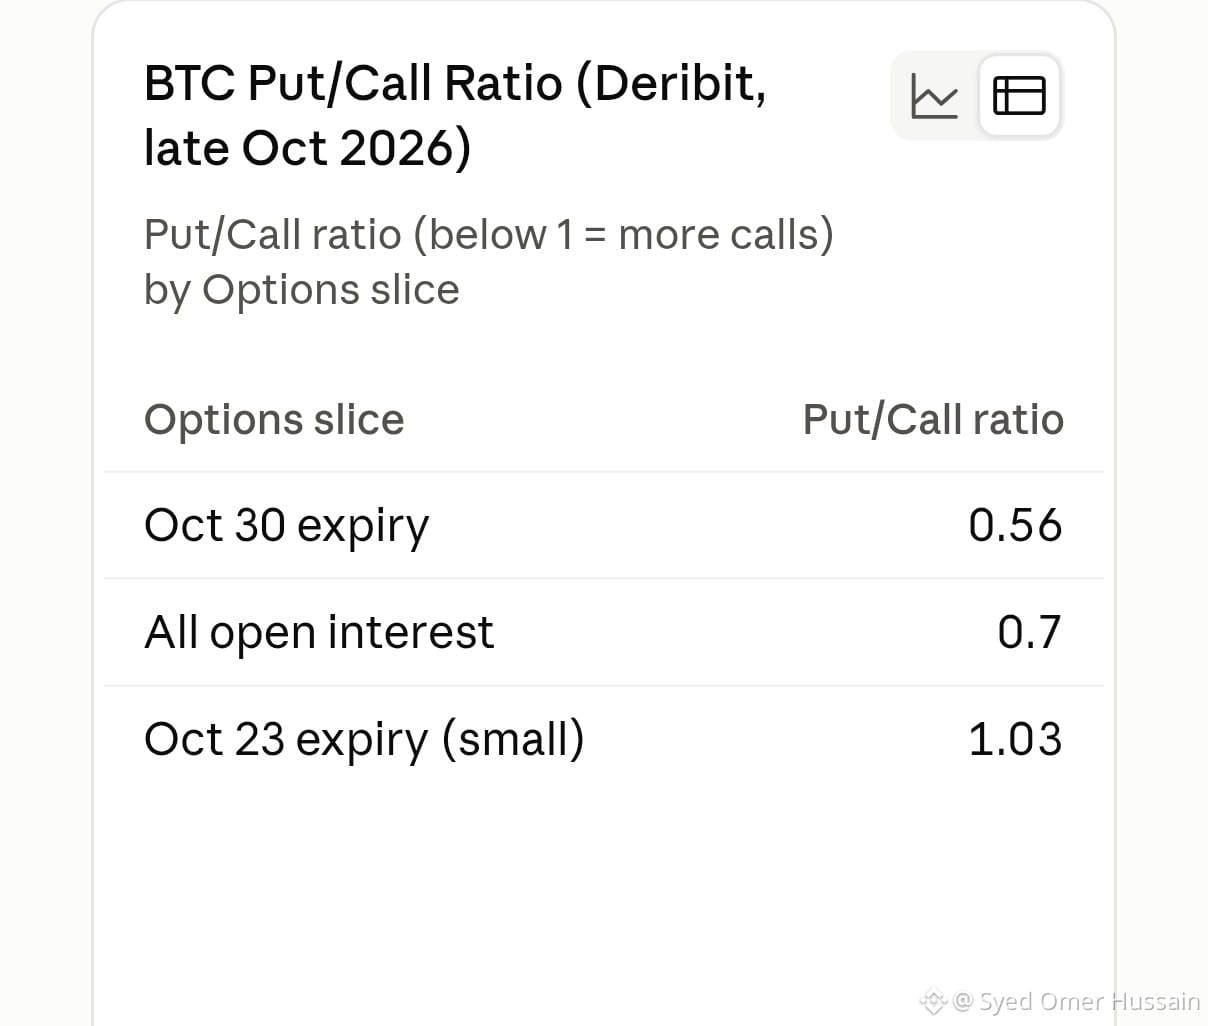
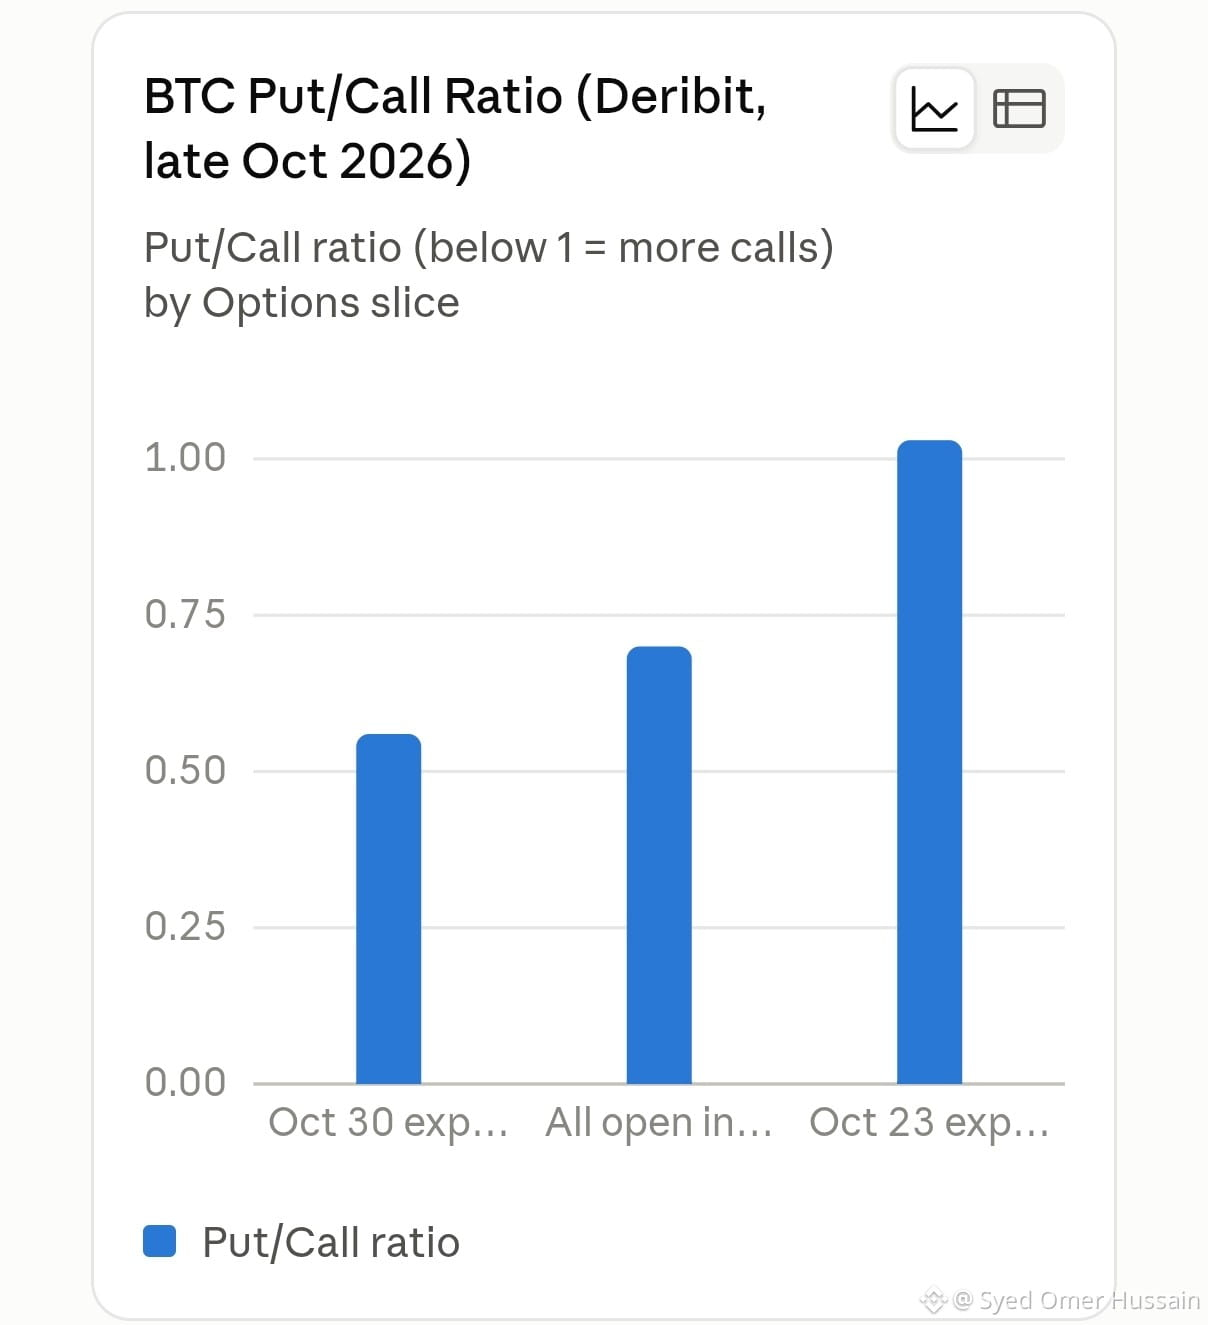
Aggregate OI P/C: ~0.70
Oct 30 expiry: 51,134 puts vs 98,552 calls, a ratio of 0.52, with another analysis at 0.56 on an Oct 22 snapshot
Size: 149,686 contracts, about $12.2B notional, so this single date dominates the book (~34.6% of Deribit BTC options OI) Less than 5% of Bitcoin put options sit above $84,000 as bullish bets dominate +4
2) Max pain vs spot
Max pain: ~$78K–$79K
Deribit index: ~$80.85K
Spot sits above max pain, but max pain is a positioning artifact, not support. Neither the $78K level nor Binance bid blocks confirm spot support. 35% of Deribit's Bitcoin options open interest is set to expire October 30 +2
3) Strike concentration
Largest bets sit at $95K and $100K. Those are far OTM and carry little near-term delta, but they skew the headline P/C toward calls.
Fewer than 5% of puts carried strikes above $84K in the Oct 21 data. Put OI in the $76K–$80K zone faded as BTC consolidated higher. Bitcoin price prediction: $12.2bn of options expire +2
4) Market-implied range
Implied range to Oct 30: ~$76.5K–$86.3K (roughly ±6% from spot) cryptoticker
How to read it: A low P/C on OI says call-heavy positioning, but it doesn’t say who is long or short. It mixes directional longs, covered-call overwriting, and spreads. Confirm with volume-based P/C, skew, and funding before calling it “bullish.”
Event risk: FOMC on Oct 28, expiry on Oct 30 at 08:00 UTC. Expect vol and dealer hedging flows into both. cryptoticker
Which matters more into expiry: the $79K max pain magnet or the $95K call wall? 👇
Not financial advice. DYOR.
#Bitcoin #BTC #Options #Deribit #MaxPain #Derivatives
#BTC Options Positioning Ahead of the Oct 30 Expiry: Put/Call, Max Pain, Gamma Zones 📐
1) Put/Call (open interest basis, Deribit)
Aggregate OI P/C: ~0.70
Oct 30 expiry: 51,134 puts vs 98,552 calls, a ratio of 0.52, with another analysis at 0.56 on an Oct 22 snapshot
Size: 149,686 contracts, about $12.2B notional, so this single date dominates the book (~34.6% of Deribit BTC options OI) Less than 5% of Bitcoin put options sit above $84,000 as bullish bets dominate +4
2) Max pain vs spot
Max pain: ~$78K–$79K
Deribit index: ~$80.85K
Spot sits above max pain, but max pain is a positioning artifact, not support. Neither the $78K level nor Binance bid blocks confirm spot support. 35% of Deribit's Bitcoin options open interest is set to expire October 30 +2
3) Strike concentration
Largest bets sit at $95K and $100K. Those are far OTM and carry little near-term delta, but they skew the headline P/C toward calls.
Fewer than 5% of puts carried strikes above $84K in the Oct 21 data. Put OI in the $76K–$80K zone faded as BTC consolidated higher. Bitcoin price prediction: $12.2bn of options expire +2
4) Market-implied range
Implied range to Oct 30: ~$76.5K–$86.3K (roughly ±6% from spot) cryptoticker
How to read it: A low P/C on OI says call-heavy positioning, but it doesn’t say who is long or short. It mixes directional longs, covered-call overwriting, and spreads. Confirm with volume-based P/C, skew, and funding before calling it “bullish.”
Event risk: FOMC on Oct 28, expiry on Oct 30 at 08:00 UTC. Expect vol and dealer hedging flows into both. cryptoticker
Which matters more into expiry: the $79K max pain magnet or the $95K call wall? 👇
Not financial advice. DYOR.
#Bitcoin #BTC #Options #Deribit #MaxPain #Derivatives
1) Put/Call (open interest basis, Deribit)
Aggregate OI P/C: ~0.70
Oct 30 expiry: 51,134 puts vs 98,552 calls, a ratio of 0.52, with another analysis at 0.56 on an Oct 22 snapshot
Size: 149,686 contracts, about $12.2B notional, so this single date dominates the book (~34.6% of Deribit BTC options OI) Less than 5% of Bitcoin put options sit above $84,000 as bullish bets dominate +4
2) Max pain vs spot
Max pain: ~$78K–$79K
Deribit index: ~$80.85K
Spot sits above max pain, but max pain is a positioning artifact, not support. Neither the $78K level nor Binance bid blocks confirm spot support. 35% of Deribit's Bitcoin options open interest is set to expire October 30 +2
3) Strike concentration
Largest bets sit at $95K and $100K. Those are far OTM and carry little near-term delta, but they skew the headline P/C toward calls.
Fewer than 5% of puts carried strikes above $84K in the Oct 21 data. Put OI in the $76K–$80K zone faded as BTC consolidated higher. Bitcoin price prediction: $12.2bn of options expire +2
4) Market-implied range
Implied range to Oct 30: ~$76.5K–$86.3K (roughly ±6% from spot) cryptoticker
How to read it: A low P/C on OI says call-heavy positioning, but it doesn’t say who is long or short. It mixes directional longs, covered-call overwriting, and spreads. Confirm with volume-based P/C, skew, and funding before calling it “bullish.”
Event risk: FOMC on Oct 28, expiry on Oct 30 at 08:00 UTC. Expect vol and dealer hedging flows into both. cryptoticker
Which matters more into expiry: the $79K max pain magnet or the $95K call wall? 👇
Not financial advice. DYOR.
#Bitcoin #BTC #Options #Deribit #MaxPain #Derivatives
110

BTC is trading near $82,753 as of this morning, up about 0.81% on the day. Here’s a post you can paste into Binance Square, with the scenario graphic above as the image.
CoinDesk
$BTC: What’s the Next Move? 👀
Bitcoin is holding around $82.7K, with sentiment lifted by risk-on moves across global markets. China’s GDP beat estimates, and Bitcoin rose alongside Korea’s Kospi and Nasdaq futures. A whale also moved $34M of BTC that had sat untouched since 2013, so long-term holders are getting attention again.
Bullish case 🟢
If BTC holds above $82K, buyers stay in control. The next levels to watch are $84K, then $85K. A strong daily close above $84K with rising volume would confirm momentum.
Bearish case 🔴
If BTC loses $81K, expect a pullback toward $80K. A rejection near $84K followed by weak volume would be an early warning sign.
My view: Price is consolidating, and the next breakout needs volume to confirm. I’m watching the $82K support and the $84K resistance. Patience beats guessing the direction.
💬 Are you bullish or bearish from here? Drop your target below 👇
Not financial advice. Always DYOR and manage your risk.
#BTC #Bitcoin #CryptoAnalysis #BinanceSquare #Crypto
BTC is trading near $82,753 as of this morning, up about 0.81% on the day. Here’s a post you can paste into Binance Square, with the scenario graphic above as the image.
CoinDesk
$BTC: What’s the Next Move? 👀
Bitcoin is holding around $82.7K, with sentiment lifted by risk-on moves across global markets. China’s GDP beat estimates, and Bitcoin rose alongside Korea’s Kospi and Nasdaq futures. A whale also moved $34M of BTC that had sat untouched since 2013, so long-term holders are getting attention again.
Bullish case 🟢
If BTC holds above $82K, buyers stay in control. The next levels to watch are $84K, then $85K. A strong daily close above $84K with rising volume would confirm momentum.
Bearish case 🔴
If BTC loses $81K, expect a pullback toward $80K. A rejection near $84K followed by weak volume would be an early warning sign.
My view: Price is consolidating, and the next breakout needs volume to confirm. I’m watching the $82K support and the $84K resistance. Patience beats guessing the direction.
💬 Are you bullish or bearish from here? Drop your target below 👇
Not financial advice. Always DYOR and manage your risk.
#BTC #Bitcoin #CryptoAnalysis #BinanceSquare #Crypto
CoinDesk
$BTC: What’s the Next Move? 👀
Bitcoin is holding around $82.7K, with sentiment lifted by risk-on moves across global markets. China’s GDP beat estimates, and Bitcoin rose alongside Korea’s Kospi and Nasdaq futures. A whale also moved $34M of BTC that had sat untouched since 2013, so long-term holders are getting attention again.
Bullish case 🟢
If BTC holds above $82K, buyers stay in control. The next levels to watch are $84K, then $85K. A strong daily close above $84K with rising volume would confirm momentum.
Bearish case 🔴
If BTC loses $81K, expect a pullback toward $80K. A rejection near $84K followed by weak volume would be an early warning sign.
My view: Price is consolidating, and the next breakout needs volume to confirm. I’m watching the $82K support and the $84K resistance. Patience beats guessing the direction.
💬 Are you bullish or bearish from here? Drop your target below 👇
Not financial advice. Always DYOR and manage your risk.
#BTC #Bitcoin #CryptoAnalysis #BinanceSquare #Crypto
101
·
--
Bearish
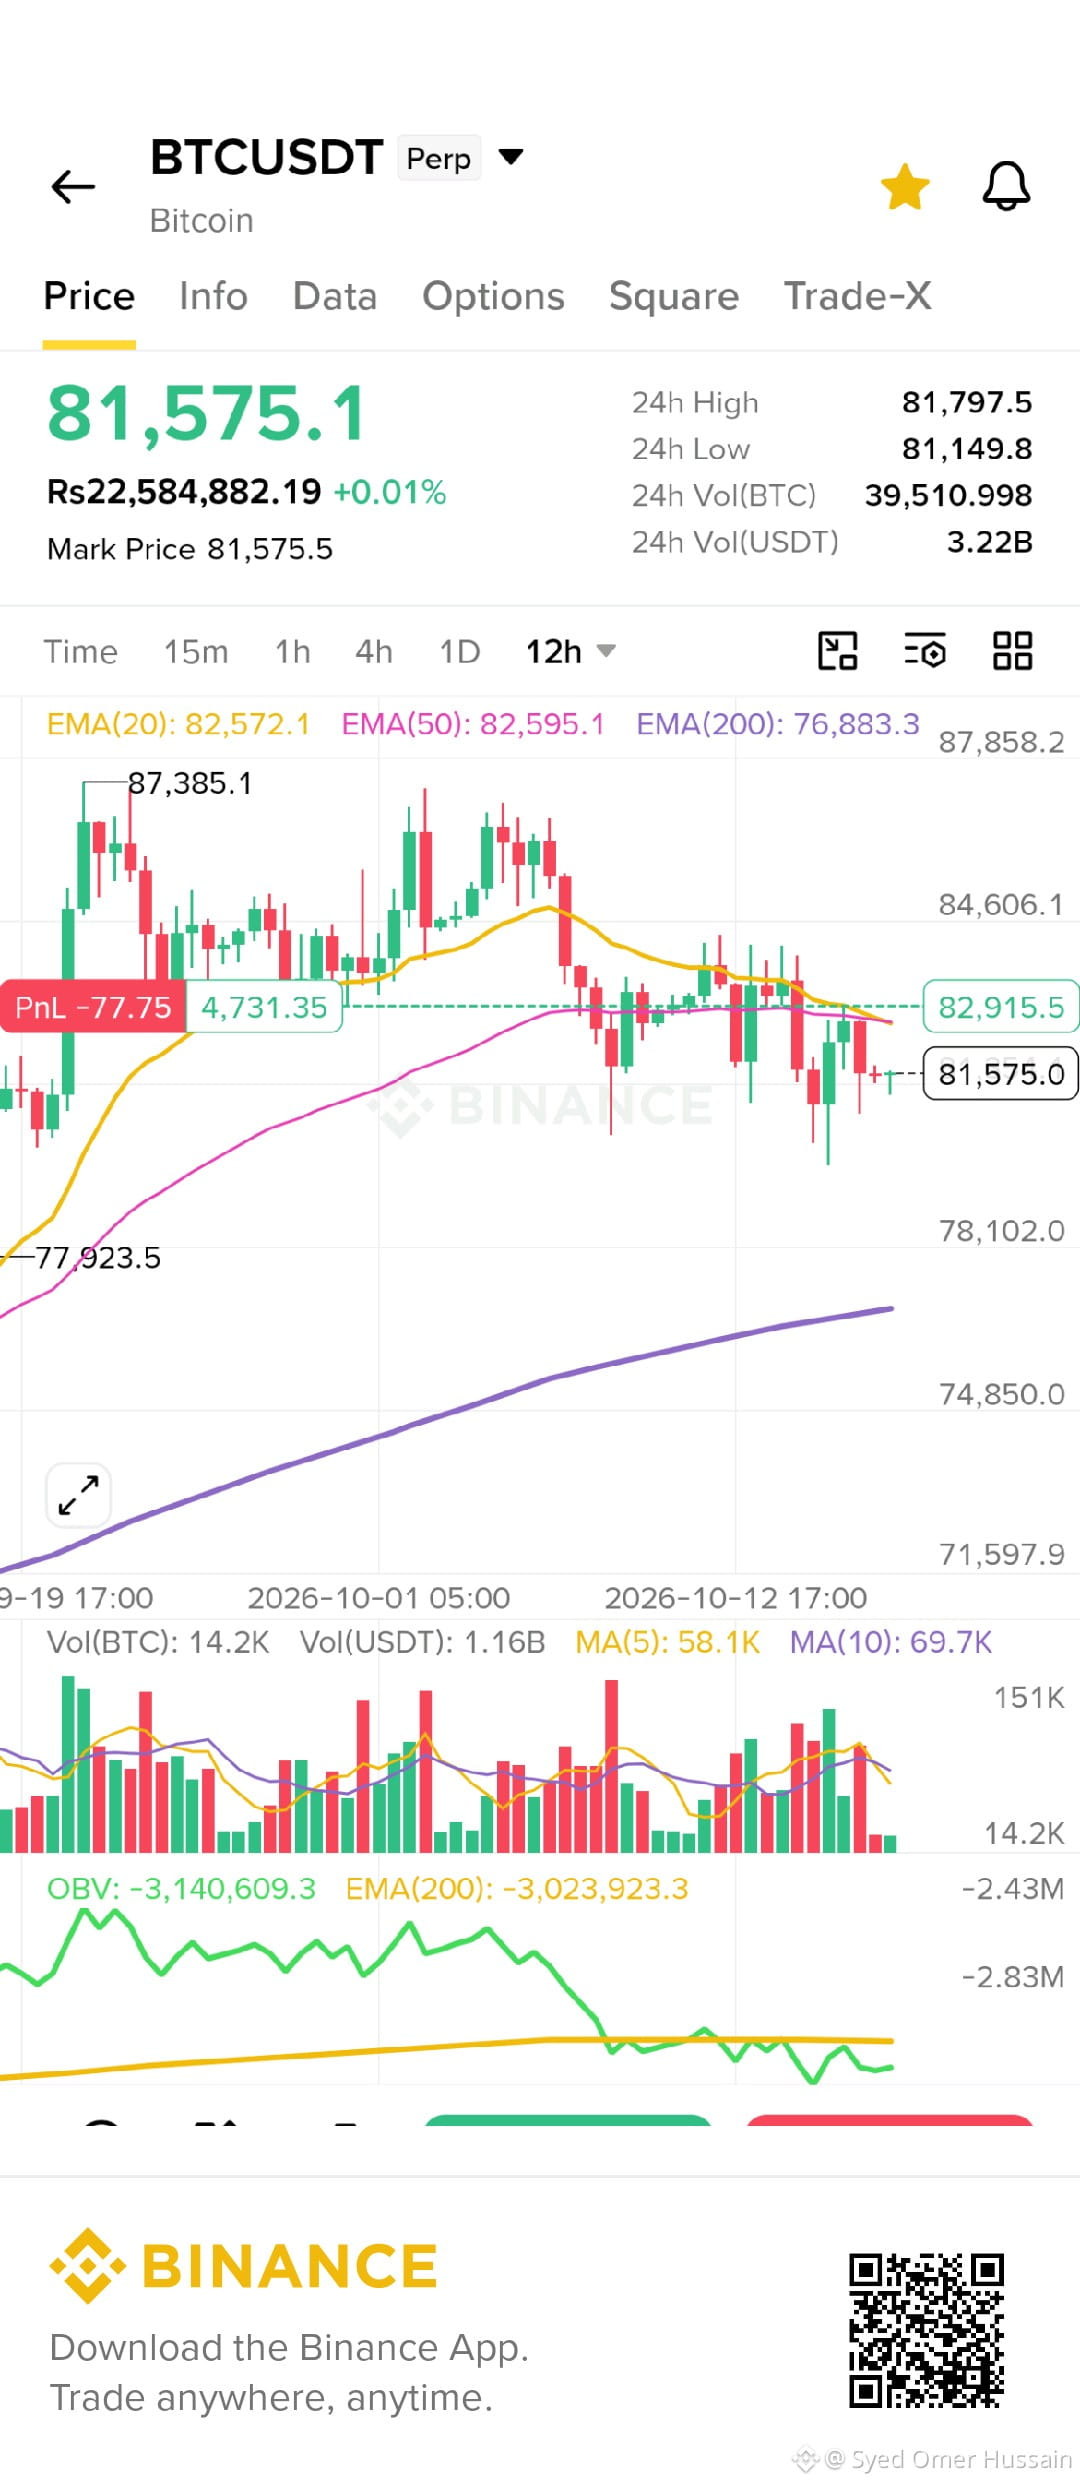
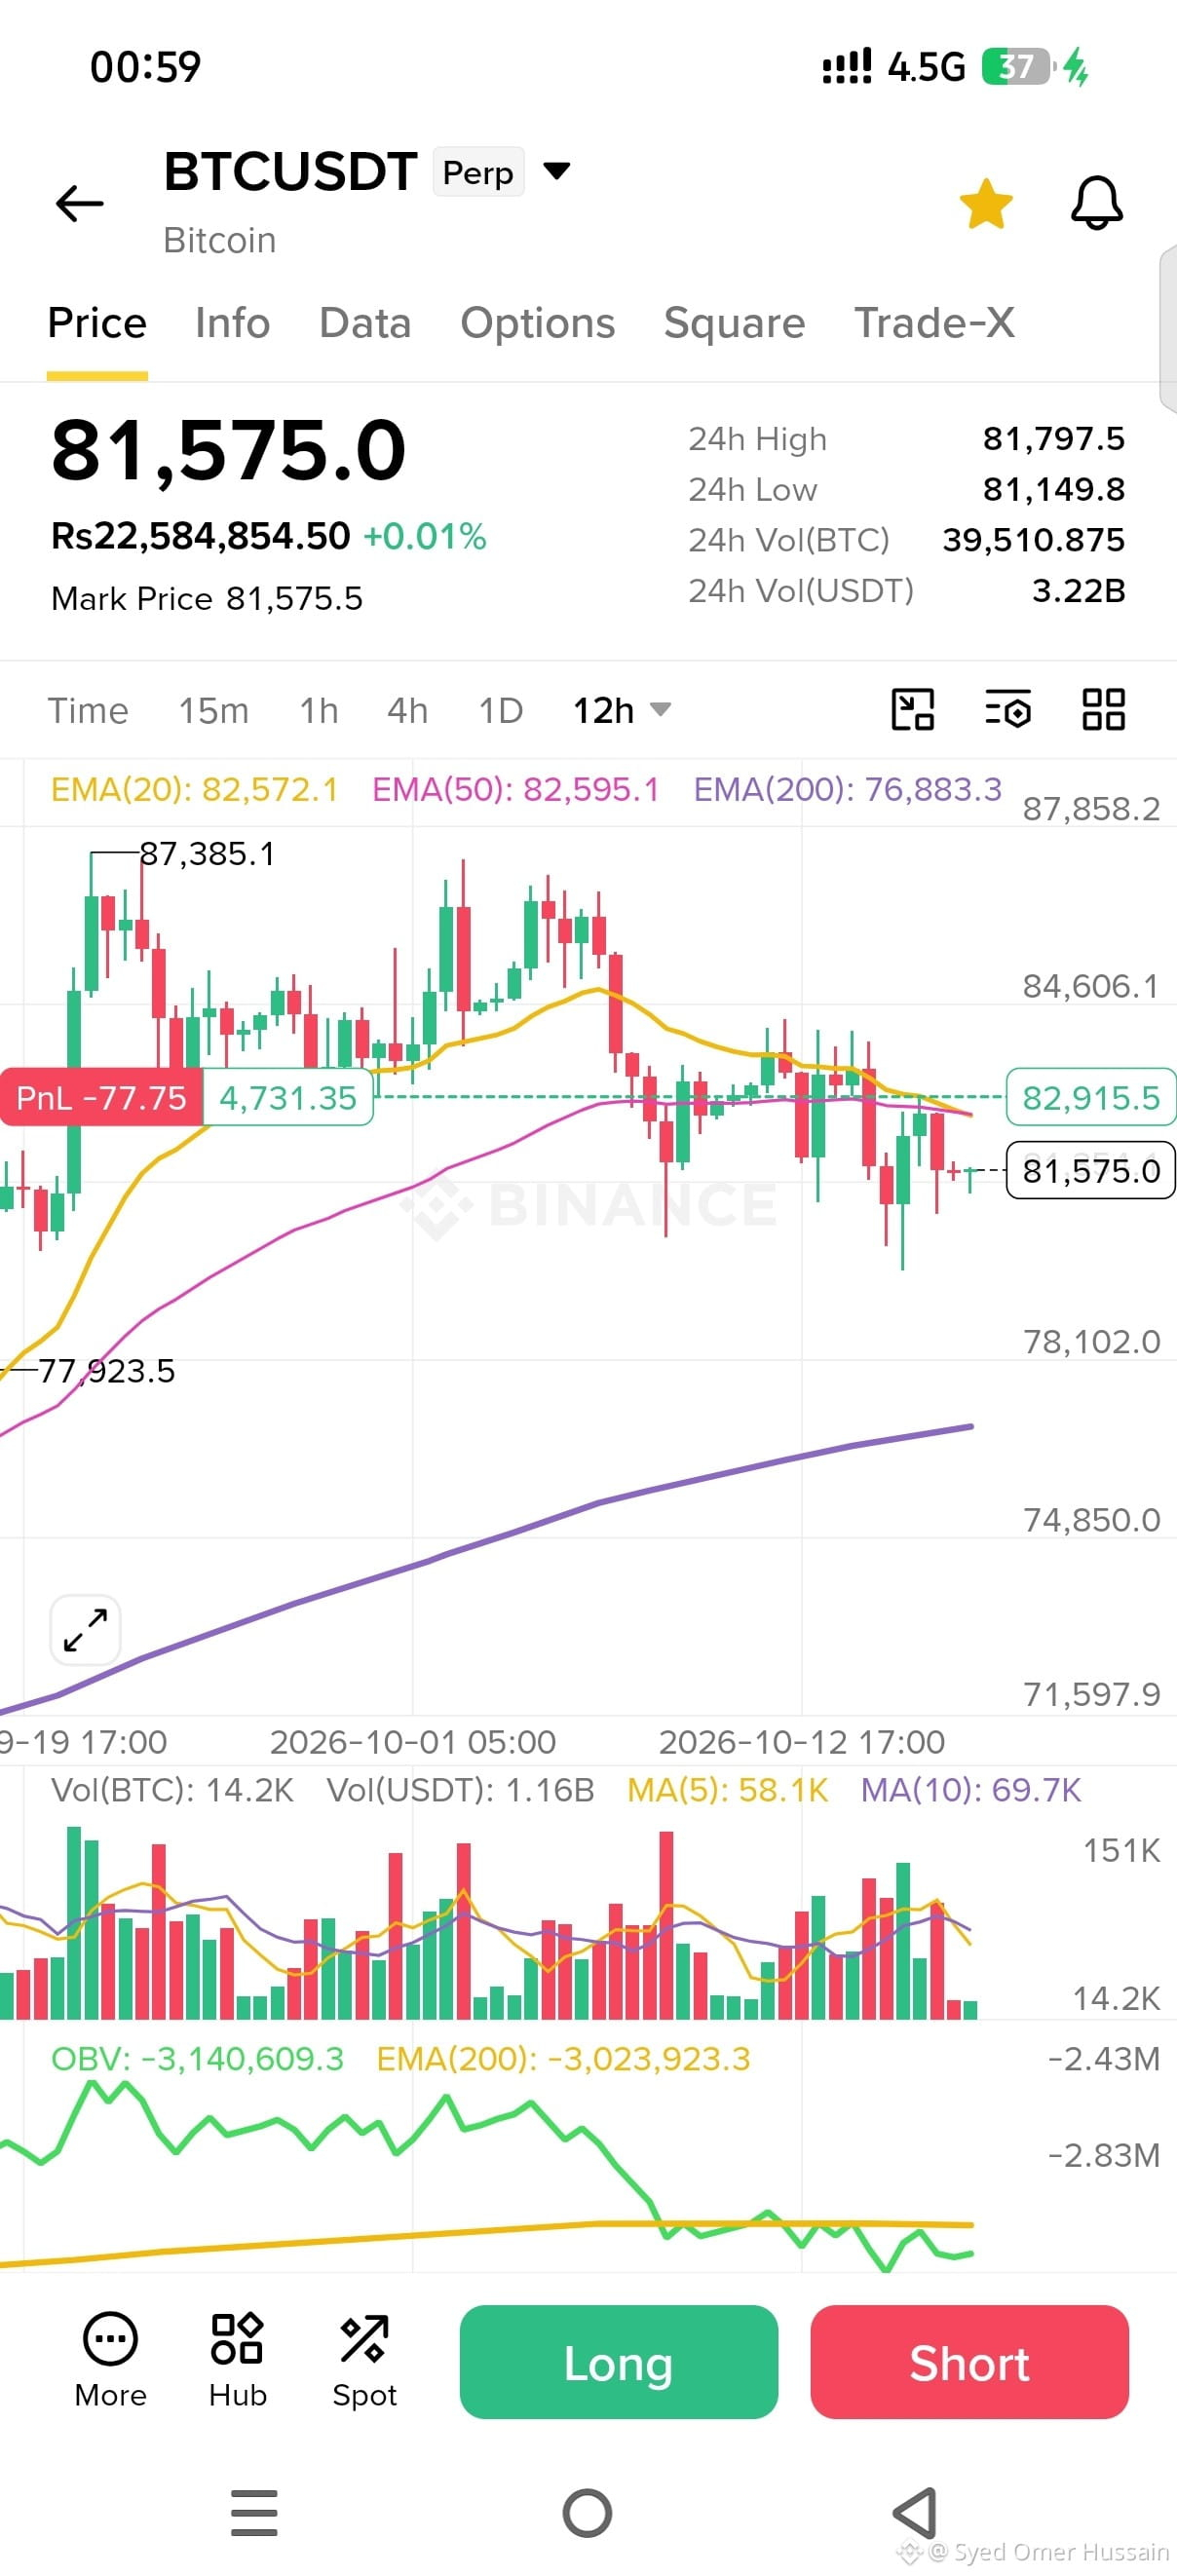
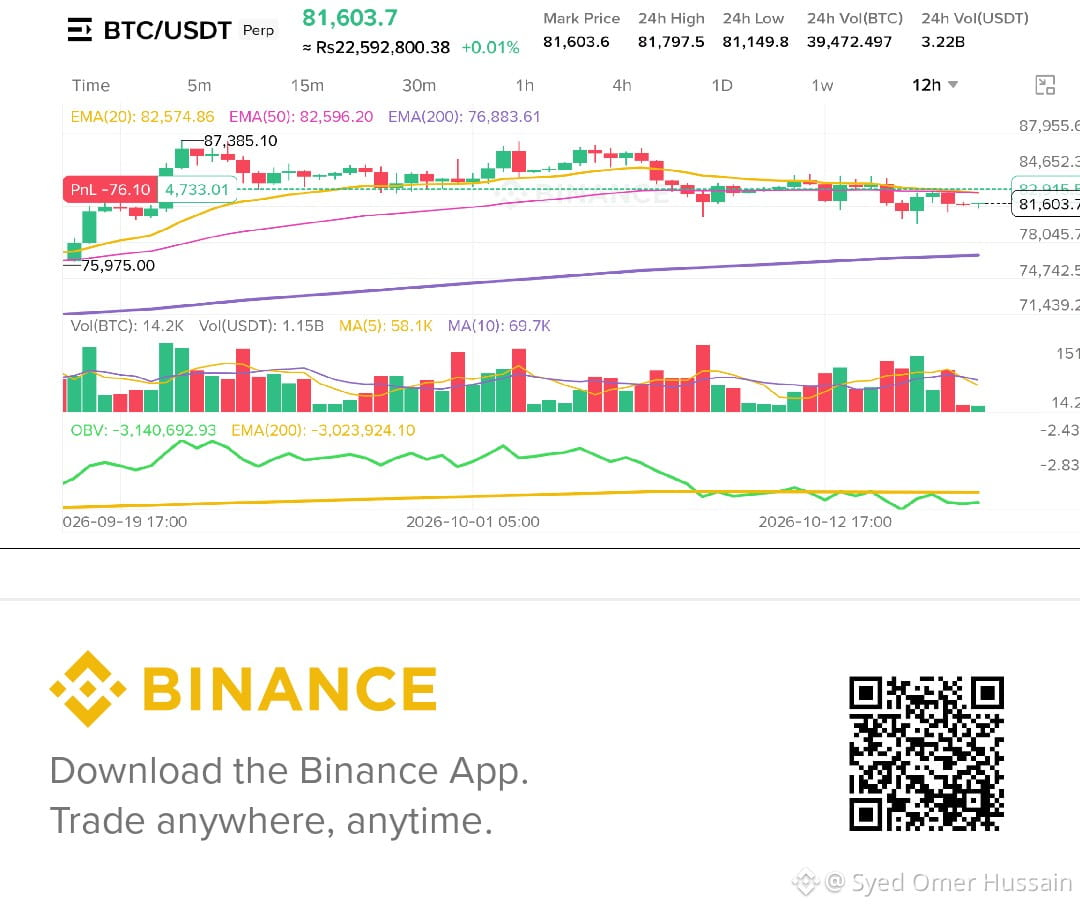
$BTC from market structure, I am currently assuming that market did nothing the previous igh and the graph is continuously on falling, this might not be a green signal for bullish momentum, however market is going well. and one who can manage risk can earn well, but keep in mind dont over trust the market because it always create fomo and in panic traders always take rong decision.
this is also intresting that all us stocks are. at. bottom low. but crypto is dancing high like it has some dealing with oil traders 😅😅😅
$BTC from market structure, I am currently assuming that market did nothing the previous igh and the graph is continuously on falling, this might not be a green signal for bullish momentum, however market is going well. and one who can manage risk can earn well, but keep in mind dont over trust the market because it always create fomo and in panic traders always take rong decision.
this is also intresting that all us stocks are. at. bottom low. but crypto is dancing high like it has some dealing with oil traders 😅😅😅
this is also intresting that all us stocks are. at. bottom low. but crypto is dancing high like it has some dealing with oil traders 😅😅😅
89
·
--
Bearish
Bitcoin charts flag $75K bottom, but analysts predict 40% rally before 2025 ends
Key takeaways:
Bitcoin’s drop below its MVRV Mean band puts $75,700 as the next major downside target.
BTC whales are accelerating their purchases as Wall Street analysts predict a 40% price rebound by year-end.
Bitcoin
BTC$81,565.19
may be preparing for a deeper decline after breaking below a crucial long-term support level that has helped stabilize its price since 2023.
Bitcoin price could plunge to $75,700
The BTC support stemmed from the MVRV Extreme Deviation Bands, a set of lines that indicate when Bitcoin is overvalued or undervalued compared to what most holders paid for their coins.
The most important line is the Mean band (yellow), which acted like Bitcoin’s “fair value.” When BTC traded above it, the market was usually healthy. When it fell below it, weakness often followed.
In previous cycles, once BTC lost this “fair value” line, the price usually drifted down toward the –0.5σ (teal) band.
As of Tuesday, the teal band aligned with the $75,700 level, down approximately 18% from current prices and now serving as the next downside target for Bitcoin.
A breakdown below the teal band could accelerate the sell-off toward the -1σ band (blue) at around $52,800, akin to the bear markets in 2022, 2021, and 2018.
The bearish outlook emerged as Bitcoin retreated 30% from its record high of around $126,300, erasing its year-to-date gains entirely and pushing its ETF investors into losses for the first time.
#ETHDropsBelow2400USDT #BitcoinShortTermHoldersReach4.08MBTC
Bitcoin charts flag $75K bottom, but analysts predict 40% rally before 2025 ends
Key takeaways:
Bitcoin’s drop below its MVRV Mean band puts $75,700 as the next major downside target.
BTC whales are accelerating their purchases as Wall Street analysts predict a 40% price rebound by year-end.
Bitcoin
BTC$81,565.19
may be preparing for a deeper decline after breaking below a crucial long-term support level that has helped stabilize its price since 2023.
Bitcoin price could plunge to $75,700
The BTC support stemmed from the MVRV Extreme Deviation Bands, a set of lines that indicate when Bitcoin is overvalued or undervalued compared to what most holders paid for their coins.
The most important line is the Mean band (yellow), which acted like Bitcoin’s “fair value.” When BTC traded above it, the market was usually healthy. When it fell below it, weakness often followed.
In previous cycles, once BTC lost this “fair value” line, the price usually drifted down toward the –0.5σ (teal) band.
As of Tuesday, the teal band aligned with the $75,700 level, down approximately 18% from current prices and now serving as the next downside target for Bitcoin.
A breakdown below the teal band could accelerate the sell-off toward the -1σ band (blue) at around $52,800, akin to the bear markets in 2022, 2021, and 2018.
The bearish outlook emerged as Bitcoin retreated 30% from its record high of around $126,300, erasing its year-to-date gains entirely and pushing its ETF investors into losses for the first time.
#ETHDropsBelow2400USDT #BitcoinShortTermHoldersReach4.08MBTC
Key takeaways:
Bitcoin’s drop below its MVRV Mean band puts $75,700 as the next major downside target.
BTC whales are accelerating their purchases as Wall Street analysts predict a 40% price rebound by year-end.
Bitcoin
BTC$81,565.19
may be preparing for a deeper decline after breaking below a crucial long-term support level that has helped stabilize its price since 2023.
Bitcoin price could plunge to $75,700
The BTC support stemmed from the MVRV Extreme Deviation Bands, a set of lines that indicate when Bitcoin is overvalued or undervalued compared to what most holders paid for their coins.
The most important line is the Mean band (yellow), which acted like Bitcoin’s “fair value.” When BTC traded above it, the market was usually healthy. When it fell below it, weakness often followed.
In previous cycles, once BTC lost this “fair value” line, the price usually drifted down toward the –0.5σ (teal) band.
As of Tuesday, the teal band aligned with the $75,700 level, down approximately 18% from current prices and now serving as the next downside target for Bitcoin.
A breakdown below the teal band could accelerate the sell-off toward the -1σ band (blue) at around $52,800, akin to the bear markets in 2022, 2021, and 2018.
The bearish outlook emerged as Bitcoin retreated 30% from its record high of around $126,300, erasing its year-to-date gains entirely and pushing its ETF investors into losses for the first time.
#ETHDropsBelow2400USDT #BitcoinShortTermHoldersReach4.08MBTC
1
234
·
--
Bearish
BTW on its lowest good time to diver in and take your profit, DOOR take a tight SL.
$BTW
{future}(BTWUSDT)
BTW on its lowest good time to diver in and take your profit, DOOR take a tight SL.
$BTW
$BTW
545
·
--
Bearish
#BTWUSDT⚡️
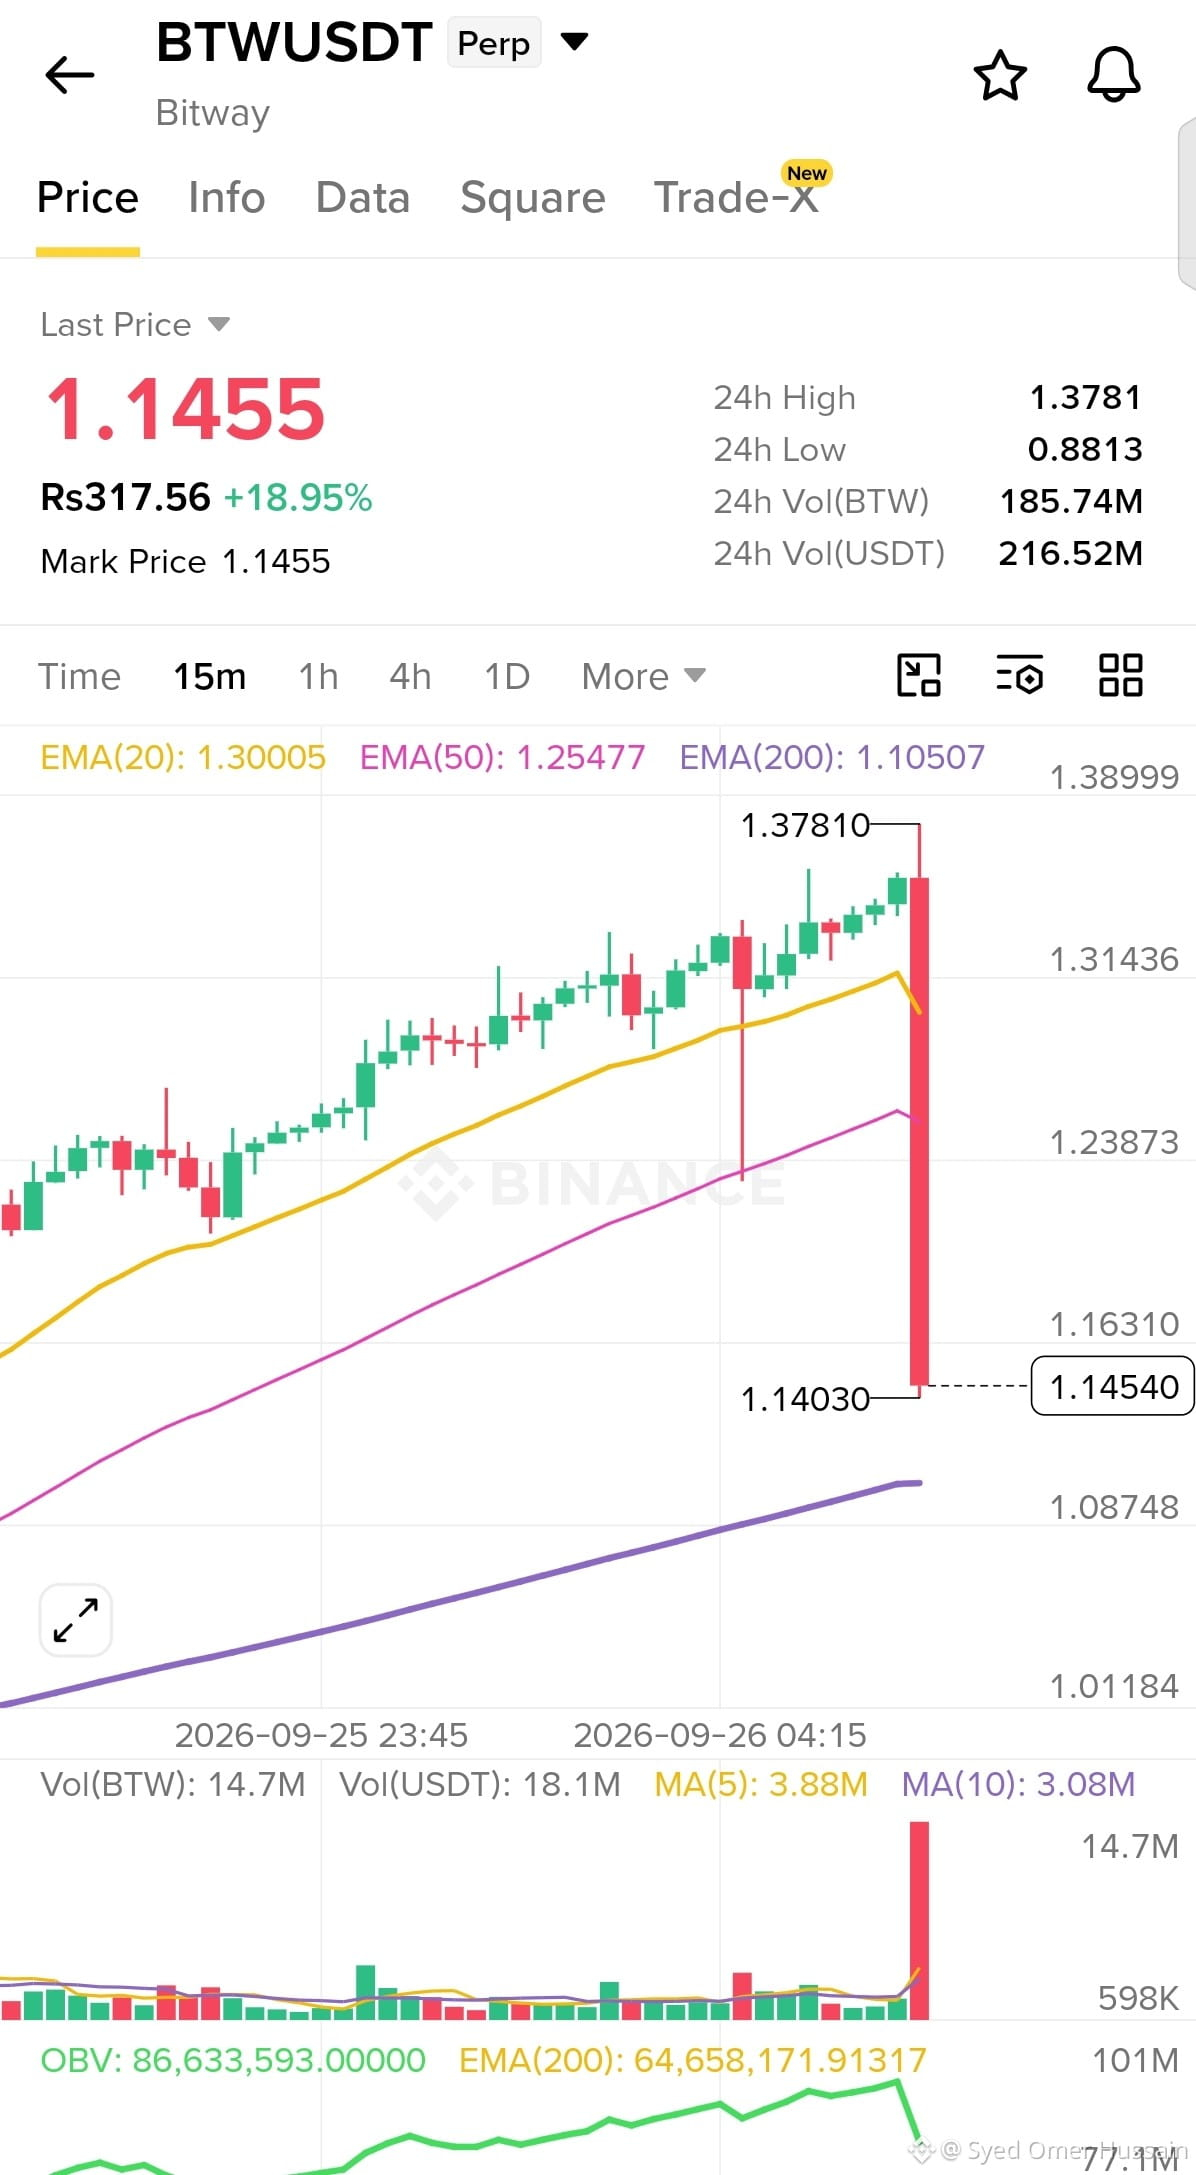
just see what happened . BTW a big fall, possibly whales are withdrawing their money $BTW #BitgetBreachForgedRequestsNotStolenKeys
#BTWUSDT⚡️
just see what happened . BTW a big fall, possibly whales are withdrawing their money $BTW #BitgetBreachForgedRequestsNotStolenKeys
just see what happened . BTW a big fall, possibly whales are withdrawing their money $BTW #BitgetBreachForgedRequestsNotStolenKeys
353

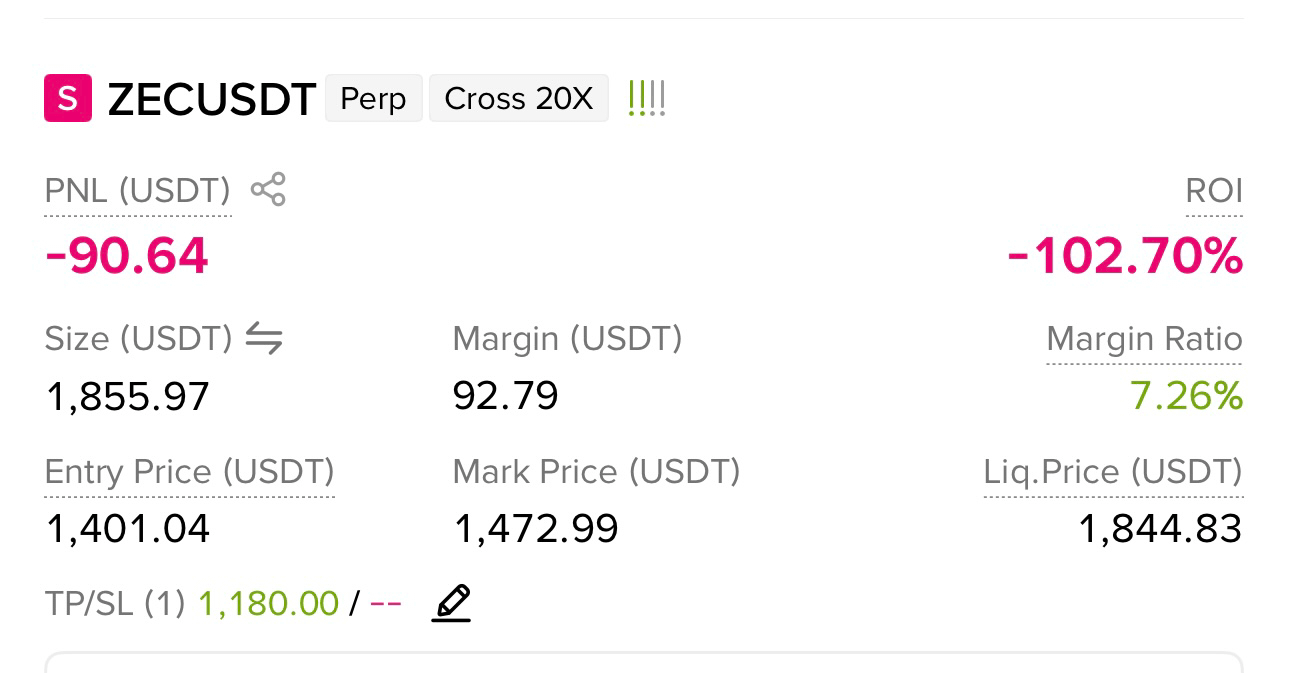
$ZEC how it's possible that a massive momentum is continuing who is funding this coin how can it's going so smartly on long , even if everyone is shorting this coin then how can it is carrying to much momentum nd whales are so strong that they don't wish to close their position, enough is enough too much damage so far now get back to your real slot i.e. 500$ 😜
$ZEC how it's possible that a massive momentum is continuing who is funding this coin how can it's going so smartly on long , even if everyone is shorting this coin then how can it is carrying to much momentum nd whales are so strong that they don't wish to close their position, enough is enough too much damage so far now get back to your real slot i.e. 500$ 😜
1
1
692
$ZEC what a rubbish coin when enter long it's go down and when's shot t go opposite. now today marker is not dumb as.much the zwc fall. dow
$ZEC what a rubbish coin when enter long it's go down and when's shot t go opposite. now today marker is not dumb as.much the zwc fall. dow
1
393
·
--
Bearish
I assume that BTC will touch 77k as of now major liquidity is at 77200 and I think market will not move upward before taking that liquidity, what you guys think. about it ??
I assume that BTC will touch 77k as of now major liquidity is at 77200 and I think market will not move upward before taking that liquidity, what you guys think. about it ??
95
·
--
Bearish
#GOLD_UPDATE I am seeing gold market on falling trend on 4H chart also the all stocks come on halt as gold momentum not showing current direction
$XAU
#GOLD_UPDATE I am seeing gold market on falling trend on 4H chart also the all stocks come on halt as gold momentum not showing current direction
$XAU
$XAU
76
what you guys think with current market situation ?
what you guys think with current market situation ?
97
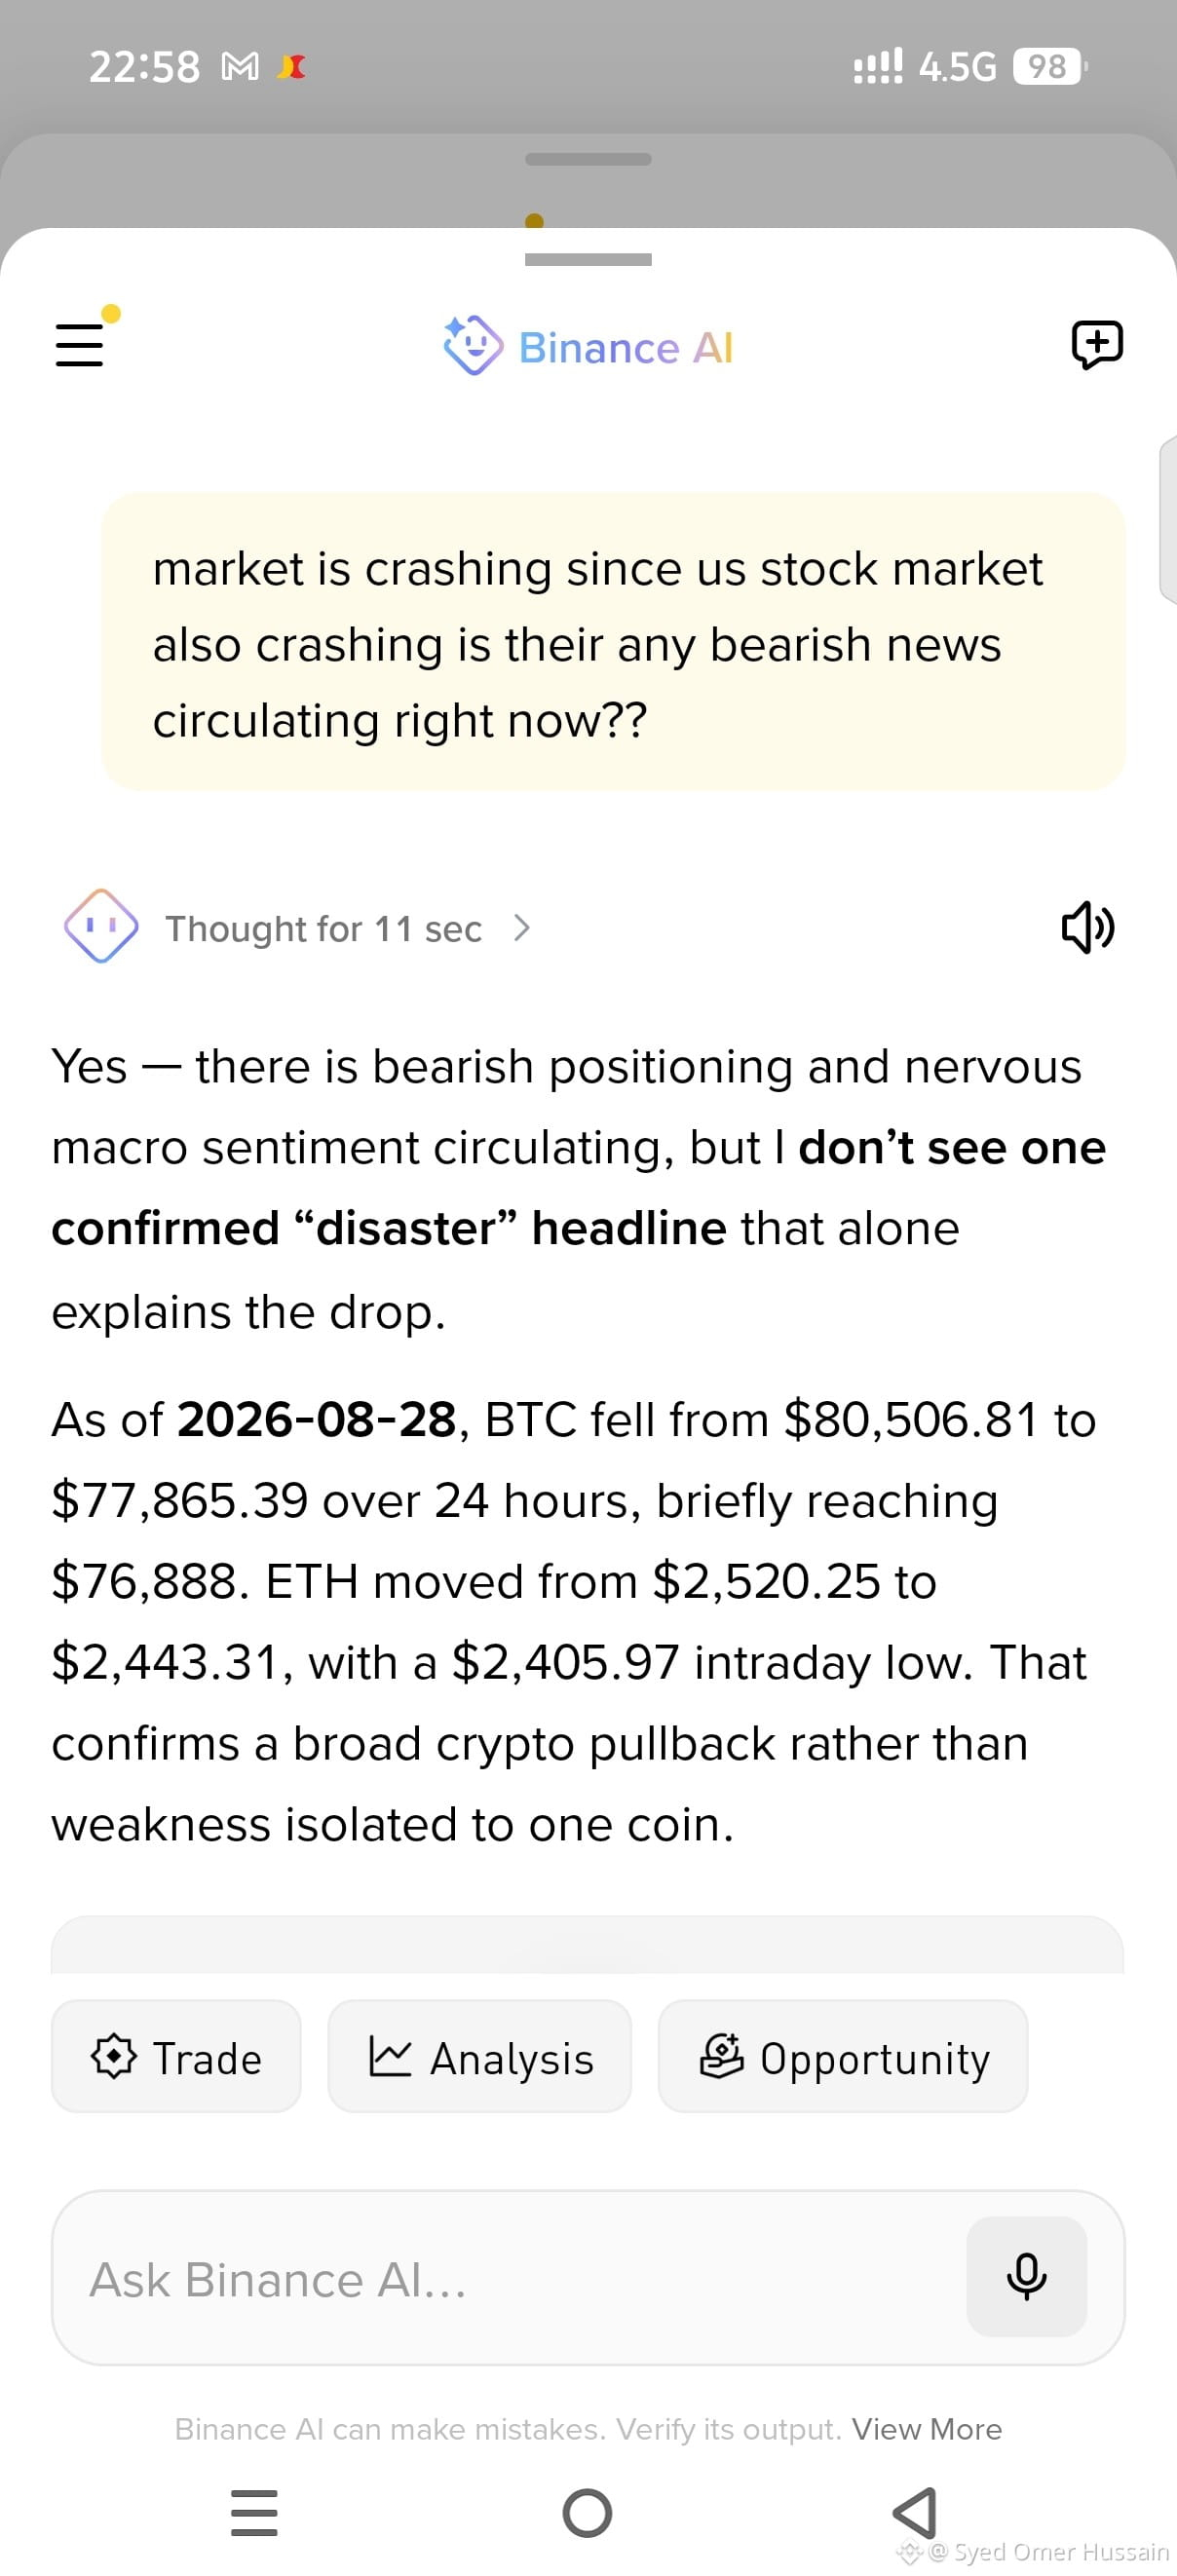
my question to binance AI I am a bit confused is their chances of lower hard push ? ?
my question to binance AI I am a bit confused is their chances of lower hard push ? ?
100
$SOL is skyrocketing, bears are now scared to catch his ath
$SOL is skyrocketing, bears are now scared to catch his ath
107
$ETH what is this kind of trading ts a manipulation with force liquidation, how can a dead coin like eth jumps like a devil jumping n your head is this is not even high volatility ts a mess where you can't yourself even your stop loss hit on a huge price due to massive surge like some budy is cutting tree with a saw. binance is fraud its system halts on massive move cz need to answer this.
$ETH what is this kind of trading ts a manipulation with force liquidation, how can a dead coin like eth jumps like a devil jumping n your head is this is not even high volatility ts a mess where you can't yourself even your stop loss hit on a huge price due to massive surge like some budy is cutting tree with a saw. binance is fraud its system halts on massive move cz need to answer this.
13
Log in to explore more content
Join global crypto users on Binance Square
⚡️ Get latest and useful information about crypto.
💬 Trusted by the world’s largest crypto exchange.
👍 Discover real insights from verified creators.
Email / Phone number
Trending Topics
CanBTCReboundAfterFallingBelow60K?
0 views
63 Discussing
Bitcoin News | Bitcoin Falls Below $60,000 for the First Time Since July as IBIT Posts Record $541 Million Outflow
Binance News
·8 Likes
·7.7k views
GlobalStocksFaceLongestLosingStreakSince2023
0 views
234 Discussing
AnthropicPlungesTowardIPOPriceonDay2
0 views
17 Discussing