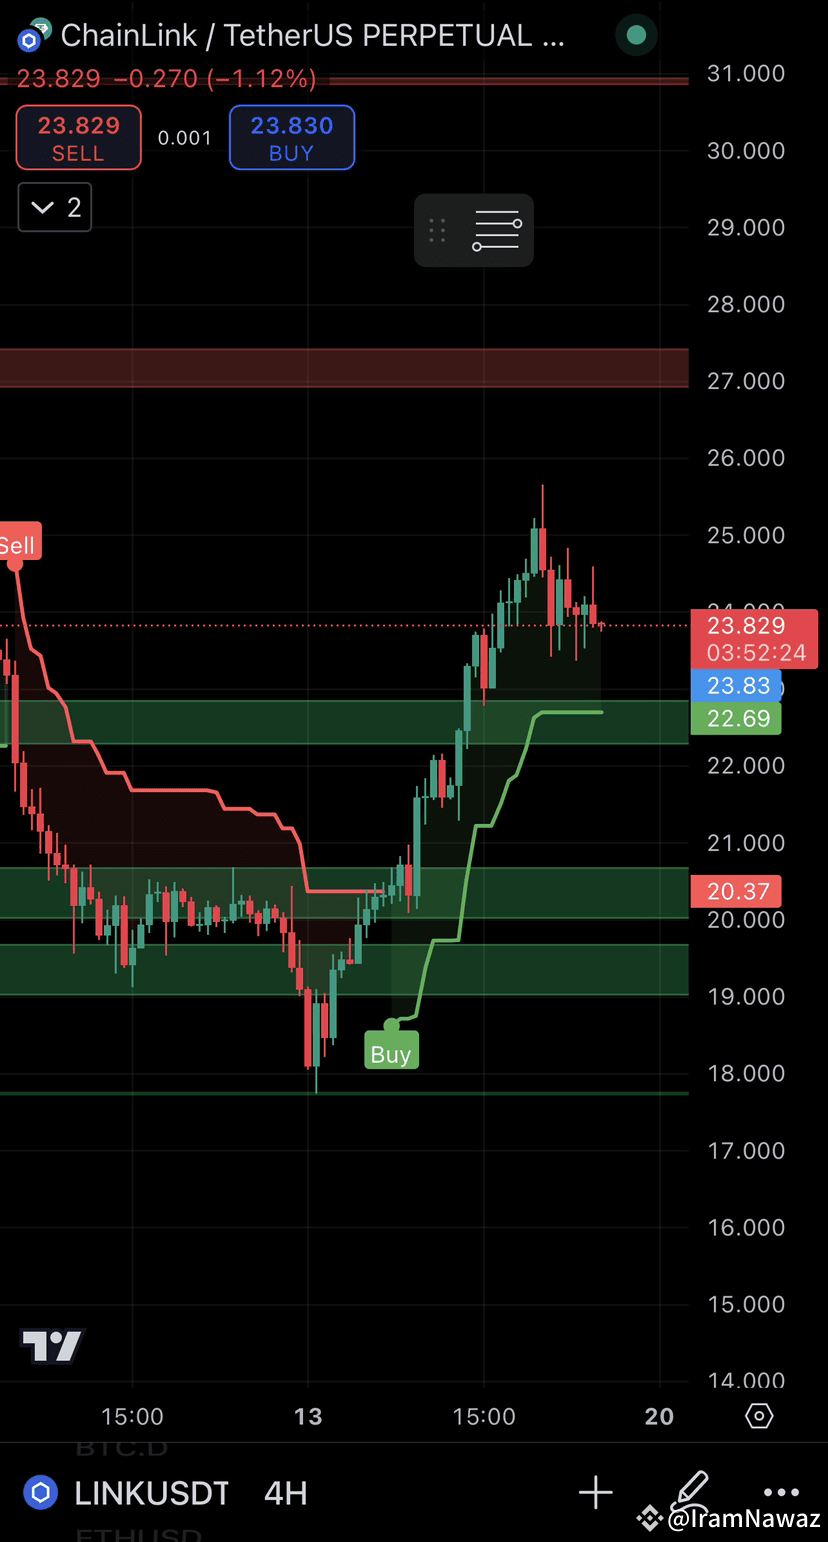
Here is the technical analysis based on the 4-hour LINK/USDT chart provided:
Technical Analysis:
1. Trend:
• The chart suggests an overall bullish trend in the short term as price has been making higher highs and higher lows.
• The green buy zones and red sell zones on the chart indicate strong demand and resistance levels.
2. Support and Resistance:
• Key Support Levels: $22.69 (nearest support zone), $20.37 (secondary support zone).
• Key Resistance Level: $27 (highlighted sell zone).
3. Momentum:
• The price is currently consolidating near $23.83 after rejecting higher levels.
• A retracement toward support is possible before another move upward.
Trading Signal:
1. Entry Point:
• Aggressive Entry: Near $23.83 (current price) for continuation of the uptrend.
• Conservative Entry: Near the key support level at $22.69 if the price dips.
2. Stop-Loss Placement:
• Aggressive Entry: Place a stop-loss below $22.50.
• Conservative Entry: Place a stop-loss below $20.00 to account for volatility.
3. Take-Profit Targets:
• Target 1: $25.50 (initial resistance level).
• Target 2: $27.00 (major sell zone).
4. Risk-to-Reward Ratio:
• Aggressive Entry: Approx. 1:2 R/R with stop-loss at $22.50 and targets at $25.50 and $27.00.
• Conservative Entry: Higher R/R since it leverages a strong support level.
Intraday Recommendation:
• Watch for price action near $23.83 or $22.69 to determine the strength of buying interest.
• Exit partially at $25.50 to secure profits and hold the rest toward $27.00 if momentum continues.
• Be cautious if the price breaks below $22.50, as it could signal further downside.
Let me know if you’d like more clarification!
Technical Analysis:
1. Trend:
• The chart suggests an overall bullish trend in the short term as price has been making higher highs and higher lows.
• The green buy zones and red sell zones on the chart indicate strong demand and resistance levels.
2. Support and Resistance:
• Key Support Levels: $22.69 (nearest support zone), $20.37 (secondary support zone).
• Key Resistance Level: $27 (highlighted sell zone).
3. Momentum:
• The price is currently consolidating near $23.83 after rejecting higher levels.
• A retracement toward support is possible before another move upward.
Trading Signal:
1. Entry Point:
• Aggressive Entry: Near $23.83 (current price) for continuation of the uptrend.
• Conservative Entry: Near the key support level at $22.69 if the price dips.
2. Stop-Loss Placement:
• Aggressive Entry: Place a stop-loss below $22.50.
• Conservative Entry: Place a stop-loss below $20.00 to account for volatility.
3. Take-Profit Targets:
• Target 1: $25.50 (initial resistance level).
• Target 2: $27.00 (major sell zone).
4. Risk-to-Reward Ratio:
• Aggressive Entry: Approx. 1:2 R/R with stop-loss at $22.50 and targets at $25.50 and $27.00.
• Conservative Entry: Higher R/R since it leverages a strong support level.
Intraday Recommendation:
• Watch for price action near $23.83 or $22.69 to determine the strength of buying interest.
• Exit partially at $25.50 to secure profits and hold the rest toward $27.00 if momentum continues.
• Be cautious if the price breaks below $22.50, as it could signal further downside.
Let me know if you’d like more clarification!