


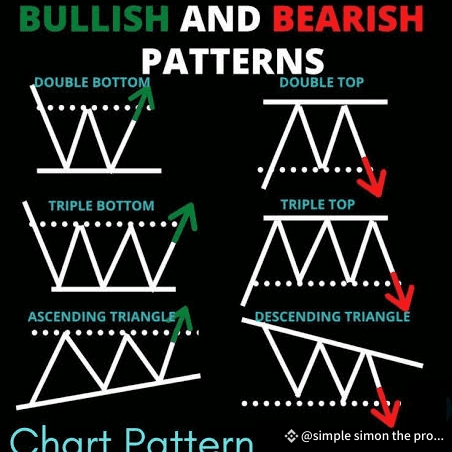
Alright, traders, when you see the words *bullish* and *bearish* 🤔 what comes to your mind? A raging bull charging? 🐂 Or a bear on the hunt? 🐻 Let’s get a little more *sensitized* about these terms, because understanding *bullish* and *bearish patterns* can *completely change* your crypto trading game! 🚀💰
*What Do Bullish and Bearish Mean?* 🧐
- *Bullish* = The market is *going up*! 📈
- Think of a *bull* charging forward, pushing the market *higher*.
- When you see bullish patterns, it’s a sign that prices *might rise*.
- *Bearish* = The market is *going down*! 📉
- Picture a *bear* swiping down with its claws, pulling the market *lower*.
- When you see bearish patterns, it’s a sign that prices *might fall*.
*Bullish Patterns (Signs of a Price Surge) 📈*
1. *Cup and Handle* 🏆
- *What is it?* A pattern where the price forms a "cup" shape (a rounded bottom), followed by a small "handle" before breaking upwards.
- *What does it indicate?* It’s a *bullish continuation* pattern, suggesting that after the consolidation (cup), the price will likely break higher (handle breakout). 🚀
2. *Ascending Triangle* 🔺
- *What is it?* A triangle pattern with a flat top (resistance) and rising bottom (support).
- *What does it indicate?* This is a *bullish continuation* pattern, meaning the price is likely to break the resistance level to the upside. 📊
3. *Double Bottom* 🔄
- *What is it?* A "W" shaped pattern where the price hits a low, bounces up, falls again to the same level, and then rises.
- *What does it indicate?* It’s a *bullish reversal* pattern, suggesting the downtrend is over and the price is ready to rise. 💥
*Bearish Patterns (Signs of a Price Drop) 📉*
1. *Head and Shoulders* 👤👤👤
- *What is it?* A pattern where the price creates a peak (head), followed by two smaller peaks (shoulders) on either side.
- *What does it indicate?* This is a *bearish reversal* pattern, suggesting that after the peak (head), the price is likely to drop. 📉
2. *Descending Triangle* 🔻
- *What is it?* A triangle pattern with a flat bottom (support) and declining top (resistance).
- *What does it indicate?* This is a *bearish continuation* pattern, meaning the price is likely to break the support level to the downside. 🔻
3. *Double Top* 🔼
- *What is it?* An "M" shaped pattern where the price hits a high, falls, rises again to the same level, and then drops.
*What does it indicate?* It’s a *bearish reversal* pattern, suggesting the uptrend is over and the price is ready to fall. 📉
*How to Spot These Patterns?* 👀
- *Look at the Charts* 📊
Use candlestick charts and zoom out to see the overall trend. Look for *rounded bottoms*, *triangles*, or *peaks* that signal a reversal or continuation.
A *bullish chart pattern* means you should *consider buying* or *holding*. A *bearish chart pattern* might mean it’s time to *sell* or *prepare for a pullback*.
- *Volume is Key* 🔑
Always check the *volume* that accompanies the breakout or breakdown. A *high volume* during a breakout means the trend is strong. Low volume? Be cautious! 🚨
*Pro Tip:* 🧠
- *Bullish patterns* generally signal a *buy* opportunity. If the price breaks above resistance or shows strength after a pullback, it might be time to jump in.
- *Bearish patterns* generally signal a *sell* opportunity. If the price breaks below support or shows weakness after a rally, it might be time to lock in profits or exit.
*In Conclusion* 🏁
Understanding these *bullish* and *bearish* patterns can help you *predict* where the market is headed, giving you a better chance at *timing your trades* perfectly. 🔥
🚀 *Stay sharp, stay ahead, and trade wisely!* 💪


#BinanceAlphaAlert #BTCBelow92K #SolvProtocolMegadrop #MicroStrategyStockSale #DEXVolumeRecord