Falling Wedge
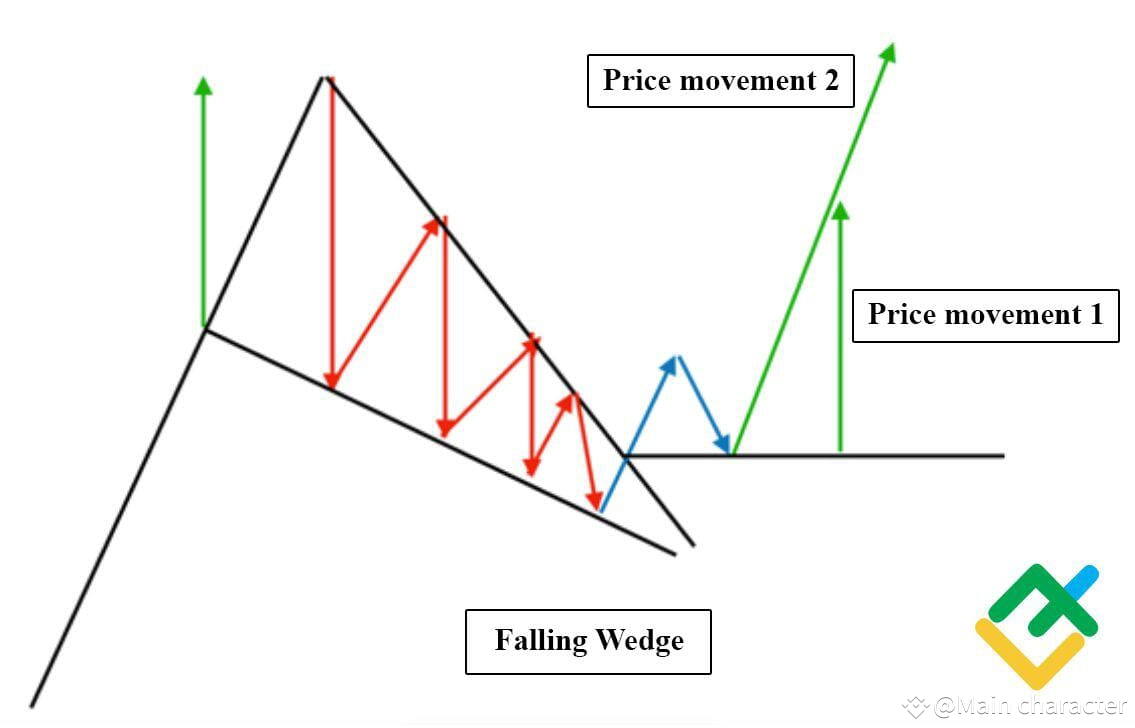
The falling wedge is one of the continuation patterns that resembles the triangle chart pattern, so novice day traders often make mistakes when opening trades. The main difference between a falling wedge and ascending triangles or descending triangles is the downward trend of support and resistance lines, while a triangle has a clear horizontal line of support or resistance. As part of risk management, price movement must be defined as the height of the wedge itself. However, with a massive increase in trading volumes, quotes may go even higher.
You can see an example of the falling wedge stock chart patterns below in the 15-minute Apple Inc chart.
The picture shows that the price was gradually decreasing after the prevailing trend in bullish direction, while the lows and highs of the price were declining. After the narrowing of the trading channel, there was an impulse breakdown of quotes upwards. After waiting for the re-testing of the broken resistance line, we could open a buy trade with the target higher by the level of the falling wedge height. Stop loss in this case should be set at the lower border of the trading channel.
The falling wedge is one of the continuation patterns that resembles the triangle chart pattern, so novice day traders often make mistakes when opening trades. The main difference between a falling wedge and ascending triangles or descending triangles is the downward trend of support and resistance lines, while a triangle has a clear horizontal line of support or resistance. As part of risk management, price movement must be defined as the height of the wedge itself. However, with a massive increase in trading volumes, quotes may go even higher.
You can see an example of the falling wedge stock chart patterns below in the 15-minute Apple Inc chart.
The picture shows that the price was gradually decreasing after the prevailing trend in bullish direction, while the lows and highs of the price were declining. After the narrowing of the trading channel, there was an impulse breakdown of quotes upwards. After waiting for the re-testing of the broken resistance line, we could open a buy trade with the target higher by the level of the falling wedge height. Stop loss in this case should be set at the lower border of the trading channel.