

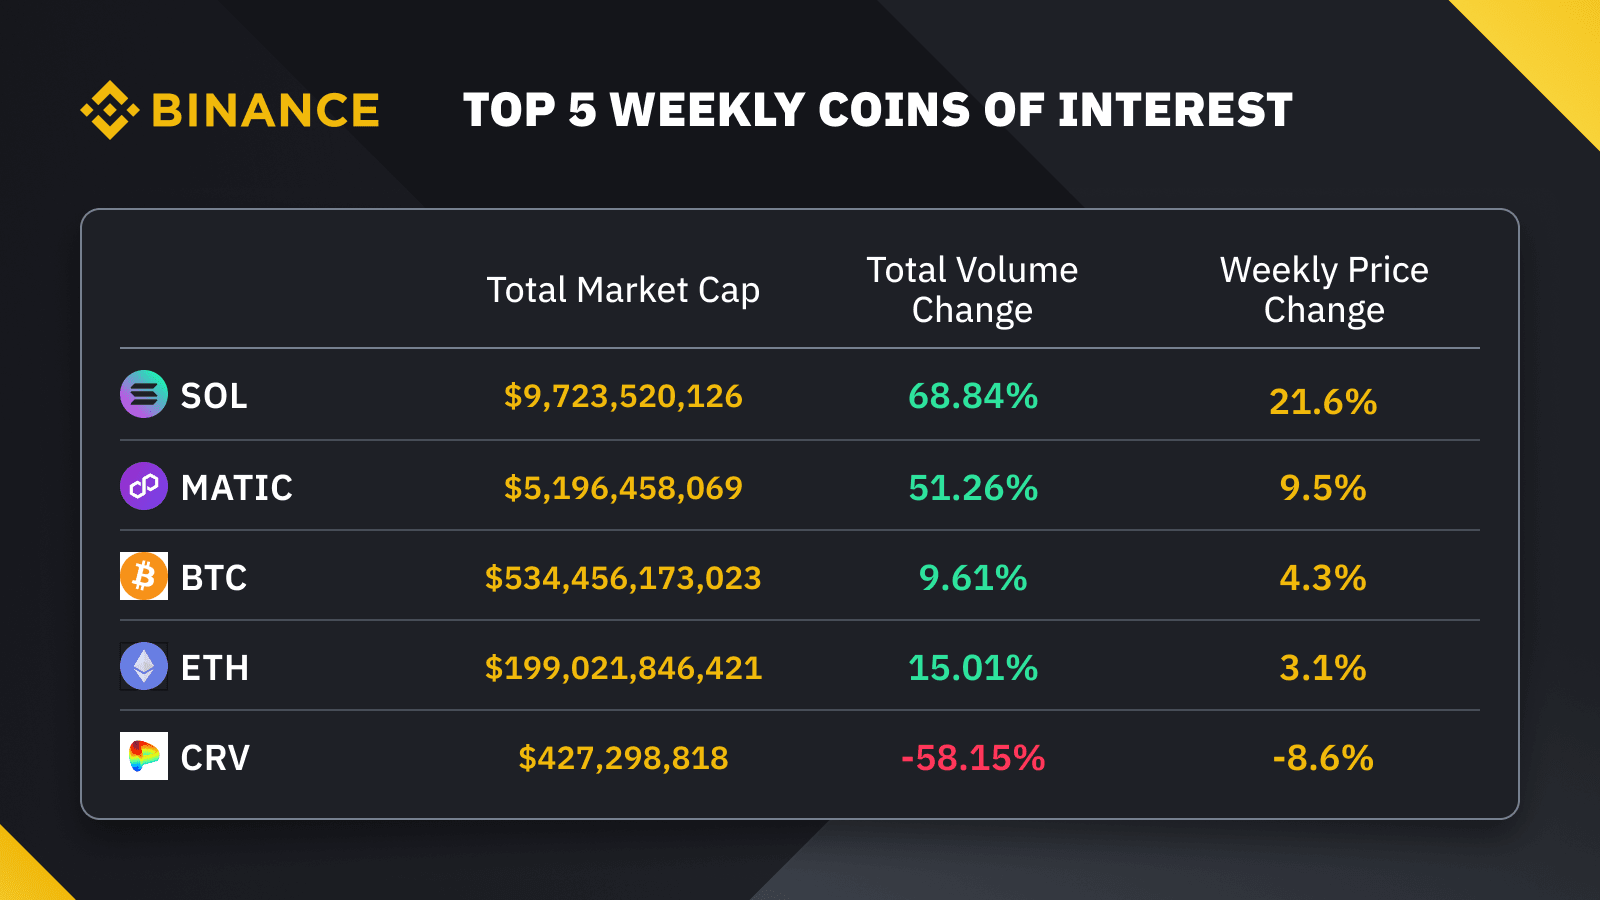
On Saturday, September 30, Bitwise Asset Management, the largest crypto index fund manager in America, announced the launch of the futures-based Ethereum ETF on Monday, October 2.
ETH price soared over 6% from $1,677 to $1,778 in one hour after the CME futures market opened on Sunday. BTC price, as a result, soared over 3% from $27,150 to $28,065 during the same period.
However, ETH retraced quickly after the disappointing volume of all six ETH ETFs on the first day of listing. ETH price dropped to the $1,650 level on Monday after the US market closed.
BTC price also retraced from the high of $28,500 on Monday down to the $27,400 level.
The volatile ETH trading after the CME opened on Sunday was more likely due to short-covering. As the market did not see a significant inflow into Ethereum, the bullish sentiment quickly faded away. ETH price retraced to where it started and declined further.
Options Market
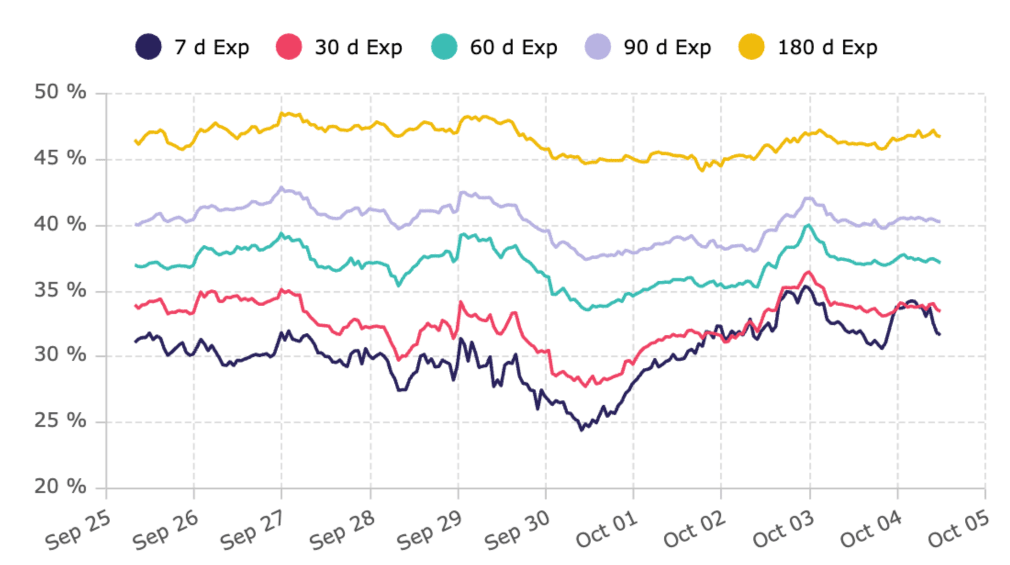
The above table is the implied volatility chart for BTC options.
On September 30, the implied volatility across all expiries in BTC options decreased. The change was caused by the passage of the 45-day funding bill to avoid a US government shutdown. After the bill was passed, implied volatility dipped especially on the front end.
Yet, the implied volatility has risen again since Sunday night as a result of the volatile market movement led by ETH. The short-cover spike in ETH had a ripple effect on the rest of the crypto space and pushed the BTC price to reclaim the $28,000 level.
After the quick retracement in Ethereum, BTC also faced a sell-off. Additionally, macro conditions continue to favour the US dollar, bringing more pressure to the BTC price.
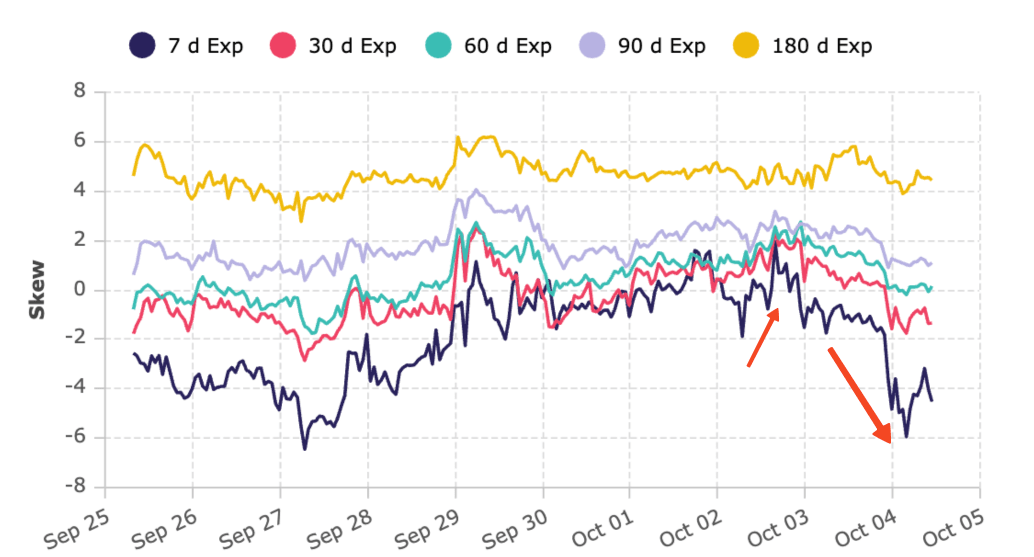
The above chart shows the 25-delta skewness in BTC options.
Our desk uses 25-delta skewness as a proxy to monitor market sentiment. When the ETH future-based ETFs started to trade in the US session, our desk observed the skewness change from negative to positive in the front-end options.
However, the change quickly reversed after the market noticed that the ETH ETFs were not getting the expected attention from capital markets. The low trading volume in the newly-listed ETFs shifted the market sentiment to bearish.
And the bearish sentiment was reflected in the skewness chart as it dropped further into deep negative territory.
The above chart suggests that the market sees bearish sentiment in the near term, while it maintains a bullish view in the longer term (180-day expiries).
Macro at a glance
Last Wednesday (2023-09-27)
US core durable goods orders increased 0.4% month-over-month in August, better than the 0.1% estimated. The improvement was mainly due to the revision in July from 5.6% to 5.2%. Hence, the better-than-expected data could not imply a strong demand for durable goods.
Last Thursday (2023-09-28)
German CPI reading was at 4.5% year-over-year, better than the estimated 4.6% and significantly improved from last month’s 6.1%. The improvement shows that the ECB’s interest rate hikes may be starting to take effect.
US Q2 GDP growth was reported at 2.1% quarter-over-quarter, in line with expectations. The US economy's growth is at the same pace as the Fed projected.
US initial jobless claims continue to be in the low range, reported at 204k, below the estimated 215k. This shows the US labour market continues to be in a tight environment.
UK Q2 GDP growth is reported at 0.2% quarter-over-quarter, in line with expectations.
Last Friday (2023-09-29)
Eurozone reported the CPI reading at 4.3% year-over-year, better than the estimated 4.5% and the previous month’s 5.2%. The improvement in fighting inflation could ease the pressure on the ECB for another rate hike. Our desk expects the ECB to pause and keep rates unchanged at the next meeting.
The US reports the PCE price index change at 3.5% year-over-year, slightly up from last month’s 3.4%. The core PCE price index dropped from 4.3% in July to 3.9% in August. The changes in data support the Fed’s September pause to allow the lagging effect of rate hikes to take place. The inflation rate being in the 3% range also eases the pressure from the Fed’s shoulder for an aggressive rate hike. However, before we see the 2% inflation, the “higher-for-longer” narrative is still in play.
On Monday (2023-10-02)
US ISM Manufacturing PMI was at 49.0, higher than the estimated 47.7. The better-than-expected PMI data shows improvement in the US manufacturing sector.
On Tuesday (2023-10-03)
The JOLTs job openings in August were reported at 9.61 million, much larger than the estimated 8.80 million. The data suggests that the demand in the labour market is strong, and it strengthens the expectation that the Federal Reserve will maintain a high interest rate for a longer period of time.
The US dollar ($DXY) soared above 107 while the yen was tipped towards 150 against the US dollar. The strong dollar puts pressure on all assets priced in US dollars, including crude oil, gold, and bitcoin.
WTI crude oil dropped over 6% from the $94.9 high, and gold posted an 11-day straight decline to $1,820. BTC price soared $28,500 with the short covering move led by ETH, but gave up most of the gains to trade around the $27,400 level.
Convert Portal Volume Breakdown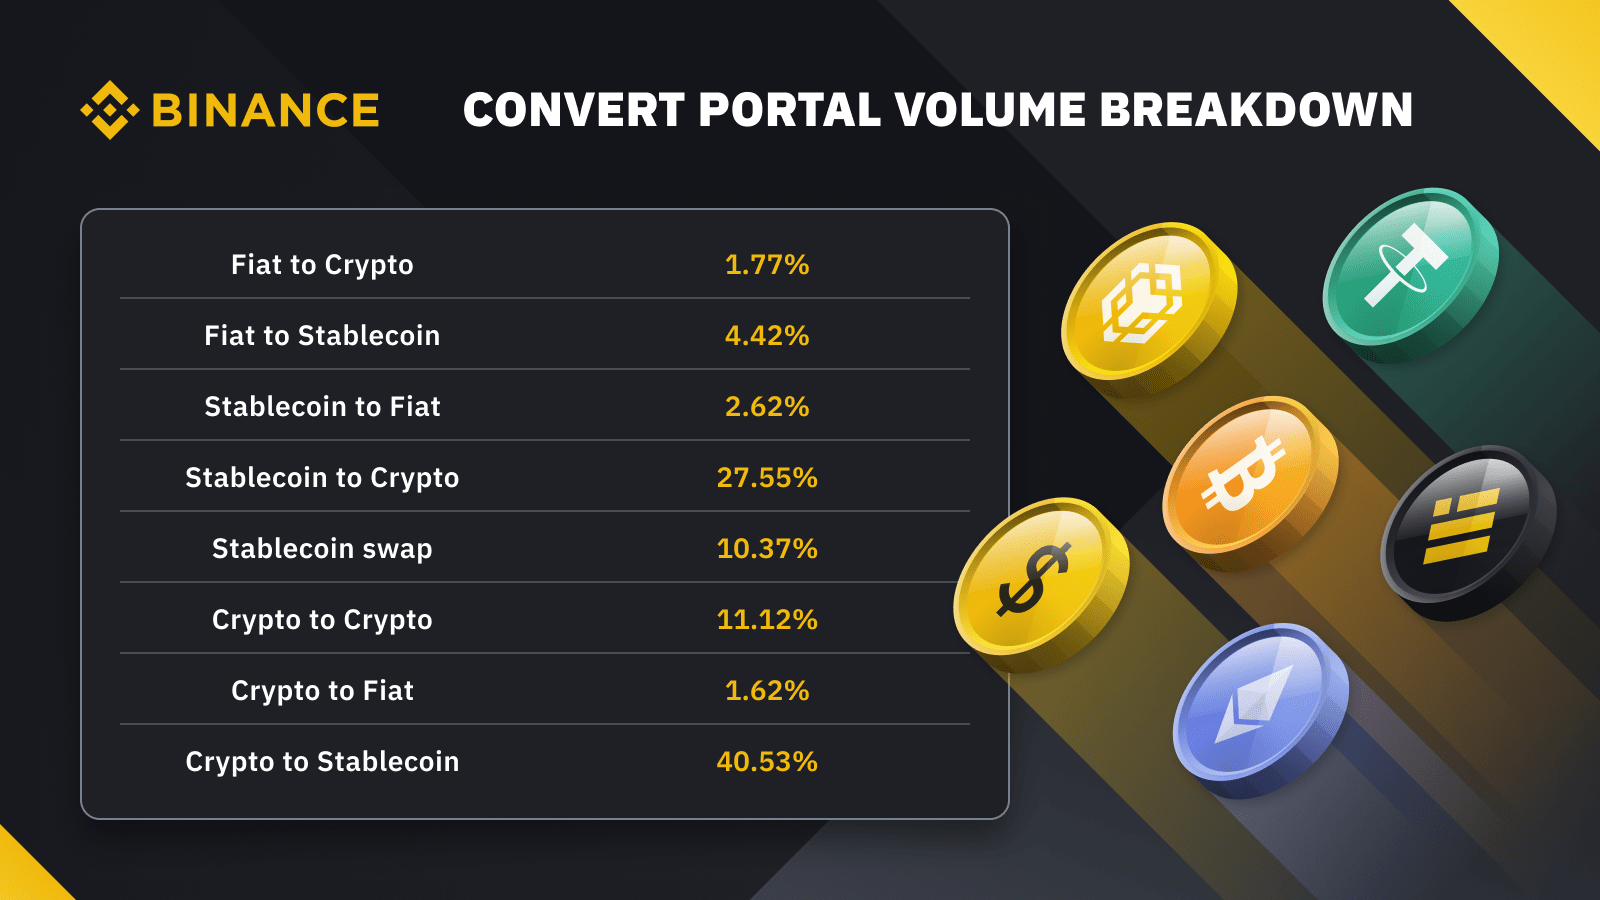
The above table shows the volume breakdown of our Convert Portal.
Last week, our desk observed more transactions in the stablecoin-to-crypto category. With the spike in ETH and BTC at the beginning of the week, we saw a significant trade volume increase in this category.
As the pump quickly faded away in crypto prices, the demand to convert crypto assets to stablecoins on Convert Portal increased. The trade volume in the crypto-to-stablecoin category spiked from 34.31% to 40.53% this week.
Crypto-to-crypto transactions dropped from 12.70% to 11.12% during the same period. It indicates that investors have been seemingly less willing to allocate capital between different tokens. Instead, investors moved their assets back to stablecoins to await the next opportunity.
Why trade OTC?
Binance offers our clients various ways to access OTC trading, including chat communication channels and the Binance Spot RFQ platform (https://www.binance.com/en/OTC-Trading) for manual price quotations, or automated price quotations via our Binance Convert and the Binance Convert OTC API. For manual price quotations, you may visit our Spot RFQ Platform, where you can RFQ (request-for-quote) and trade directly with our OTC trading team via a live chat, or reach out to us via our email at trading@binance.com for our trading desk to get in touch with you and get started.
Alternatively, OTC trades may also be automatically quoted on Binance Convert and via API, offering users a quick and simple way to execute trades across 60,000+ pairs with one simple click. Binance Convert supports over 350 tokens listed on the exchange including fiat pairs. Begin trading from as little as 1 USD. To start, simply navigate to the Binance Convert (https://www.binance.com/en/convert), select the coins you wish to trade, preview and confirm the quote with settlement reflecting almost instantly in your wallet balance. For details and access to Binance Convert OTC API, please refer to our Convert Endpoints (https://binance-docs.github.io/apidocs/spot/en/#convert-endpoints) and reach out to us at trading@binance.com if you have any questions or require assistance.
Visit Binance OTC and Execution Solutions (https://www.binance.com/en/otc) to get more information on our OTC products and solutions.
Experience the main benefits of Binance Convert and OTC Trading:
Fast & Competitive Pricing
Instant settlement
Widest availability of coins
Bespoke service with unique market insights
Zero fees and slippage
Email: trading@binance.com
Join our Telegram to stay up to date with the markets!