
#tokenomics
tokenomics
2.1M views
4,098 Discussing
Hot
Latest

·
--
Everyone thinks a flood of buy orders guarantees a token pump, but actually, order count means nothing when supply distribution is heavily skewed.
Most retail traders see green volume candles on $BNB launches and jump in out of FOMO, only to watch their portfolio bleed out in minutes. Getting caught in an instant launch dump is painful, especially when on-chain activity looks deceitfully bullish at first glance.
Think of a new token launch like a concert with two entrance doors. When 20,085 buyers rush through with 46,675 buy orders, they look like an unstoppable crowd compared to just 8,714 sellers executing 16,038 sells. But if a handful of sellers hold massive backstage passes, they can dump heavy bags on everyone at once. That is how the $LAPTOP token cratered over 95% from its $0.05 pool price within the first hour.
On-chain analysis revealed that 60% of the top-holder wallets were completely fresh, suggesting automated sniper bots scooped up supply at inception before regular participants had a chance. While the team denied selling and promised to add 4 million $LAPTOP in liquidity incentives, recovering from such an aggressive liquidity drain is never straightforward.
How do you protect your capital when evaluating new token launches with suspicious wallet distribution?
#CryptoSafety #Tokenomics #TradingTips
Everyone thinks a flood of buy orders guarantees a token pump, but actually, order count means nothing when supply distribution is heavily skewed.
Most retail traders see green volume candles on $BNB launches and jump in out of FOMO, only to watch their portfolio bleed out in minutes. Getting caught in an instant launch dump is painful, especially when on-chain activity looks deceitfully bullish at first glance.
Think of a new token launch like a concert with two entrance doors. When 20,085 buyers rush through with 46,675 buy orders, they look like an unstoppable crowd compared to just 8,714 sellers executing 16,038 sells. But if a handful of sellers hold massive backstage passes, they can dump heavy bags on everyone at once. That is how the $LAPTOP token cratered over 95% from its $0.05 pool price within the first hour.
On-chain analysis revealed that 60% of the top-holder wallets were completely fresh, suggesting automated sniper bots scooped up supply at inception before regular participants had a chance. While the team denied selling and promised to add 4 million $LAPTOP in liquidity incentives, recovering from such an aggressive liquidity drain is never straightforward.
How do you protect your capital when evaluating new token launches with suspicious wallet distribution?
#CryptoSafety #Tokenomics #TradingTips
Most retail traders see green volume candles on $BNB launches and jump in out of FOMO, only to watch their portfolio bleed out in minutes. Getting caught in an instant launch dump is painful, especially when on-chain activity looks deceitfully bullish at first glance.
Think of a new token launch like a concert with two entrance doors. When 20,085 buyers rush through with 46,675 buy orders, they look like an unstoppable crowd compared to just 8,714 sellers executing 16,038 sells. But if a handful of sellers hold massive backstage passes, they can dump heavy bags on everyone at once. That is how the $LAPTOP token cratered over 95% from its $0.05 pool price within the first hour.
On-chain analysis revealed that 60% of the top-holder wallets were completely fresh, suggesting automated sniper bots scooped up supply at inception before regular participants had a chance. While the team denied selling and promised to add 4 million $LAPTOP in liquidity incentives, recovering from such an aggressive liquidity drain is never straightforward.
How do you protect your capital when evaluating new token launches with suspicious wallet distribution?
#CryptoSafety #Tokenomics #TradingTips
11

·
--
Verified
Red flags before launch? The Hunter Biden-themed meme coin $LAPTOP is facing heavy investor backlash.
With a 1B token supply, a massive 30% is allocated to founders, while another 30% is locked behind a "conditional" burn. Investors are raising eyebrows over these questionable tokenomics.
In a market pushing for transparency, is $LAPTOP too risky even for a meme coin? Tread carefully and DYOR! 🚨
#MemeCoins #CryptoNews #Tokenomics
Red flags before launch? The Hunter Biden-themed meme coin $LAPTOP is facing heavy investor backlash.
With a 1B token supply, a massive 30% is allocated to founders, while another 30% is locked behind a "conditional" burn. Investors are raising eyebrows over these questionable tokenomics.
In a market pushing for transparency, is $LAPTOP too risky even for a meme coin? Tread carefully and DYOR! 🚨
#MemeCoins #CryptoNews #Tokenomics
With a 1B token supply, a massive 30% is allocated to founders, while another 30% is locked behind a "conditional" burn. Investors are raising eyebrows over these questionable tokenomics.
In a market pushing for transparency, is $LAPTOP too risky even for a meme coin? Tread carefully and DYOR! 🚨
#MemeCoins #CryptoNews #Tokenomics
25

·
--
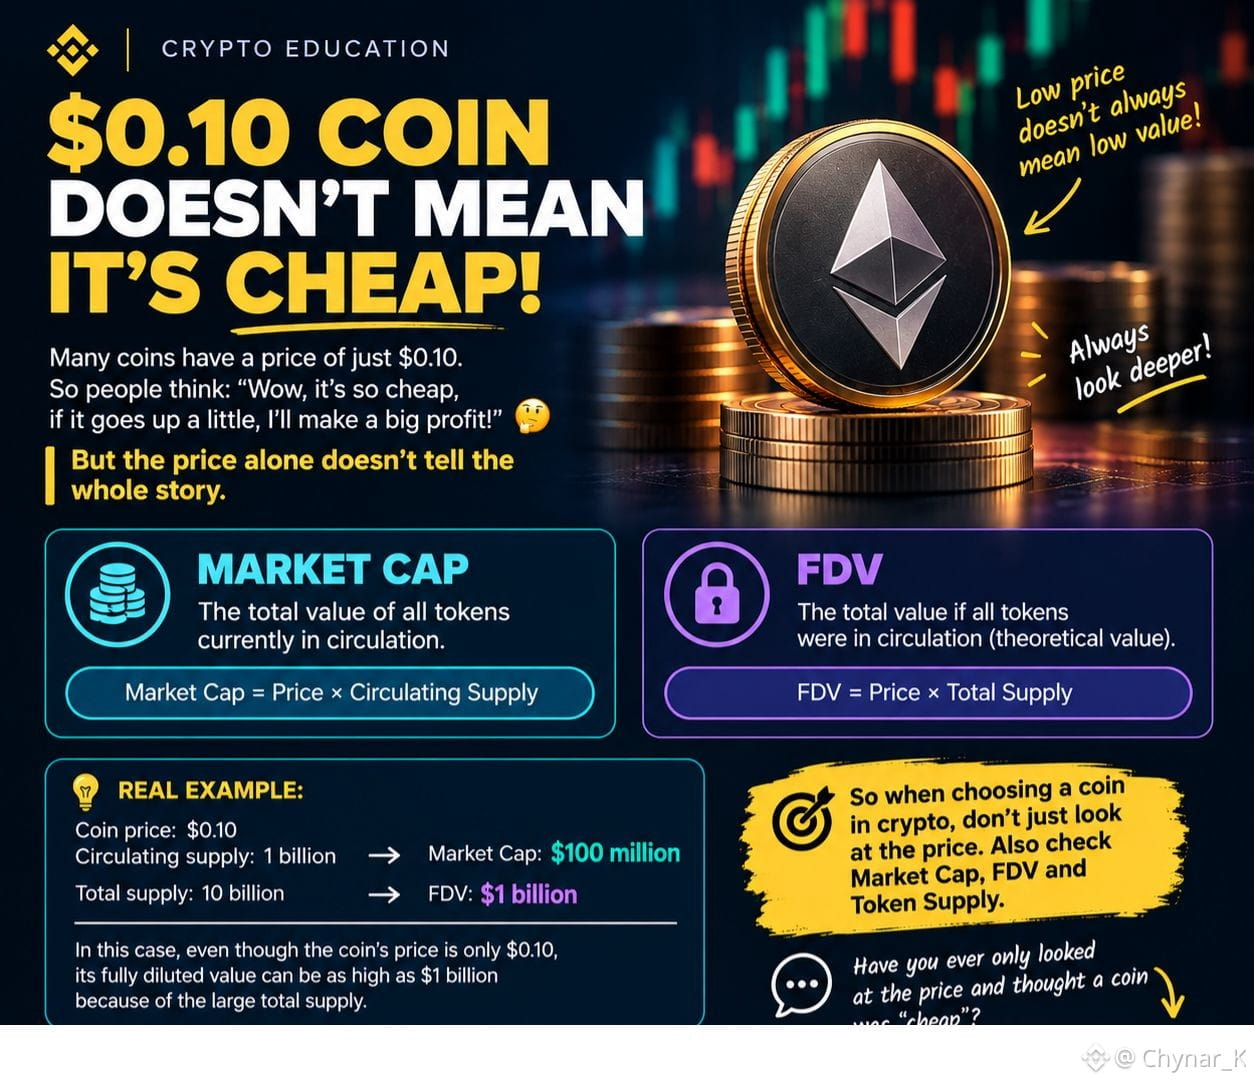
🚨 A $0.10 COIN DOESN’T MEAN IT’S CHEAP
Have you ever wondered why?
The answer is Market Cap vs FDV. 📊
A token can have a very low price but an enormous supply — making its total valuation much higher than it looks.
Would you like a simple example of how FDV works? 👇
#CryptoEducation #Tokenomics #Crypto #BinanceSquare
🚨 A $0.10 COIN DOESN’T MEAN IT’S CHEAP
Have you ever wondered why?
The answer is Market Cap vs FDV. 📊
A token can have a very low price but an enormous supply — making its total valuation much higher than it looks.
Would you like a simple example of how FDV works? 👇
#CryptoEducation #Tokenomics #Crypto #BinanceSquare
Have you ever wondered why?
The answer is Market Cap vs FDV. 📊
A token can have a very low price but an enormous supply — making its total valuation much higher than it looks.
Would you like a simple example of how FDV works? 👇
#CryptoEducation #Tokenomics #Crypto #BinanceSquare
79

·
--
Token Unlocks: What You Need to Watch
High-profile token unlocks like Hyperliquid (HYPE) test market depth. Before buying any altcoin rally, always check the upcoming supply release schedule to avoid holding through heavy dilution.
#Tokenomics #CryptoTips
Token Unlocks: What You Need to Watch
High-profile token unlocks like Hyperliquid (HYPE) test market depth. Before buying any altcoin rally, always check the upcoming supply release schedule to avoid holding through heavy dilution.
#Tokenomics #CryptoTips
High-profile token unlocks like Hyperliquid (HYPE) test market depth. Before buying any altcoin rally, always check the upcoming supply release schedule to avoid holding through heavy dilution.
#Tokenomics #CryptoTips
39

Verified
Article
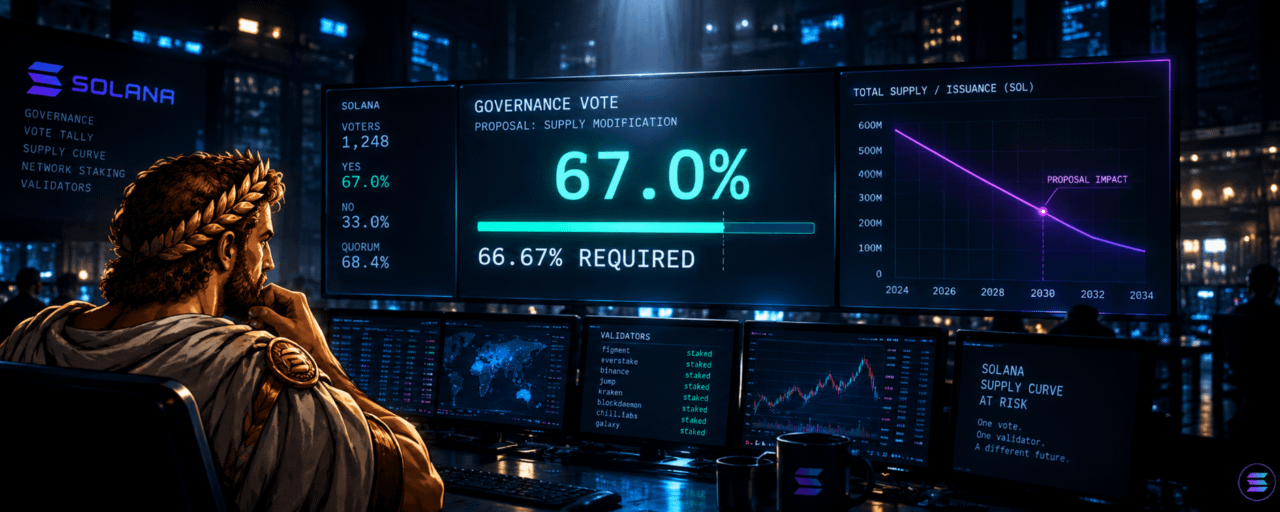
One Validator Almost Changed Solana's Entire Supply CurveFor eight hours on August 27–28, 2026, Solana's most consequential governance proposal in its history existed in two contradictory states at once. One outlet reported it dead. Another reported it alive. Both were right — at different moments, separated by a single validator changing its mind.
That's not a data error. That's the story.
Solana just doubled its disinflation rate through SGP-0002 (built on the technical proposal SIMD-0550), cutting future SOL issuance by an estimated 18.9 million tokens over six years. The obvious question — "is this bullish for SOL?" — is the wrong one to start with. The real question is: **why did the network's stakeholders agree to slow issuance, but refuse, on the same day, to increase token burns?** Two proposals, similar support levels, opposite outcomes. Understanding that gap tells you more about Solana's actual power structure than the headline number does.
THE CONSENSUS
FACT: Crypto media and social sentiment treated SGP-0002's passage as unambiguously bullish — less new supply, faster path to Solana's 1.5% terminal inflation rate (2029 instead of 2032). The framing across timelines was simple: less dilution → stronger long-term price case.
WHAT CHANGED
TIMELINE (FACT):
1. Aug 21— Solana activates the first phase of slot-time reduction (400ms → 350ms) under SIMD-0525, unrelated but concurrent network change.
2. Aug 23–24 — Voting opens on three bundled proposals: SGP-0001 (Constitution), SGP-0002 (Double Disinflation), SGP-0003 (Fee Restructuring).
3. Aug 27, end of epoch 1023 — One published account (CryptoBriefing) reports SGP-0002 and SGP-0003 both failing to clear the 66.67% supermajority.
4. Aug 28— Multiple later reports (Decrypt, Forklog, Cointelegraph) confirm SGP-0002 passed at exactly 67.0%, with Kraken switching its vote from "against" to "for" late in the count.
SIGNAL: The discrepancy between the Aug 27 and Aug 28 reports isn't sloppy journalism — it's a live record of a vote that was, at one point, genuinely failing.
THE HIDDEN STORY
INTERPRETATION: The two proposals hit different stakeholders differently. Disinflation reduces issuance growth — a slow-moving, years-long tapering that validators can plan around. The fee-burn proposal would have redirected a *direct, immediate* portion of validator revenue into burns instead of validator pockets. One is a gradual haircut. The other is a pay cut effective next epoch.
THESIS: Validators — who hold outsized voting weight because Solana's governance is stake-weighted, not one-token-one-vote in a retail sense — will support tokenomics changes that improve the asset's long-term image *as long as those changes don't directly reduce their own near-term income.* SGP-0002 passed because it costs validators years from now. SGP-0003 failed because it would have cost them immediately.
This is a first-principles point: **Solana's governance isn't voting on "what's good for SOL holders." It's voting on what's tolerable for the entities who hold enough stake to vote at all.** Those aren't automatically the same group.
THE CONTRADICTION
If disinflation is genuinely bullish and validators are rational long-term holders, they should have supported *both* proposals — deeper burns plus slower issuance is a stronger deflationary combination than either alone. They didn't. The market narrative ("Solana just got more bullish tokenomics") is true only for one-third of what was actually proposed.
THE COUNTER-THESIS
It's possible the rejection of SGP-0003 had nothing to do with validator self-interest and everything to do with legitimate technical concerns — unpredictable fee-burn ranges (7,500–9,000 SOL/day is a wide band) could introduce network-fee volatility that harms user experience, not just validator revenue. Solana Labs itself reportedly opposed both proposals initially, which cuts against a pure "validators protecting their own income" reading. The simpler explanation may be: SGP-0003 was a less mature proposal, not a self-interested veto.
I can't fully separate these two explanations with the evidence available. Both are plausible. This is a case where I don't have enough to call it.
WHAT WOULD CONFIRM IT
- On-chain issuance data over the next several epochs showing the disinflation schedule is actually being implemented (SIGNAL, not yet observed).
- A future fee-related proposal, redesigned with a narrower or delayed burn range, gaining validator support — which would suggest the *design*, not the incentive, was the real obstacle.
- Validator staking yields declining roughly in line with model projections, without a validator exodus.
WHAT WOULD KILL IT
- If validator count or total stake participation drops materially after implementation, it would suggest disinflation was tolerated on paper but is destabilizing network security in practice — turning a "less dilution" story into a "weaker security budget" story.
- If a near-identical fee-burn proposal resurfaces with *validator-friendly* terms and still fails, that would support the self-interest thesis harder. If it passes, that undermines it.
THE INCENTIVES
FACT: SIMD-0550 was authored by Helius, an infrastructure firm — not Solana Labs, which reportedly opposed the disinflation change.
INTERPRETATION: Helius's business model benefits from a healthier long-term SOL valuation narrative more than from validator fee income, which may explain why an infrastructure company pushed harder on this than the validators who ultimately had to approve it.
THE PROBABILITY
This is a moderate-confidence thesis, not a strong one. The vote-margin evidence (67.0 vs. 66.67, a literal one-validator swing) and the split outcome between two similarly-supported proposals are solid, verifiable facts. The *interpretation* — that validator self-interest explains the split — is plausible and consistent with the data, but unproven. Treat it as a working hypothesis, not a conclusion.
WHAT I'M WATCHING NEXT
Not SOL's price. Three specific things:
1. Whether on-chain issuance actually drops on schedule over the coming epochs.
2. Whether validator count/stake participation holds steady through the transition.
3. Whether a redesigned fee-burn proposal returns — and whether its outcome supports or contradicts the incentive-based explanation above.
NFA. #ZeroResearch #Solana #SolanaGovernance #Tokenomics
$SOL
{spot}(SOLUSDT)
One Validator Almost Changed Solana's Entire Supply Curve
For eight hours on August 27–28, 2026, Solana's most consequential governance proposal in its history existed in two contradictory states at once. One outlet reported it dead. Another reported it alive. Both were right — at different moments, separated by a single validator changing its mind.
That's not a data error. That's the story.
Solana just doubled its disinflation rate through SGP-0002 (built on the technical proposal SIMD-0550), cutting future SOL issuance by an estimated 18.9 million tokens over six years. The obvious question — "is this bullish for SOL?" — is the wrong one to start with. The real question is: **why did the network's stakeholders agree to slow issuance, but refuse, on the same day, to increase token burns?** Two proposals, similar support levels, opposite outcomes. Understanding that gap tells you more about Solana's actual power structure than the headline number does.
THE CONSENSUS
FACT: Crypto media and social sentiment treated SGP-0002's passage as unambiguously bullish — less new supply, faster path to Solana's 1.5% terminal inflation rate (2029 instead of 2032). The framing across timelines was simple: less dilution → stronger long-term price case.
WHAT CHANGED
TIMELINE (FACT):
1. Aug 21— Solana activates the first phase of slot-time reduction (400ms → 350ms) under SIMD-0525, unrelated but concurrent network change.
2. Aug 23–24 — Voting opens on three bundled proposals: SGP-0001 (Constitution), SGP-0002 (Double Disinflation), SGP-0003 (Fee Restructuring).
3. Aug 27, end of epoch 1023 — One published account (CryptoBriefing) reports SGP-0002 and SGP-0003 both failing to clear the 66.67% supermajority.
4. Aug 28— Multiple later reports (Decrypt, Forklog, Cointelegraph) confirm SGP-0002 passed at exactly 67.0%, with Kraken switching its vote from "against" to "for" late in the count.
SIGNAL: The discrepancy between the Aug 27 and Aug 28 reports isn't sloppy journalism — it's a live record of a vote that was, at one point, genuinely failing.
THE HIDDEN STORY
INTERPRETATION: The two proposals hit different stakeholders differently. Disinflation reduces issuance growth — a slow-moving, years-long tapering that validators can plan around. The fee-burn proposal would have redirected a *direct, immediate* portion of validator revenue into burns instead of validator pockets. One is a gradual haircut. The other is a pay cut effective next epoch.
THESIS: Validators — who hold outsized voting weight because Solana's governance is stake-weighted, not one-token-one-vote in a retail sense — will support tokenomics changes that improve the asset's long-term image *as long as those changes don't directly reduce their own near-term income.* SGP-0002 passed because it costs validators years from now. SGP-0003 failed because it would have cost them immediately.
This is a first-principles point: **Solana's governance isn't voting on "what's good for SOL holders." It's voting on what's tolerable for the entities who hold enough stake to vote at all.** Those aren't automatically the same group.
THE CONTRADICTION
If disinflation is genuinely bullish and validators are rational long-term holders, they should have supported *both* proposals — deeper burns plus slower issuance is a stronger deflationary combination than either alone. They didn't. The market narrative ("Solana just got more bullish tokenomics") is true only for one-third of what was actually proposed.
THE COUNTER-THESIS
It's possible the rejection of SGP-0003 had nothing to do with validator self-interest and everything to do with legitimate technical concerns — unpredictable fee-burn ranges (7,500–9,000 SOL/day is a wide band) could introduce network-fee volatility that harms user experience, not just validator revenue. Solana Labs itself reportedly opposed both proposals initially, which cuts against a pure "validators protecting their own income" reading. The simpler explanation may be: SGP-0003 was a less mature proposal, not a self-interested veto.
I can't fully separate these two explanations with the evidence available. Both are plausible. This is a case where I don't have enough to call it.
WHAT WOULD CONFIRM IT
- On-chain issuance data over the next several epochs showing the disinflation schedule is actually being implemented (SIGNAL, not yet observed).
- A future fee-related proposal, redesigned with a narrower or delayed burn range, gaining validator support — which would suggest the *design*, not the incentive, was the real obstacle.
- Validator staking yields declining roughly in line with model projections, without a validator exodus.
WHAT WOULD KILL IT
- If validator count or total stake participation drops materially after implementation, it would suggest disinflation was tolerated on paper but is destabilizing network security in practice — turning a "less dilution" story into a "weaker security budget" story.
- If a near-identical fee-burn proposal resurfaces with *validator-friendly* terms and still fails, that would support the self-interest thesis harder. If it passes, that undermines it.
THE INCENTIVES
FACT: SIMD-0550 was authored by Helius, an infrastructure firm — not Solana Labs, which reportedly opposed the disinflation change.
INTERPRETATION: Helius's business model benefits from a healthier long-term SOL valuation narrative more than from validator fee income, which may explain why an infrastructure company pushed harder on this than the validators who ultimately had to approve it.
THE PROBABILITY
This is a moderate-confidence thesis, not a strong one. The vote-margin evidence (67.0 vs. 66.67, a literal one-validator swing) and the split outcome between two similarly-supported proposals are solid, verifiable facts. The *interpretation* — that validator self-interest explains the split — is plausible and consistent with the data, but unproven. Treat it as a working hypothesis, not a conclusion.
WHAT I'M WATCHING NEXT
Not SOL's price. Three specific things:
1. Whether on-chain issuance actually drops on schedule over the coming epochs.
2. Whether validator count/stake participation holds steady through the transition.
3. Whether a redesigned fee-burn proposal returns — and whether its outcome supports or contradicts the incentive-based explanation above.
NFA. #ZeroResearch #Solana #SolanaGovernance #Tokenomics
$SOL
That's not a data error. That's the story.
Solana just doubled its disinflation rate through SGP-0002 (built on the technical proposal SIMD-0550), cutting future SOL issuance by an estimated 18.9 million tokens over six years. The obvious question — "is this bullish for SOL?" — is the wrong one to start with. The real question is: **why did the network's stakeholders agree to slow issuance, but refuse, on the same day, to increase token burns?** Two proposals, similar support levels, opposite outcomes. Understanding that gap tells you more about Solana's actual power structure than the headline number does.
THE CONSENSUS
FACT: Crypto media and social sentiment treated SGP-0002's passage as unambiguously bullish — less new supply, faster path to Solana's 1.5% terminal inflation rate (2029 instead of 2032). The framing across timelines was simple: less dilution → stronger long-term price case.
WHAT CHANGED
TIMELINE (FACT):
1. Aug 21— Solana activates the first phase of slot-time reduction (400ms → 350ms) under SIMD-0525, unrelated but concurrent network change.
2. Aug 23–24 — Voting opens on three bundled proposals: SGP-0001 (Constitution), SGP-0002 (Double Disinflation), SGP-0003 (Fee Restructuring).
3. Aug 27, end of epoch 1023 — One published account (CryptoBriefing) reports SGP-0002 and SGP-0003 both failing to clear the 66.67% supermajority.
4. Aug 28— Multiple later reports (Decrypt, Forklog, Cointelegraph) confirm SGP-0002 passed at exactly 67.0%, with Kraken switching its vote from "against" to "for" late in the count.
SIGNAL: The discrepancy between the Aug 27 and Aug 28 reports isn't sloppy journalism — it's a live record of a vote that was, at one point, genuinely failing.
THE HIDDEN STORY
INTERPRETATION: The two proposals hit different stakeholders differently. Disinflation reduces issuance growth — a slow-moving, years-long tapering that validators can plan around. The fee-burn proposal would have redirected a *direct, immediate* portion of validator revenue into burns instead of validator pockets. One is a gradual haircut. The other is a pay cut effective next epoch.
THESIS: Validators — who hold outsized voting weight because Solana's governance is stake-weighted, not one-token-one-vote in a retail sense — will support tokenomics changes that improve the asset's long-term image *as long as those changes don't directly reduce their own near-term income.* SGP-0002 passed because it costs validators years from now. SGP-0003 failed because it would have cost them immediately.
This is a first-principles point: **Solana's governance isn't voting on "what's good for SOL holders." It's voting on what's tolerable for the entities who hold enough stake to vote at all.** Those aren't automatically the same group.
THE CONTRADICTION
If disinflation is genuinely bullish and validators are rational long-term holders, they should have supported *both* proposals — deeper burns plus slower issuance is a stronger deflationary combination than either alone. They didn't. The market narrative ("Solana just got more bullish tokenomics") is true only for one-third of what was actually proposed.
THE COUNTER-THESIS
It's possible the rejection of SGP-0003 had nothing to do with validator self-interest and everything to do with legitimate technical concerns — unpredictable fee-burn ranges (7,500–9,000 SOL/day is a wide band) could introduce network-fee volatility that harms user experience, not just validator revenue. Solana Labs itself reportedly opposed both proposals initially, which cuts against a pure "validators protecting their own income" reading. The simpler explanation may be: SGP-0003 was a less mature proposal, not a self-interested veto.
I can't fully separate these two explanations with the evidence available. Both are plausible. This is a case where I don't have enough to call it.
WHAT WOULD CONFIRM IT
- On-chain issuance data over the next several epochs showing the disinflation schedule is actually being implemented (SIGNAL, not yet observed).
- A future fee-related proposal, redesigned with a narrower or delayed burn range, gaining validator support — which would suggest the *design*, not the incentive, was the real obstacle.
- Validator staking yields declining roughly in line with model projections, without a validator exodus.
WHAT WOULD KILL IT
- If validator count or total stake participation drops materially after implementation, it would suggest disinflation was tolerated on paper but is destabilizing network security in practice — turning a "less dilution" story into a "weaker security budget" story.
- If a near-identical fee-burn proposal resurfaces with *validator-friendly* terms and still fails, that would support the self-interest thesis harder. If it passes, that undermines it.
THE INCENTIVES
FACT: SIMD-0550 was authored by Helius, an infrastructure firm — not Solana Labs, which reportedly opposed the disinflation change.
INTERPRETATION: Helius's business model benefits from a healthier long-term SOL valuation narrative more than from validator fee income, which may explain why an infrastructure company pushed harder on this than the validators who ultimately had to approve it.
THE PROBABILITY
This is a moderate-confidence thesis, not a strong one. The vote-margin evidence (67.0 vs. 66.67, a literal one-validator swing) and the split outcome between two similarly-supported proposals are solid, verifiable facts. The *interpretation* — that validator self-interest explains the split — is plausible and consistent with the data, but unproven. Treat it as a working hypothesis, not a conclusion.
WHAT I'M WATCHING NEXT
Not SOL's price. Three specific things:
1. Whether on-chain issuance actually drops on schedule over the coming epochs.
2. Whether validator count/stake participation holds steady through the transition.
3. Whether a redesigned fee-burn proposal returns — and whether its outcome supports or contradicts the incentive-based explanation above.
NFA. #ZeroResearch #Solana #SolanaGovernance #Tokenomics
$SOL
2
34

·
--
FLOP Labs 刚刚更新了代币经济模型,把长期参数定得更清晰了。
关键变化:
- 第 10 年总供应量约 181 亿枚,较此前小幅上调
- 长期年通胀率降至 0.5%,节奏更平缓
- 矿工 48.6%,空投 24.3%,团队与基金会 10.8%,验证者 6.5%,Brokers/Agent 6.5%,质押奖励 3.2%
个人看,把通胀压到 0.5% 是偏友好的一侧,意味着长期流通盘扩张速度可预期;把接近半数份额给到矿工、四分之一给到空投,说明项目更愿意把早期筹码分散给社区而不是集中锁在团队手上。验证者+Broker/Agent 合计 13%,对生态激励也算合理配比。
当然,白皮书归白皮书,最终还得看链上释放节奏、质押锁仓曲线和后续开发者路线图能不能兑现。建议关注官方推文和后续治理公告,别只盯着单次空投窗口。
#FLOP #Tokenomics
来源:https://x.com/flop_labs/status/2097945962455142649
FLOP Labs 刚刚更新了代币经济模型,把长期参数定得更清晰了。
关键变化:
- 第 10 年总供应量约 181 亿枚,较此前小幅上调
- 长期年通胀率降至 0.5%,节奏更平缓
- 矿工 48.6%,空投 24.3%,团队与基金会 10.8%,验证者 6.5%,Brokers/Agent 6.5%,质押奖励 3.2%
个人看,把通胀压到 0.5% 是偏友好的一侧,意味着长期流通盘扩张速度可预期;把接近半数份额给到矿工、四分之一给到空投,说明项目更愿意把早期筹码分散给社区而不是集中锁在团队手上。验证者+Broker/Agent 合计 13%,对生态激励也算合理配比。
当然,白皮书归白皮书,最终还得看链上释放节奏、质押锁仓曲线和后续开发者路线图能不能兑现。建议关注官方推文和后续治理公告,别只盯着单次空投窗口。
#FLOP #Tokenomics
来源:https://x.com/flop_labs/status/2097945962455142649
关键变化:
- 第 10 年总供应量约 181 亿枚,较此前小幅上调
- 长期年通胀率降至 0.5%,节奏更平缓
- 矿工 48.6%,空投 24.3%,团队与基金会 10.8%,验证者 6.5%,Brokers/Agent 6.5%,质押奖励 3.2%
个人看,把通胀压到 0.5% 是偏友好的一侧,意味着长期流通盘扩张速度可预期;把接近半数份额给到矿工、四分之一给到空投,说明项目更愿意把早期筹码分散给社区而不是集中锁在团队手上。验证者+Broker/Agent 合计 13%,对生态激励也算合理配比。
当然,白皮书归白皮书,最终还得看链上释放节奏、质押锁仓曲线和后续开发者路线图能不能兑现。建议关注官方推文和后续治理公告,别只盯着单次空投窗口。
#FLOP #Tokenomics
来源:https://x.com/flop_labs/status/2097945962455142649

·
--
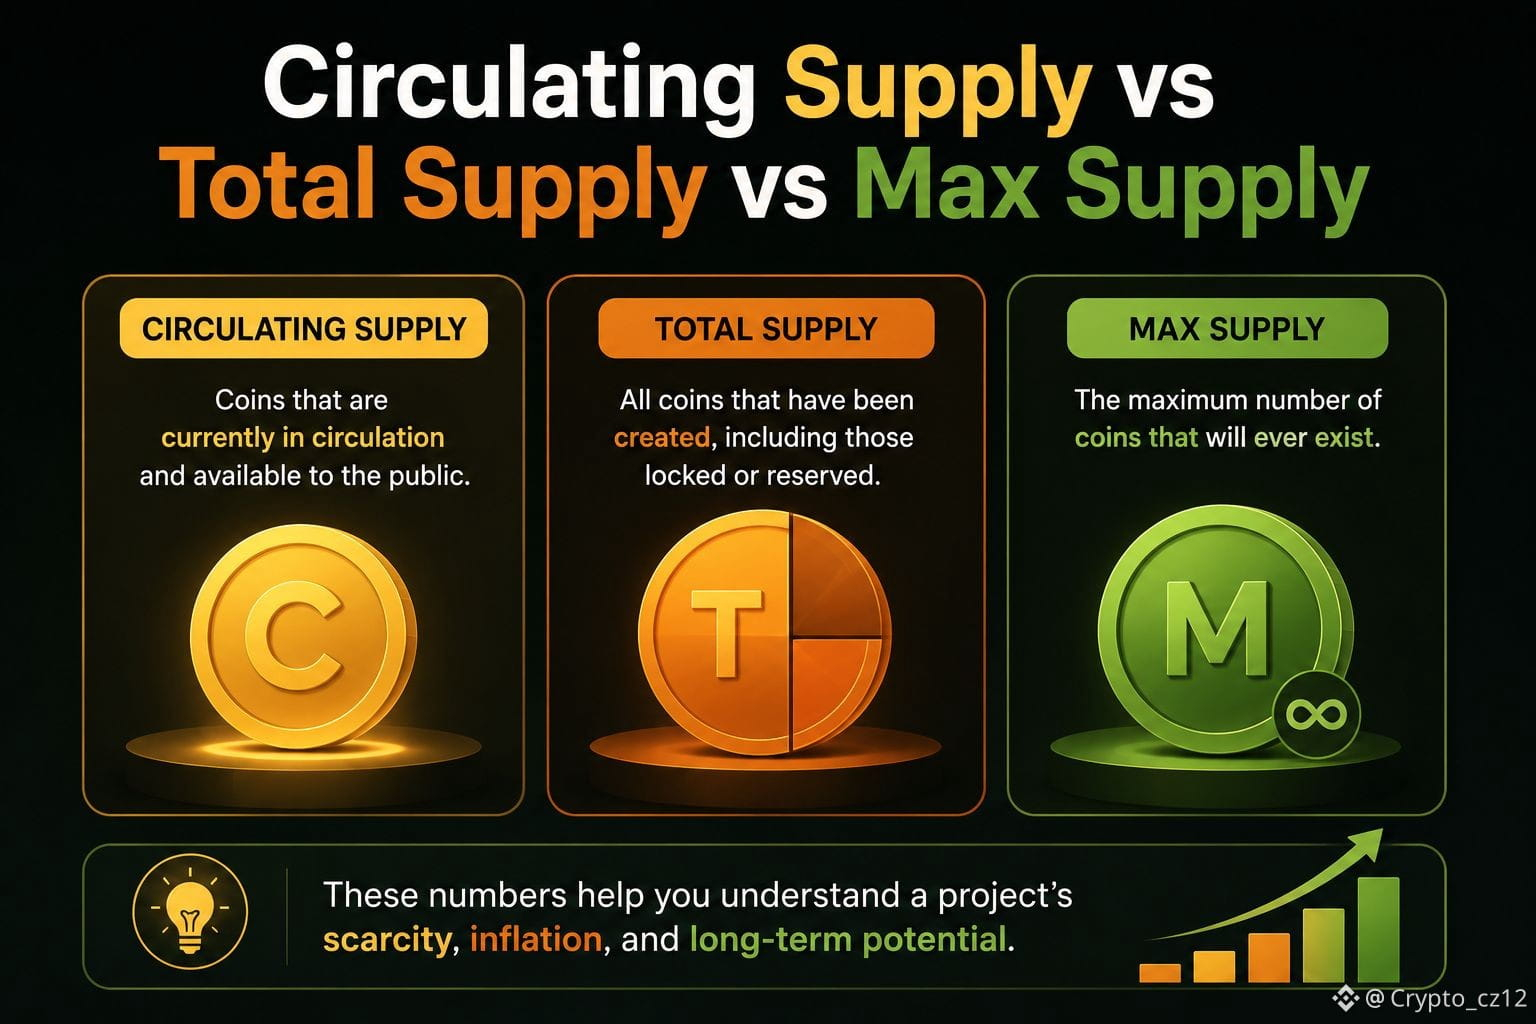
Circulating Supply vs Total Supply vs Max Supply
Definitions with real examples: BTC's hard 21M cap, tokens with no max supply, tokens with large locked supply
#Tokenomics #CryptoEducation
$BTC $USDT $ETH
{future}(ETHUSDT)
{future}(BTCUSDT)
Circulating Supply vs Total Supply vs Max Supply
Definitions with real examples: BTC's hard 21M cap, tokens with no max supply, tokens with large locked supply
#Tokenomics #CryptoEducation
$BTC $USDT $ETH
Definitions with real examples: BTC's hard 21M cap, tokens with no max supply, tokens with large locked supply
#Tokenomics #CryptoEducation
$BTC $USDT $ETH
64

·
--
Burning Tokens Doesn't Automatically Make Them Worth More — Here's the Actual MathEveryone loves a burn announcement. Fewer people check whether the burn is actually shrinking supply on net, or whether something else is filling the hole right behind it.
Across a large event study, token burns showed an average +5.8% abnormal return over a 40-day window — real, but conditional. The effect scales with the size of the burn relative to the asset, and it weakens the bigger the market cap gets. That's the headline. The friction points underneath it are what actually decide whether a specific burn matters.
Friction #1: Dilution can quietly cancel the burn. Pump.fun burned $442.6M of $PUMP in 2026, sounds decisive. But in July alone, it unlocked $86.5M to team and investor wallets — a big chunk of that deflation neutralized before it ever showed up net. Aster is stuck in the same trap: aggressive daily burns, but insider unlocks keep outweighing them, and price stays depressed anyway. A burn program only shrinks supply if it out-paces minting, unlocking, and operational dilution combined.
Friction #2: Burns create a bid, not demand. Buybacks manufacture temporary buying pressure — they don't manufacture a reason for new users to show up. Jupiter spent $14M buying back JUP; price still fell 55% for the year. Chainlink built institutional-grade buyback infrastructure; LINK still dropped roughly 50%. THORChain routes revenue straight into buybacks; RUNE still got cut in half in the broader drawdown. If the underlying network isn't growing demand, a burn just slows the bleeding — it doesn't reverse it.
Friction #3: Size matters more than the sticker headline. Before crediting any burn narrative, three questions actually separate signal from noise: Is the funding source sustainable protocol revenue, or a temporary fee spike that dies in a quiet market? Is the dollar amount actually material against the token's FDV and daily volume? And critically — what's the real ratio between what's burned and what's simultaneously unlocked or emitted?
$HYPE clears all three: $945M in trailing fees, a burn mechanically tied to real trading volume, and minimal offsetting dilution — which is exactly why it decoupled and rallied 70% while the rest of the sector chopped sideways. Uniswap's fee-switch activation, backed by roughly $600M in annual organic fees, converted UNI from a purely speculative governance token into something closer to a cash-flow-linked asset.
The pattern across every case here is consistent: a burn is a supply mechanic, not a demand mechanic. It can amplify real growth. It cannot manufacture growth that isn't there.
So next time a project announces a burn — are you checking the burn number, or the unlock schedule sitting quietly next to it?
{future}(HYPEUSDT)
#TokenBurn #Tokenomics
Burning Tokens Doesn't Automatically Make Them Worth More — Here's the Actual Math
Everyone loves a burn announcement. Fewer people check whether the burn is actually shrinking supply on net, or whether something else is filling the hole right behind it.
Across a large event study, token burns showed an average +5.8% abnormal return over a 40-day window — real, but conditional. The effect scales with the size of the burn relative to the asset, and it weakens the bigger the market cap gets. That's the headline. The friction points underneath it are what actually decide whether a specific burn matters.
Friction #1: Dilution can quietly cancel the burn. Pump.fun burned $442.6M of $PUMP in 2026, sounds decisive. But in July alone, it unlocked $86.5M to team and investor wallets — a big chunk of that deflation neutralized before it ever showed up net. Aster is stuck in the same trap: aggressive daily burns, but insider unlocks keep outweighing them, and price stays depressed anyway. A burn program only shrinks supply if it out-paces minting, unlocking, and operational dilution combined.
Friction #2: Burns create a bid, not demand. Buybacks manufacture temporary buying pressure — they don't manufacture a reason for new users to show up. Jupiter spent $14M buying back JUP; price still fell 55% for the year. Chainlink built institutional-grade buyback infrastructure; LINK still dropped roughly 50%. THORChain routes revenue straight into buybacks; RUNE still got cut in half in the broader drawdown. If the underlying network isn't growing demand, a burn just slows the bleeding — it doesn't reverse it.
Friction #3: Size matters more than the sticker headline. Before crediting any burn narrative, three questions actually separate signal from noise: Is the funding source sustainable protocol revenue, or a temporary fee spike that dies in a quiet market? Is the dollar amount actually material against the token's FDV and daily volume? And critically — what's the real ratio between what's burned and what's simultaneously unlocked or emitted?
$HYPE clears all three: $945M in trailing fees, a burn mechanically tied to real trading volume, and minimal offsetting dilution — which is exactly why it decoupled and rallied 70% while the rest of the sector chopped sideways. Uniswap's fee-switch activation, backed by roughly $600M in annual organic fees, converted UNI from a purely speculative governance token into something closer to a cash-flow-linked asset.
The pattern across every case here is consistent: a burn is a supply mechanic, not a demand mechanic. It can amplify real growth. It cannot manufacture growth that isn't there.
So next time a project announces a burn — are you checking the burn number, or the unlock schedule sitting quietly next to it?
#TokenBurn #Tokenomics
Across a large event study, token burns showed an average +5.8% abnormal return over a 40-day window — real, but conditional. The effect scales with the size of the burn relative to the asset, and it weakens the bigger the market cap gets. That's the headline. The friction points underneath it are what actually decide whether a specific burn matters.
Friction #1: Dilution can quietly cancel the burn. Pump.fun burned $442.6M of $PUMP in 2026, sounds decisive. But in July alone, it unlocked $86.5M to team and investor wallets — a big chunk of that deflation neutralized before it ever showed up net. Aster is stuck in the same trap: aggressive daily burns, but insider unlocks keep outweighing them, and price stays depressed anyway. A burn program only shrinks supply if it out-paces minting, unlocking, and operational dilution combined.
Friction #2: Burns create a bid, not demand. Buybacks manufacture temporary buying pressure — they don't manufacture a reason for new users to show up. Jupiter spent $14M buying back JUP; price still fell 55% for the year. Chainlink built institutional-grade buyback infrastructure; LINK still dropped roughly 50%. THORChain routes revenue straight into buybacks; RUNE still got cut in half in the broader drawdown. If the underlying network isn't growing demand, a burn just slows the bleeding — it doesn't reverse it.
Friction #3: Size matters more than the sticker headline. Before crediting any burn narrative, three questions actually separate signal from noise: Is the funding source sustainable protocol revenue, or a temporary fee spike that dies in a quiet market? Is the dollar amount actually material against the token's FDV and daily volume? And critically — what's the real ratio between what's burned and what's simultaneously unlocked or emitted?
$HYPE clears all three: $945M in trailing fees, a burn mechanically tied to real trading volume, and minimal offsetting dilution — which is exactly why it decoupled and rallied 70% while the rest of the sector chopped sideways. Uniswap's fee-switch activation, backed by roughly $600M in annual organic fees, converted UNI from a purely speculative governance token into something closer to a cash-flow-linked asset.
The pattern across every case here is consistent: a burn is a supply mechanic, not a demand mechanic. It can amplify real growth. It cannot manufacture growth that isn't there.
So next time a project announces a burn — are you checking the burn number, or the unlock schedule sitting quietly next to it?
#TokenBurn #Tokenomics
1
280
·
--
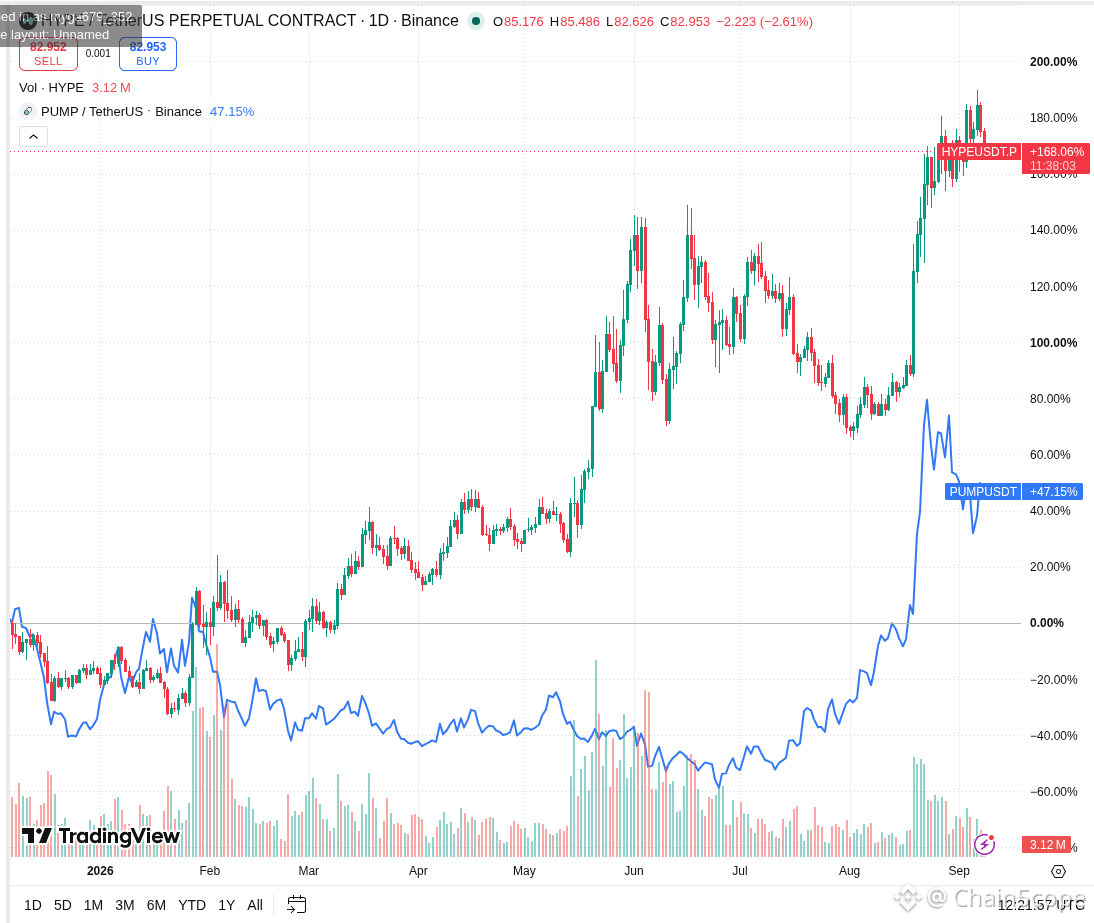
Two protocols are burning tokens like crazy right now. One rallied 70% to new highs. The other's price upside is capped. Same mechanism, opposite outcomes.
Hyperliquid routes 99% of trading fees into buybacks — $1.2B retired since launch, 4.6% of initial supply gone, and $HYPE decoupled entirely from a down-trending altcoin market. Pump.fun burned $442.6M, cutting 16.3% of circulating supply — real money, real burn. But it also unlocked $86.5M to team and investor wallets in July alone, quietly offsetting a huge chunk of that deflation. Net supply reduction is what actually matters, not the burn headline.
Bias: burns backed by real, growing fee revenue with minimal unlock overhang (like HYPE's) carry more price signal than burns fighting against dilution (like $PUMP 's). Before crediting any burn with a rally — is the unlock schedule actually smaller than the burn, or just quieter? #TokenBurn #Tokenomics
Two protocols are burning tokens like crazy right now. One rallied 70% to new highs. The other's price upside is capped. Same mechanism, opposite outcomes.
Hyperliquid routes 99% of trading fees into buybacks — $1.2B retired since launch, 4.6% of initial supply gone, and $HYPE decoupled entirely from a down-trending altcoin market. Pump.fun burned $442.6M, cutting 16.3% of circulating supply — real money, real burn. But it also unlocked $86.5M to team and investor wallets in July alone, quietly offsetting a huge chunk of that deflation. Net supply reduction is what actually matters, not the burn headline.
Bias: burns backed by real, growing fee revenue with minimal unlock overhang (like HYPE's) carry more price signal than burns fighting against dilution (like $PUMP 's). Before crediting any burn with a rally — is the unlock schedule actually smaller than the burn, or just quieter? #TokenBurn #Tokenomics
Hyperliquid routes 99% of trading fees into buybacks — $1.2B retired since launch, 4.6% of initial supply gone, and $HYPE decoupled entirely from a down-trending altcoin market. Pump.fun burned $442.6M, cutting 16.3% of circulating supply — real money, real burn. But it also unlocked $86.5M to team and investor wallets in July alone, quietly offsetting a huge chunk of that deflation. Net supply reduction is what actually matters, not the burn headline.
Bias: burns backed by real, growing fee revenue with minimal unlock overhang (like HYPE's) carry more price signal than burns fighting against dilution (like $PUMP 's). Before crediting any burn with a rally — is the unlock schedule actually smaller than the burn, or just quieter? #TokenBurn #Tokenomics
1
170

·
--
🚨 $LAPTOP UNVEILS UNIQUE GAMIFIED SUPPLY BURN DYNAMICS AHEAD OF TOKEN LAUNCH! 🦈
The upcoming launch of $LAPTOP introduces an intriguing game-theory model, setting initial circulating supply at 350 million tokens with a 36-month vesting curve for the remainder. 📊 What catches the eye structurally is the allocation tied directly to 30 Polymarket prediction outcomes.
With 30% of total supply subject to binary settlement mechanics—where YES outcomes trigger permanent token burns and NO outcomes transfer to charity—the market faces a dynamic supply contraction vector. 💡 This setup creates an unusual programmatic order-flow incentive structure rarely seen in speculative asset launches. 💬 How do you see this Polymarket burn mechanism impacting initial liquidity depth? 👇
⚠️ Not financial advice. Always manage your risk. 🛡️
🏷️ #LAPTOP #Tokenomics #Polymarket #CryptoNews
🎯 🦈
🚨 $LAPTOP UNVEILS UNIQUE GAMIFIED SUPPLY BURN DYNAMICS AHEAD OF TOKEN LAUNCH! 🦈
The upcoming launch of $LAPTOP introduces an intriguing game-theory model, setting initial circulating supply at 350 million tokens with a 36-month vesting curve for the remainder. 📊 What catches the eye structurally is the allocation tied directly to 30 Polymarket prediction outcomes.
With 30% of total supply subject to binary settlement mechanics—where YES outcomes trigger permanent token burns and NO outcomes transfer to charity—the market faces a dynamic supply contraction vector. 💡 This setup creates an unusual programmatic order-flow incentive structure rarely seen in speculative asset launches. 💬 How do you see this Polymarket burn mechanism impacting initial liquidity depth? 👇
⚠️ Not financial advice. Always manage your risk. 🛡️
🏷️ #LAPTOP #Tokenomics #Polymarket #CryptoNews
🎯 🦈
The upcoming launch of $LAPTOP introduces an intriguing game-theory model, setting initial circulating supply at 350 million tokens with a 36-month vesting curve for the remainder. 📊 What catches the eye structurally is the allocation tied directly to 30 Polymarket prediction outcomes.
With 30% of total supply subject to binary settlement mechanics—where YES outcomes trigger permanent token burns and NO outcomes transfer to charity—the market faces a dynamic supply contraction vector. 💡 This setup creates an unusual programmatic order-flow incentive structure rarely seen in speculative asset launches. 💬 How do you see this Polymarket burn mechanism impacting initial liquidity depth? 👇
⚠️ Not financial advice. Always manage your risk. 🛡️
🏷️ #LAPTOP #Tokenomics #Polymarket #CryptoNews
🎯 🦈
14

·
--
CRYPTO PROJECTS HAVE SPENT $638M ON TOKEN BUYBACKS IN 2026
Crypto projects have reportedly spent a record $638 million repurchasing their own tokens so far this year.
🔥 The biggest surprise?
Hyperliquid ($HYPE ) and Pump.fun ($PUMP ) account for nearly 90% of total buybacks, highlighting how concentrated this trend has become.
📊 Why it matters:
🔹 Revenue-funded buybacks can create consistent market demand
🔹 Repurchased tokens may reduce circulating supply if burned
🔹 Token value becomes increasingly connected to real protocol revenue
🔹 Crypto tokenomics are beginning to resemble corporate share buybacks
⚠️ However, buybacks are not automatically bullish. Their long-term impact depends on whether the protocol can continue generating sustainable revenue.
👀 A new narrative may be emerging: cash-flow-backed tokens over purely speculative tokenomics.
#Hyperliquid #Tokenomics #DEFİ #SideSwapSuspendsLiquidServices
CRYPTO PROJECTS HAVE SPENT $638M ON TOKEN BUYBACKS IN 2026
Crypto projects have reportedly spent a record $638 million repurchasing their own tokens so far this year.
🔥 The biggest surprise?
Hyperliquid ($HYPE ) and Pump.fun ($PUMP ) account for nearly 90% of total buybacks, highlighting how concentrated this trend has become.
📊 Why it matters:
🔹 Revenue-funded buybacks can create consistent market demand
🔹 Repurchased tokens may reduce circulating supply if burned
🔹 Token value becomes increasingly connected to real protocol revenue
🔹 Crypto tokenomics are beginning to resemble corporate share buybacks
⚠️ However, buybacks are not automatically bullish. Their long-term impact depends on whether the protocol can continue generating sustainable revenue.
👀 A new narrative may be emerging: cash-flow-backed tokens over purely speculative tokenomics.
#Hyperliquid #Tokenomics #DEFİ #SideSwapSuspendsLiquidServices
Crypto projects have reportedly spent a record $638 million repurchasing their own tokens so far this year.
🔥 The biggest surprise?
Hyperliquid ($HYPE ) and Pump.fun ($PUMP ) account for nearly 90% of total buybacks, highlighting how concentrated this trend has become.
📊 Why it matters:
🔹 Revenue-funded buybacks can create consistent market demand
🔹 Repurchased tokens may reduce circulating supply if burned
🔹 Token value becomes increasingly connected to real protocol revenue
🔹 Crypto tokenomics are beginning to resemble corporate share buybacks
⚠️ However, buybacks are not automatically bullish. Their long-term impact depends on whether the protocol can continue generating sustainable revenue.
👀 A new narrative may be emerging: cash-flow-backed tokens over purely speculative tokenomics.
#Hyperliquid #Tokenomics #DEFİ #SideSwapSuspendsLiquidServices
110
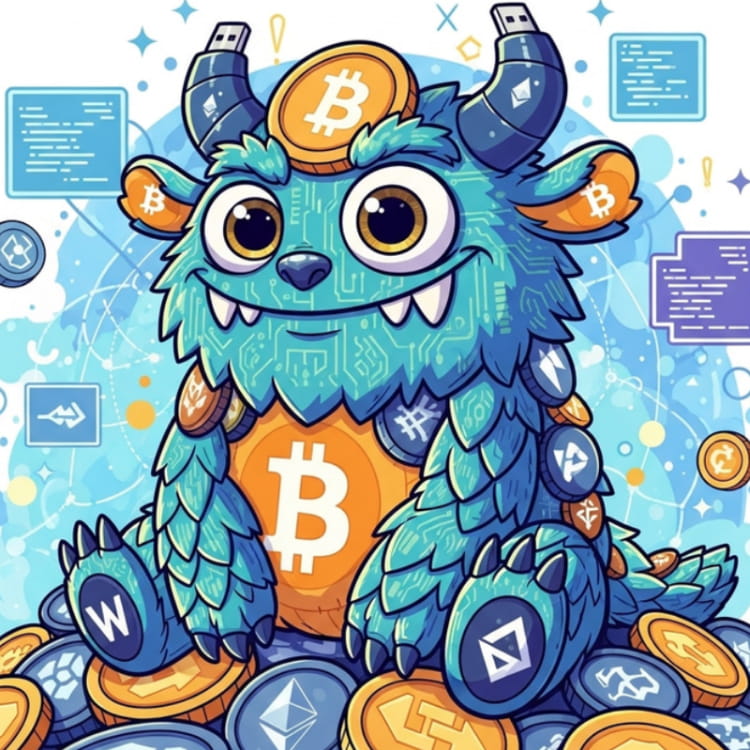
🔥 HYPE Buybacks Are A Story Worth Watching
Hyperliquid is one of the most interesting examples of the current token-buyback trend.
Reports say Hyperliquid has been using protocol revenue to buy back HYPE, while its activity represents a huge portion of crypto's 2026 buyback activity.
What I find interesting isn't simply the buyback.
It's the revenue → buyback → tokenomics connection.
That's a much more interesting model than:
“Price is going up because everyone is buying.”
Still, no tokenomics model is magic.
The protocol needs sustainable demand and real usage.
Revenue matters. Hype alone doesn't.
#HYPE #Hyperliquid #DeFi #Crypto #Tokenomics
🔥 HYPE Buybacks Are A Story Worth Watching
Hyperliquid is one of the most interesting examples of the current token-buyback trend.
Reports say Hyperliquid has been using protocol revenue to buy back HYPE, while its activity represents a huge portion of crypto's 2026 buyback activity.
What I find interesting isn't simply the buyback.
It's the revenue → buyback → tokenomics connection.
That's a much more interesting model than:
“Price is going up because everyone is buying.”
Still, no tokenomics model is magic.
The protocol needs sustainable demand and real usage.
Revenue matters. Hype alone doesn't.
#HYPE #Hyperliquid #DeFi #Crypto #Tokenomics
Hyperliquid is one of the most interesting examples of the current token-buyback trend.
Reports say Hyperliquid has been using protocol revenue to buy back HYPE, while its activity represents a huge portion of crypto's 2026 buyback activity.
What I find interesting isn't simply the buyback.
It's the revenue → buyback → tokenomics connection.
That's a much more interesting model than:
“Price is going up because everyone is buying.”
Still, no tokenomics model is magic.
The protocol needs sustainable demand and real usage.
Revenue matters. Hype alone doesn't.
#HYPE #Hyperliquid #DeFi #Crypto #Tokenomics
1
127

·
--
Bullish
Verified
$ASTER Just Jumped 25% — Here's the Tokenomics Trick Behind It.
$ASTER surged 25% in 18 hours after a tokenomics overhaul — a 12-month cliff extension plus 99% of platform fees redirected into buybacks and burns. A supply-mechanics story, not just hype.
#asterix #Tokenomics #Market_Update
{spot}(ASTERUSDT)
$ASTER Just Jumped 25% — Here's the Tokenomics Trick Behind It.
$ASTER surged 25% in 18 hours after a tokenomics overhaul — a 12-month cliff extension plus 99% of platform fees redirected into buybacks and burns. A supply-mechanics story, not just hype.
#asterix #Tokenomics #Market_Update
$ASTER surged 25% in 18 hours after a tokenomics overhaul — a 12-month cliff extension plus 99% of platform fees redirected into buybacks and burns. A supply-mechanics story, not just hype.
#asterix #Tokenomics #Market_Update
6
2
1.1k

🚨 HYPERLIQUID ($HYPE) REVENUE & BUYBACK ANALYSIS! 🚨
Arete Capital Managing Partner McKenna highlighted an insightful breakdown regarding Hyperliquid's AQA v2 wallet models! 📊
Key Takeaways:
🔹 AQA v2 Wallet Balance: ~$6.21 Billion in USDC
🔹 Estimated Yield: ~3.10% (based on 30-day SOFR at ~3.65%)
🔹 Annualized Revenue: ~$193 Million/year (assuming 90% flows to Assistance Fund)
🔹 Daily Buyback Pressure: Estimated ~$527,000 PER DAY for $HYPE! 🔥
Note: These numbers are analyst estimates based on on-chain data and interest rates, not official disclosures. However, it shows a strong potential buyback mechanism for $HYPE!
How do you view $HYPE's long-term tokenomics? Let us know below! 👇
#Hyperliquid #hype #CryptoNewss #defi #Tokenomics
{future}(HYPEUSDT)
🚨 HYPERLIQUID ($HYPE) REVENUE & BUYBACK ANALYSIS! 🚨
Arete Capital Managing Partner McKenna highlighted an insightful breakdown regarding Hyperliquid's AQA v2 wallet models! 📊
Key Takeaways:
🔹 AQA v2 Wallet Balance: ~$6.21 Billion in USDC
🔹 Estimated Yield: ~3.10% (based on 30-day SOFR at ~3.65%)
🔹 Annualized Revenue: ~$193 Million/year (assuming 90% flows to Assistance Fund)
🔹 Daily Buyback Pressure: Estimated ~$527,000 PER DAY for $HYPE! 🔥
Note: These numbers are analyst estimates based on on-chain data and interest rates, not official disclosures. However, it shows a strong potential buyback mechanism for $HYPE!
How do you view $HYPE's long-term tokenomics? Let us know below! 👇
#Hyperliquid #hype #CryptoNewss #defi #Tokenomics
Arete Capital Managing Partner McKenna highlighted an insightful breakdown regarding Hyperliquid's AQA v2 wallet models! 📊
Key Takeaways:
🔹 AQA v2 Wallet Balance: ~$6.21 Billion in USDC
🔹 Estimated Yield: ~3.10% (based on 30-day SOFR at ~3.65%)
🔹 Annualized Revenue: ~$193 Million/year (assuming 90% flows to Assistance Fund)
🔹 Daily Buyback Pressure: Estimated ~$527,000 PER DAY for $HYPE! 🔥
Note: These numbers are analyst estimates based on on-chain data and interest rates, not official disclosures. However, it shows a strong potential buyback mechanism for $HYPE!
How do you view $HYPE's long-term tokenomics? Let us know below! 👇
#Hyperliquid #hype #CryptoNewss #defi #Tokenomics
126
·
--
Why is nobody talking about how FDV tricks traders into confusing a price tag with actual capital inflow?
Too many people see a $670M FDV and assume $670M has entered the token, then FOMO into $BTC, $ETH, or a new launch at the worst possible moment. That misunderstanding is how investors end up buying narratives instead of liquidity.
FDV is simply the theoretical value of every token at its current price, including tokens that are still locked, vested, or not circulating. It is not a record of money that has flowed into the market.
Before buying, check circulating market cap, unlock schedules, daily volume, and the percentage of supply already tradable. A token can show a $670M FDV while far less capital has actually changed hands, which makes future unlock pressure far more important than the headline number.
Are traders finally going to stop treating FDV as proof of demand?
#Crypto #Tokenomics #FDV
Why is nobody talking about how FDV tricks traders into confusing a price tag with actual capital inflow?
Too many people see a $670M FDV and assume $670M has entered the token, then FOMO into $BTC , $ETH , or a new launch at the worst possible moment. That misunderstanding is how investors end up buying narratives instead of liquidity.
FDV is simply the theoretical value of every token at its current price, including tokens that are still locked, vested, or not circulating. It is not a record of money that has flowed into the market.
Before buying, check circulating market cap, unlock schedules, daily volume, and the percentage of supply already tradable. A token can show a $670M FDV while far less capital has actually changed hands, which makes future unlock pressure far more important than the headline number.
Are traders finally going to stop treating FDV as proof of demand?
#Crypto #Tokenomics #FDV
Too many people see a $670M FDV and assume $670M has entered the token, then FOMO into $BTC , $ETH , or a new launch at the worst possible moment. That misunderstanding is how investors end up buying narratives instead of liquidity.
FDV is simply the theoretical value of every token at its current price, including tokens that are still locked, vested, or not circulating. It is not a record of money that has flowed into the market.
Before buying, check circulating market cap, unlock schedules, daily volume, and the percentage of supply already tradable. A token can show a $670M FDV while far less capital has actually changed hands, which makes future unlock pressure far more important than the headline number.
Are traders finally going to stop treating FDV as proof of demand?
#Crypto #Tokenomics #FDV
6

·
--
Everyone thinks a $670M FDV means $670M poured into a token, but actually that number is only a theoretical valuation.
That misunderstanding can make traders chase inflated launches, buy from FOMO, and get trapped when locked tokens enter circulation.
1. FDV multiplies the current token price by the entire supply, including tokens that are still locked. Think of it like pricing every apartment in a building based on the last unit sold.
2. A $670M FDV does not mean buyers invested $670M. Actual liquidity and market cap may be far smaller, so even modest selling can move the price sharply.
3. Before buying $ETH, $SOL, or any new token, compare FDV with circulating market cap and check the unlock schedule. A large gap can signal future dilution, like adding more slices to the same pizza.
What’s your take on using FDV to evaluate a token?
#CryptoEducation #Tokenomics #CryptoTrading
Everyone thinks a $670M FDV means $670M poured into a token, but actually that number is only a theoretical valuation.
That misunderstanding can make traders chase inflated launches, buy from FOMO, and get trapped when locked tokens enter circulation.
1. FDV multiplies the current token price by the entire supply, including tokens that are still locked. Think of it like pricing every apartment in a building based on the last unit sold.
2. A $670M FDV does not mean buyers invested $670M. Actual liquidity and market cap may be far smaller, so even modest selling can move the price sharply.
3. Before buying $ETH , $SOL , or any new token, compare FDV with circulating market cap and check the unlock schedule. A large gap can signal future dilution, like adding more slices to the same pizza.
What’s your take on using FDV to evaluate a token?
#CryptoEducation #Tokenomics #CryptoTrading
That misunderstanding can make traders chase inflated launches, buy from FOMO, and get trapped when locked tokens enter circulation.
1. FDV multiplies the current token price by the entire supply, including tokens that are still locked. Think of it like pricing every apartment in a building based on the last unit sold.
2. A $670M FDV does not mean buyers invested $670M. Actual liquidity and market cap may be far smaller, so even modest selling can move the price sharply.
3. Before buying $ETH , $SOL , or any new token, compare FDV with circulating market cap and check the unlock schedule. A large gap can signal future dilution, like adding more slices to the same pizza.
What’s your take on using FDV to evaluate a token?
#CryptoEducation #Tokenomics #CryptoTrading
19

If you're still treating a token's FDV like actual capital that has already flowed in, stop now.
This mistake cost traders millions last cycle as they bought into the illusion of size and got dumped on during unlocks.
FDV represents the theoretical value of the entire token supply at the current price. It does not mean $670M has flowed into the token.
I remember the same confusion hitting $SOL holders early on compared to how people valued $ETH in its first years. It repeated with $DOGE when the numbers looked massive but most supply was still sitting idle.
The real story is always in the circulating supply and actual liquidity, not the hypothetical fully diluted number.
Where do you think this FDV confusion goes from here in the next wave of launches?
#Crypto #Tokenomics #FDV
If you're still treating a token's FDV like actual capital that has already flowed in, stop now.
This mistake cost traders millions last cycle as they bought into the illusion of size and got dumped on during unlocks.
FDV represents the theoretical value of the entire token supply at the current price. It does not mean $670M has flowed into the token.
I remember the same confusion hitting $SOL holders early on compared to how people valued $ETH in its first years. It repeated with $DOGE when the numbers looked massive but most supply was still sitting idle.
The real story is always in the circulating supply and actual liquidity, not the hypothetical fully diluted number.
Where do you think this FDV confusion goes from here in the next wave of launches?
#Crypto #Tokenomics #FDV
This mistake cost traders millions last cycle as they bought into the illusion of size and got dumped on during unlocks.
FDV represents the theoretical value of the entire token supply at the current price. It does not mean $670M has flowed into the token.
I remember the same confusion hitting $SOL holders early on compared to how people valued $ETH in its first years. It repeated with $DOGE when the numbers looked massive but most supply was still sitting idle.
The real story is always in the circulating supply and actual liquidity, not the hypothetical fully diluted number.
Where do you think this FDV confusion goes from here in the next wave of launches?
#Crypto #Tokenomics #FDV
34

Here's what happened when a new token showed a $670M FDV last week and the timeline exploded with people calling it the next big thing.
Traders jumped in thinking serious money had already committed, only to watch their bags get wrecked when the actual circulating value turned out to be tiny. It's the same trap that keeps catching people who don't look past the headline number.
FDV simply takes the current price and multiplies it by every token that will ever exist. It is a theoretical number, not proof that $670 million has actually flowed into the project. Plenty of launches in past cycles looked enormous on paper for the same reason, yet most of that supply was locked or not even minted.
Think about how $ETH, $SOL and $BNB trade with valuations that actually reflect tokens already in circulation. Newer tokens often float a massive FDV while only a sliver is trading, which is why the chart can collapse the moment early holders start selling. The comparison to older, more mature projects is pretty clear once you start checking the real numbers instead of the fully diluted headline.
Anyone else seeing this pattern repeat with the latest launches?
#Crypto #Tokenomics #FDV
Here's what happened when a new token showed a $670M FDV last week and the timeline exploded with people calling it the next big thing.
Traders jumped in thinking serious money had already committed, only to watch their bags get wrecked when the actual circulating value turned out to be tiny. It's the same trap that keeps catching people who don't look past the headline number.
FDV simply takes the current price and multiplies it by every token that will ever exist. It is a theoretical number, not proof that $670 million has actually flowed into the project. Plenty of launches in past cycles looked enormous on paper for the same reason, yet most of that supply was locked or not even minted.
Think about how $ETH , $SOL and $BNB trade with valuations that actually reflect tokens already in circulation. Newer tokens often float a massive FDV while only a sliver is trading, which is why the chart can collapse the moment early holders start selling. The comparison to older, more mature projects is pretty clear once you start checking the real numbers instead of the fully diluted headline.
Anyone else seeing this pattern repeat with the latest launches?
#Crypto #Tokenomics #FDV
Traders jumped in thinking serious money had already committed, only to watch their bags get wrecked when the actual circulating value turned out to be tiny. It's the same trap that keeps catching people who don't look past the headline number.
FDV simply takes the current price and multiplies it by every token that will ever exist. It is a theoretical number, not proof that $670 million has actually flowed into the project. Plenty of launches in past cycles looked enormous on paper for the same reason, yet most of that supply was locked or not even minted.
Think about how $ETH , $SOL and $BNB trade with valuations that actually reflect tokens already in circulation. Newer tokens often float a massive FDV while only a sliver is trading, which is why the chart can collapse the moment early holders start selling. The comparison to older, more mature projects is pretty clear once you start checking the real numbers instead of the fully diluted headline.
Anyone else seeing this pattern repeat with the latest launches?
#Crypto #Tokenomics #FDV
36

·
--
Picture this: a token trades at $0.95 while both its reported market cap and fully diluted valuation sit near $670 million.
For traders chasing a fresh $PONS move, the price can look deceptively accessible. But a sub-$1 token is not automatically cheap, and focusing on unit price alone can turn FOMO into an expensive mistake.
The key signal is valuation. At roughly $670 million in market cap and $670 million in FDV, $PONS appears to have little gap between circulating and fully diluted supply, potentially reducing future unlock pressure compared with low-float launches.
That does not remove the downside. A $670 million valuation already prices in substantial expectations, so weak liquidity, concentrated ownership, or fading demand could lead to sharp losses. Compare the valuation and market structure with assets like $BTC and $ETH before treating $0.95 as a bargain.
What risk do you think traders are overlooking here?
#PONS #CryptoRisk #Tokenomics
Picture this: a token trades at $0.95 while both its reported market cap and fully diluted valuation sit near $670 million.
For traders chasing a fresh $PONS move, the price can look deceptively accessible. But a sub-$1 token is not automatically cheap, and focusing on unit price alone can turn FOMO into an expensive mistake.
The key signal is valuation. At roughly $670 million in market cap and $670 million in FDV, $PONS appears to have little gap between circulating and fully diluted supply, potentially reducing future unlock pressure compared with low-float launches.
That does not remove the downside. A $670 million valuation already prices in substantial expectations, so weak liquidity, concentrated ownership, or fading demand could lead to sharp losses. Compare the valuation and market structure with assets like $BTC and $ETH before treating $0.95 as a bargain.
What risk do you think traders are overlooking here?
#PONS #CryptoRisk #Tokenomics
For traders chasing a fresh $PONS move, the price can look deceptively accessible. But a sub-$1 token is not automatically cheap, and focusing on unit price alone can turn FOMO into an expensive mistake.
The key signal is valuation. At roughly $670 million in market cap and $670 million in FDV, $PONS appears to have little gap between circulating and fully diluted supply, potentially reducing future unlock pressure compared with low-float launches.
That does not remove the downside. A $670 million valuation already prices in substantial expectations, so weak liquidity, concentrated ownership, or fading demand could lead to sharp losses. Compare the valuation and market structure with assets like $BTC and $ETH before treating $0.95 as a bargain.
What risk do you think traders are overlooking here?
#PONS #CryptoRisk #Tokenomics
23

·
--
Altcoins aren't "cheaper Bitcoin" — they serve fundamentally different functions.
KEY TAKEAWAY
Altcoin value comes from utility, not price. Five functional categories drive real demand: smart-contract platforms, DeFi primitives, infrastructure, scaling, and app-specific tokens.
EVIDENCE
1. Smart-contract platforms (ETH, SOL, AVAX): Execute code, settle assets — compute layer revenue from gas fees, staking yield, deployment activity
2. DeFi primitives (UNI, AAVE, CRV): Financial infrastructure — protocol fees, TVL growth, governance revenue
3. Infrastructure (LINK, GRT, AR): Oracles, indexing, storage — usage fees from dApps, query volume, data demand
4. Scaling (ARB, OP, MATIC): Throughput solutions — transaction fees, bridged TVL, developer activity
5. App-specific (RENDER, FET, AKT): Niche compute/markets — service revenue, network utilization, token burn/buyback
ANALYSIS
Most altcoins trend toward zero vs BTC over time. Separating signal from noise requires:
- Real revenue/fees (not token inflation)
- Active developers + growing TVL/users
- Liquid markets on Binance (spot + perpetuals)
- Clear catalyst calendar (upgrades, unlocks, governance votes)
- Relative strength vs BTC (ETH/BTC, SOL/BTC charts)
SCENARIOS
Bullish: Alt sector shows broad relative strength vs BTC, TVL expanding, developer activity rising
Neutral: Selective rotation — only categories with revenue catalysts outperform
Bearish: Capital consolidates into BTC; alts bleed on low volume, failed catalysts
BINANCE ANGLE
Binance tools for alt research: Token X-Ray (profile/health/security), Market Breadth (participation), Sector Rotation (narrative heat), Funding Analysis (leverage positioning). Use these to filter tradable vs speculative.
CONCLUSION
Trade the trend, don't marry the bag. Value accrues to protocols with sustainable revenue, active users, and liquid markets — not to narratives alone.
Binance Angels
#Altcoins #Tokenomics #BinanceAngels
Altcoins aren't "cheaper Bitcoin" — they serve fundamentally different functions.
KEY TAKEAWAY
Altcoin value comes from utility, not price. Five functional categories drive real demand: smart-contract platforms, DeFi primitives, infrastructure, scaling, and app-specific tokens.
EVIDENCE
1. Smart-contract platforms (ETH, SOL, AVAX): Execute code, settle assets — compute layer revenue from gas fees, staking yield, deployment activity
2. DeFi primitives (UNI, AAVE, CRV): Financial infrastructure — protocol fees, TVL growth, governance revenue
3. Infrastructure (LINK, GRT, AR): Oracles, indexing, storage — usage fees from dApps, query volume, data demand
4. Scaling (ARB, OP, MATIC): Throughput solutions — transaction fees, bridged TVL, developer activity
5. App-specific (RENDER, FET, AKT): Niche compute/markets — service revenue, network utilization, token burn/buyback
ANALYSIS
Most altcoins trend toward zero vs BTC over time. Separating signal from noise requires:
- Real revenue/fees (not token inflation)
- Active developers + growing TVL/users
- Liquid markets on Binance (spot + perpetuals)
- Clear catalyst calendar (upgrades, unlocks, governance votes)
- Relative strength vs BTC (ETH/BTC, SOL/BTC charts)
SCENARIOS
Bullish: Alt sector shows broad relative strength vs BTC, TVL expanding, developer activity rising
Neutral: Selective rotation — only categories with revenue catalysts outperform
Bearish: Capital consolidates into BTC; alts bleed on low volume, failed catalysts
BINANCE ANGLE
Binance tools for alt research: Token X-Ray (profile/health/security), Market Breadth (participation), Sector Rotation (narrative heat), Funding Analysis (leverage positioning). Use these to filter tradable vs speculative.
CONCLUSION
Trade the trend, don't marry the bag. Value accrues to protocols with sustainable revenue, active users, and liquid markets — not to narratives alone.
Binance Angels
#Altcoins #Tokenomics #BinanceAngels
KEY TAKEAWAY
Altcoin value comes from utility, not price. Five functional categories drive real demand: smart-contract platforms, DeFi primitives, infrastructure, scaling, and app-specific tokens.
EVIDENCE
1. Smart-contract platforms (ETH, SOL, AVAX): Execute code, settle assets — compute layer revenue from gas fees, staking yield, deployment activity
2. DeFi primitives (UNI, AAVE, CRV): Financial infrastructure — protocol fees, TVL growth, governance revenue
3. Infrastructure (LINK, GRT, AR): Oracles, indexing, storage — usage fees from dApps, query volume, data demand
4. Scaling (ARB, OP, MATIC): Throughput solutions — transaction fees, bridged TVL, developer activity
5. App-specific (RENDER, FET, AKT): Niche compute/markets — service revenue, network utilization, token burn/buyback
ANALYSIS
Most altcoins trend toward zero vs BTC over time. Separating signal from noise requires:
- Real revenue/fees (not token inflation)
- Active developers + growing TVL/users
- Liquid markets on Binance (spot + perpetuals)
- Clear catalyst calendar (upgrades, unlocks, governance votes)
- Relative strength vs BTC (ETH/BTC, SOL/BTC charts)
SCENARIOS
Bullish: Alt sector shows broad relative strength vs BTC, TVL expanding, developer activity rising
Neutral: Selective rotation — only categories with revenue catalysts outperform
Bearish: Capital consolidates into BTC; alts bleed on low volume, failed catalysts
BINANCE ANGLE
Binance tools for alt research: Token X-Ray (profile/health/security), Market Breadth (participation), Sector Rotation (narrative heat), Funding Analysis (leverage positioning). Use these to filter tradable vs speculative.
CONCLUSION
Trade the trend, don't marry the bag. Value accrues to protocols with sustainable revenue, active users, and liquid markets — not to narratives alone.
Binance Angels
#Altcoins #Tokenomics #BinanceAngels
141
Log in to explore more content
Join global crypto users on Binance Square
⚡️ Get latest and useful information about crypto.
💬 Trusted by the world’s largest crypto exchange.
👍 Discover real insights from verified creators.
Email / Phone number
Trending Topics
1
#USAugustPPIRisesLessThanExpected
16,624 views
430 Discussing
2
#SECApprovesNasdaqTexasCommodityTrustRule
12,452 views
386 Discussing
3
#ECBRaisesRatesSecondTimeTo2.5%
8,858 views
274 Discussing
4
#USContinuingJoblessClaims1.774M
15,046 views
366 Discussing
5
#USAugustPPIYoYRisesTo5.4%
14,950 views
286 Discussing
6
#AppleDebutsFoldablePhone
85,053 views
1,375 Discussing
7
#TSMCAugustRevenueUp53.3%YoY
20,740 views
510 Discussing
8
#IranSaysReadyToEscalateWarWithUS
30,460 views
509 Discussing
9
#EUExtendsCentralContactPointToCASPs
25,629 views
513 Discussing
10
#US10YTreasuryYieldHitsHighestSinceNov2023
56,377 views
781 Discussing