Binance Square

metabusdt

136 views
13 Discussing
Muzamil_Trader1
·
--
🚀 A+ HIGH PROBABILITY MARKET UPDATE 🚀 ​📊 Pair: #METABUSDT (Meta Tokenized bStocks) 📈 Direction: SHORT-TERM CONSOLIDATION / RANGE BOUND 🟡 ⏱️ Timeframe: 15m / 1H ​🎯 Current Price: ~$690.00 – $712.00 🛡️ Key Support Floor: $675.00 – $688.00 ​🎯 Key Resistance Zones: 1️⃣ Resistance 1: $735.00 2️⃣ Resistance 2 (Main Pivot): $765.00 – $780.00 ​⚖️ Risk/Reward Ratio: 1:3.0+ 🔥 Market Dynamics: Tokenized equities tracking underlying Meta Platforms equity performance, reflecting steady on-chain volume and 24/7 market correlation. ​💡 Analysis: METAB/USDT price $690 aur $712 ke darmiyan trade kar rahi hai aur $675–$688 ke key support floor ko defend kar rahi hai. Jab tak price is support zone ke upar hold karti hai, upper resistance targets ($735 aur $765+) ki taraf bullish continuation ki high probability hai. Support breakdown hone par strict risk management follow karein. $METAB #BinanceSquareFamily #METABUSDT #TradingSignals {spot}(METABUSDT)
🚀 A+ HIGH PROBABILITY MARKET UPDATE 🚀

​📊 Pair: #METABUSDT (Meta Tokenized bStocks)

📈 Direction: SHORT-TERM CONSOLIDATION / RANGE BOUND 🟡

⏱️ Timeframe: 15m / 1H

​🎯 Current Price: ~$690.00 – $712.00

🛡️ Key Support Floor: $675.00 – $688.00

​🎯 Key Resistance Zones:

1️⃣ Resistance 1: $735.00

2️⃣ Resistance 2 (Main Pivot): $765.00 – $780.00

​⚖️ Risk/Reward Ratio: 1:3.0+

🔥 Market Dynamics: Tokenized equities tracking underlying Meta Platforms equity performance, reflecting steady on-chain volume and 24/7 market correlation.

​💡 Analysis: METAB/USDT price $690 aur $712 ke darmiyan trade kar rahi hai aur $675–$688 ke key support floor ko defend kar rahi hai. Jab tak price is support zone ke upar hold karti hai, upper resistance targets ($735 aur $765+) ki taraf bullish continuation ki high probability hai. Support breakdown hone par strict risk management follow karein.

$METAB

#BinanceSquareFamily
#METABUSDT
#TradingSignals
·
--
Bullish
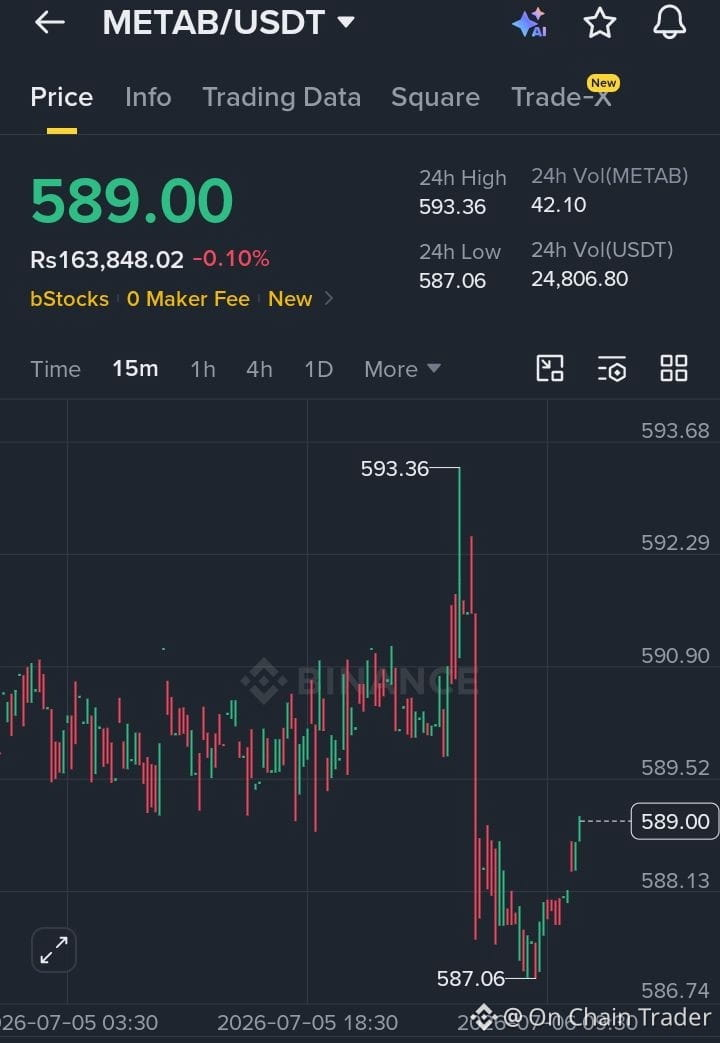
$METAB {spot}(METABUSDT) /USDT – Breakout Watch 👀 🟢 Pattern: Ascending Triangle with strong support near $587, signaling bullish pressure. Entry: $588–$590 | Stop Loss: $586 Targets: 🎯 $593.50 → $600 → $612 A decisive break above $593.50 could spark the next bullish wave, while holding above support keeps buyers in control. #METAB #METABUSDT #Binance
$METAB
/USDT – Breakout Watch 👀
🟢 Pattern: Ascending Triangle with strong support near $587, signaling bullish pressure.
Entry: $588–$590 | Stop Loss: $586
Targets: 🎯 $593.50 → $600 → $612
A decisive break above $593.50 could spark the next bullish wave, while holding above support keeps buyers in control.
#METAB #METABUSDT #Binance
·
--
Bullish
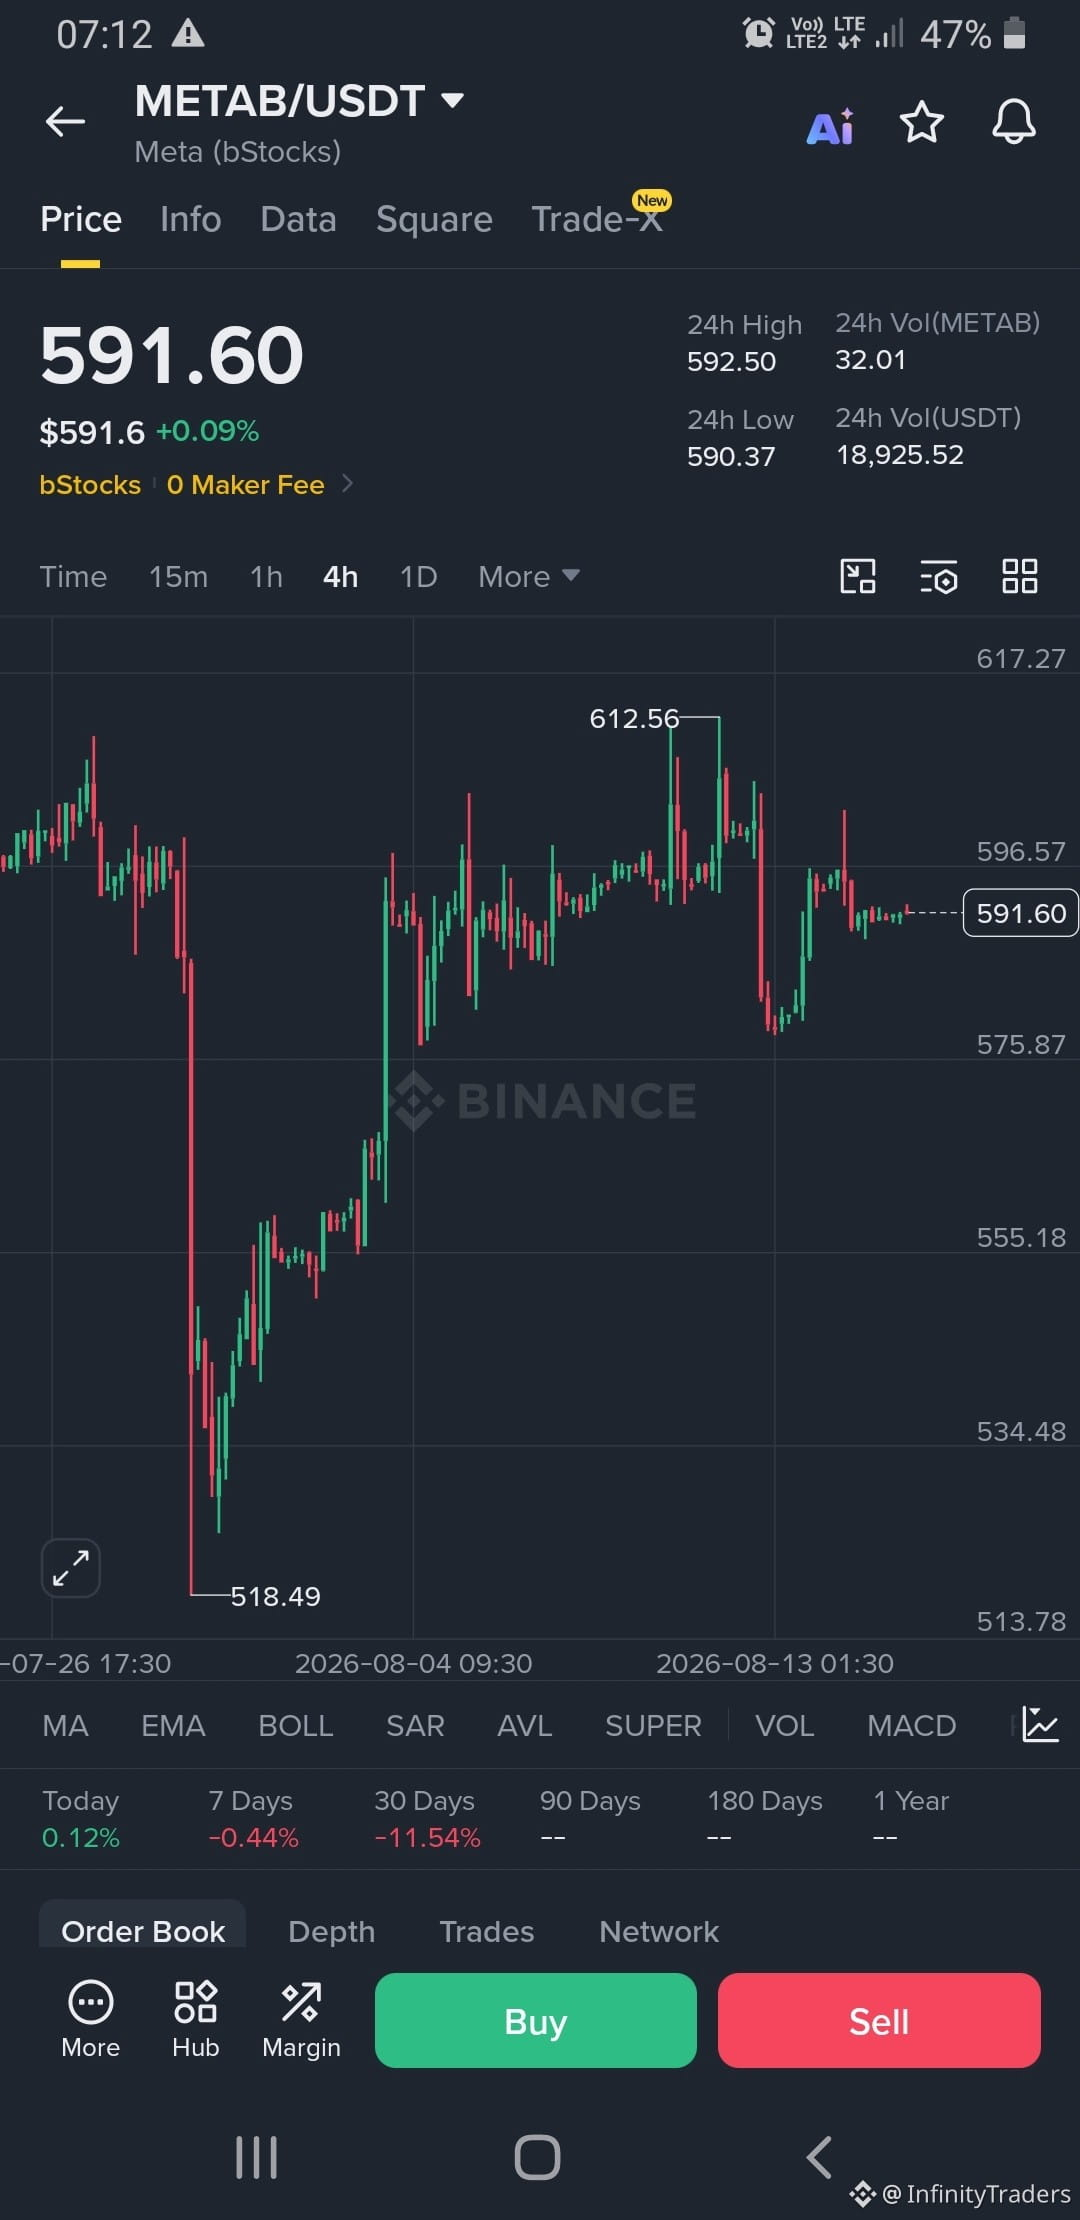
WOKE UP THIS MORNING AND CHECKED $METAB STOCK TOKEN ON BINANCE, PRICE SITTING AT 591.60 DOLLARS. STILL GREEN FOR THE DAY, UP JUST 0.09%, NOTHING CRAZY BUT I'LL TAKE IT. So this is #METABUSDT , basically Meta trading through Binance's stock tokens thing, and honestly the chart tells a wild story if you zoom out. Like three weeks ago this thing was cruising around 590-600 comfortably, then it just fell off a cliff, dropped all the way down to 518.49, one of those brutal red candles that just wicks straight down and makes your stomach drop if you were holding. That's an 11.54% loss over 30 days, which is rough, no sugarcoating it. But then buyers stepped back in and honestly the recovery was kind of beautiful to watch on the chart, green candles stacking up one after another climbing it back from the 520s all the way up past 590, even spiked up to 612.56 at one point before getting sold back down. Now it's just kind of chilling here around 591-592, high today was 592.50, low was 590.37, so we're in a tight little range right now, not much drama in the last few hours. Volume today was 32.01 in METAB terms, about 18,925 dollars worth of USDT changing hands, so it's not exactly a high volume day, feels more like everyone's just watching and waiting to see which way this breaks next. Weekly it's still down a touch, -0.44%, so the bigger picture is still bruised from that crash even though the last week or two has been a slow grind back up. If I'm being a beginner about it, I'd say this looks like a stock that took a scary hit, found its footing, and is now just catching its breath before it decides whether to push higher or take another leg down. I wouldn't be chasing it up here without a plan, but I'm watching that 590 level like a hawk, if it holds, that recovery story keeps going.
WOKE UP THIS MORNING AND CHECKED $METAB STOCK TOKEN ON BINANCE, PRICE SITTING AT 591.60 DOLLARS.
STILL GREEN FOR THE DAY, UP JUST 0.09%, NOTHING CRAZY BUT I'LL TAKE IT.

So this is #METABUSDT , basically Meta trading through Binance's stock tokens thing, and honestly the chart tells a wild story if you zoom out. Like three weeks ago this thing was cruising around 590-600 comfortably, then it just fell off a cliff, dropped all the way down to 518.49, one of those brutal red candles that just wicks straight down and makes your stomach drop if you were holding. That's an 11.54% loss over 30 days, which is rough, no sugarcoating it.

But then buyers stepped back in and honestly the recovery was kind of beautiful to watch on the chart, green candles stacking up one after another climbing it back from the 520s all the way up past 590, even spiked up to 612.56 at one point before getting sold back down. Now it's just kind of chilling here around 591-592, high today was 592.50, low was 590.37, so we're in a tight little range right now, not much drama in the last few hours.

Volume today was 32.01 in METAB terms, about 18,925 dollars worth of USDT changing hands, so it's not exactly a high volume day, feels more like everyone's just watching and waiting to see which way this breaks next. Weekly it's still down a touch, -0.44%, so the bigger picture is still bruised from that crash even though the last week or two has been a slow grind back up.

If I'm being a beginner about it, I'd say this looks like a stock that took a scary hit, found its footing, and is now just catching its breath before it decides whether to push higher or take another leg down. I wouldn't be chasing it up here without a plan, but I'm watching that 590 level like a hawk, if it holds, that recovery story keeps going.
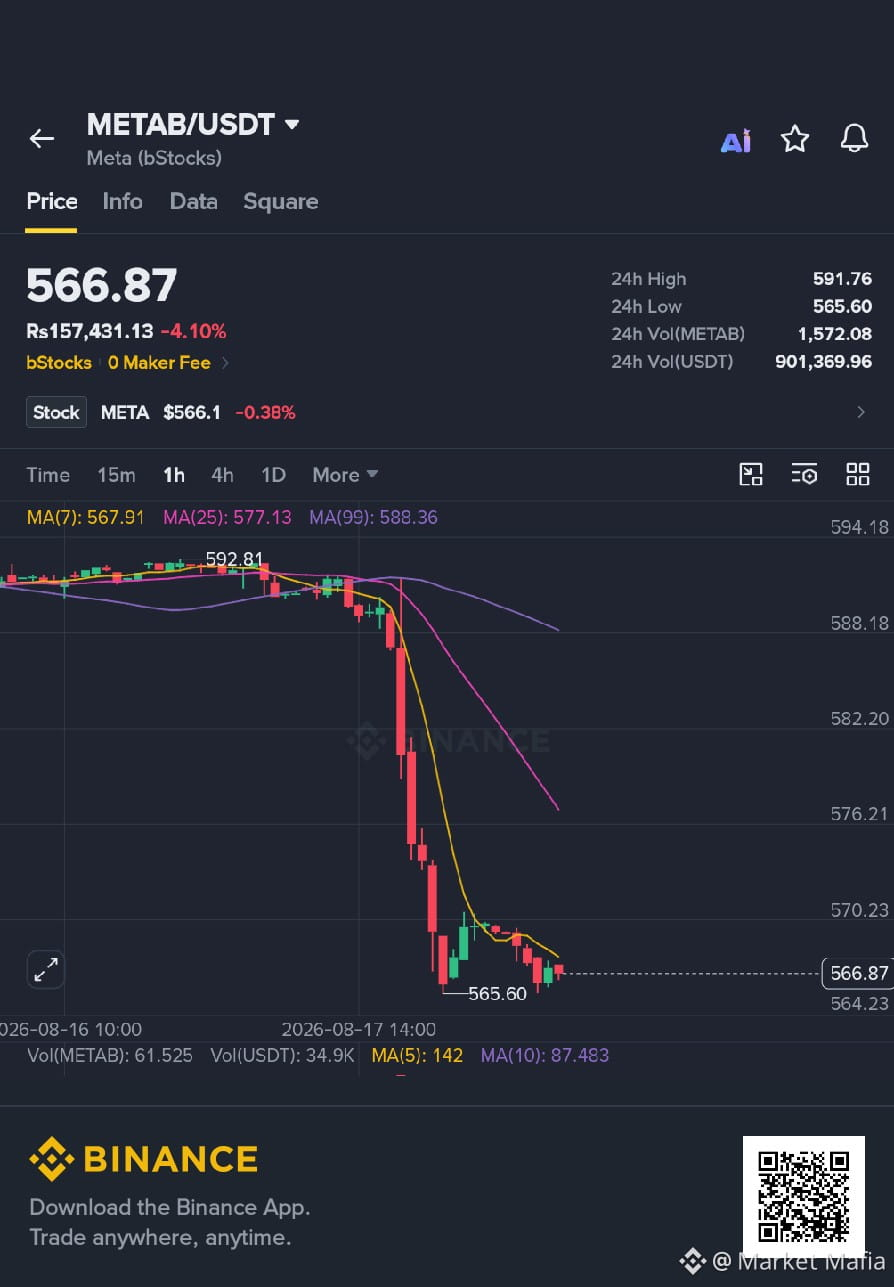
🔴 $METAB وصل لمنطقة تشبع شرائي! ⚠️📉 🔴 SHORT $METAB 📊 RSI على فريم 1 ساعة = 70.48، وهي منطقة Overbought وقد تدعم تصحيحًا هابطًا إذا ظهر تأكيد بيعي. 🎯 الدخول: 569 – 572 🎯 الهدف 1: 565 🎯 الهدف 2: 559 🎯 الهدف 3: 552 🛑 وقف الخسارة: 580 ⚠️ التشبع الشرائي وحده لا يعني هبوطًا مؤكدًا؛ انتظر تأكيد الرفض قبل الدخول. ❤️ دعمك يفرق معايا $METAB #METABUSDT #METAB #short
🔴 $METAB وصل لمنطقة تشبع شرائي! ⚠️📉

🔴 SHORT $METAB

📊 RSI على فريم 1 ساعة = 70.48، وهي منطقة Overbought وقد تدعم تصحيحًا هابطًا إذا ظهر تأكيد بيعي.

🎯 الدخول: 569 – 572
🎯 الهدف 1: 565
🎯 الهدف 2: 559
🎯 الهدف 3: 552

🛑 وقف الخسارة: 580

⚠️ التشبع الشرائي وحده لا يعني هبوطًا مؤكدًا؛ انتظر تأكيد الرفض قبل الدخول.

❤️ دعمك يفرق معايا

$METAB #METABUSDT #METAB #short
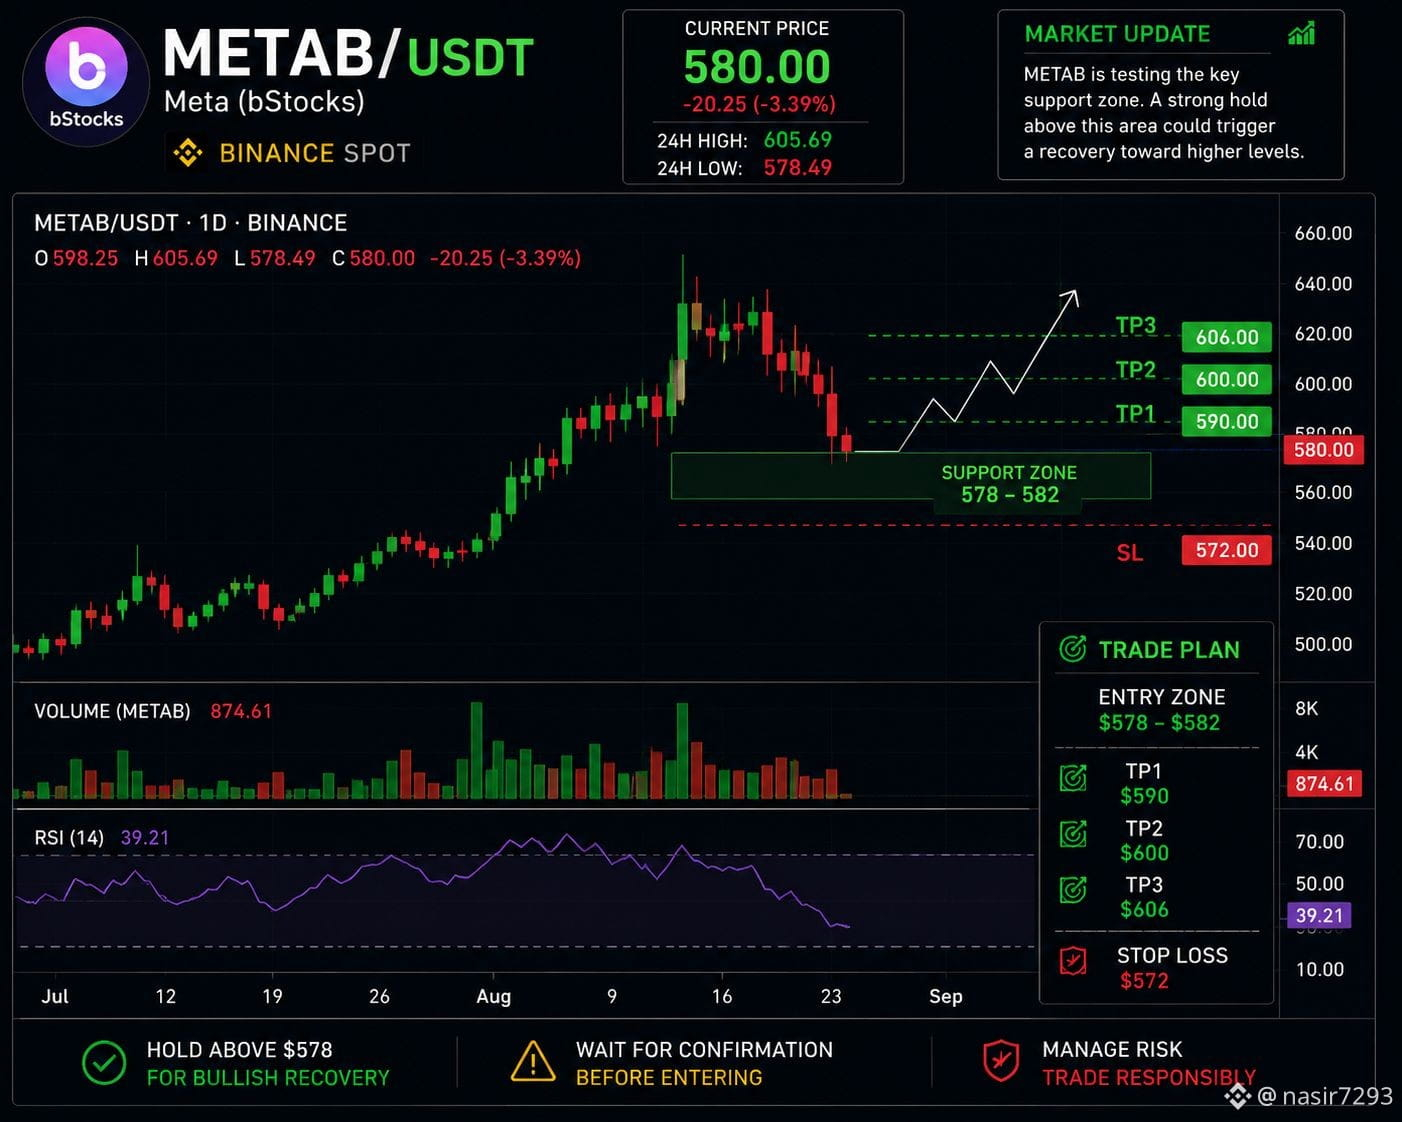
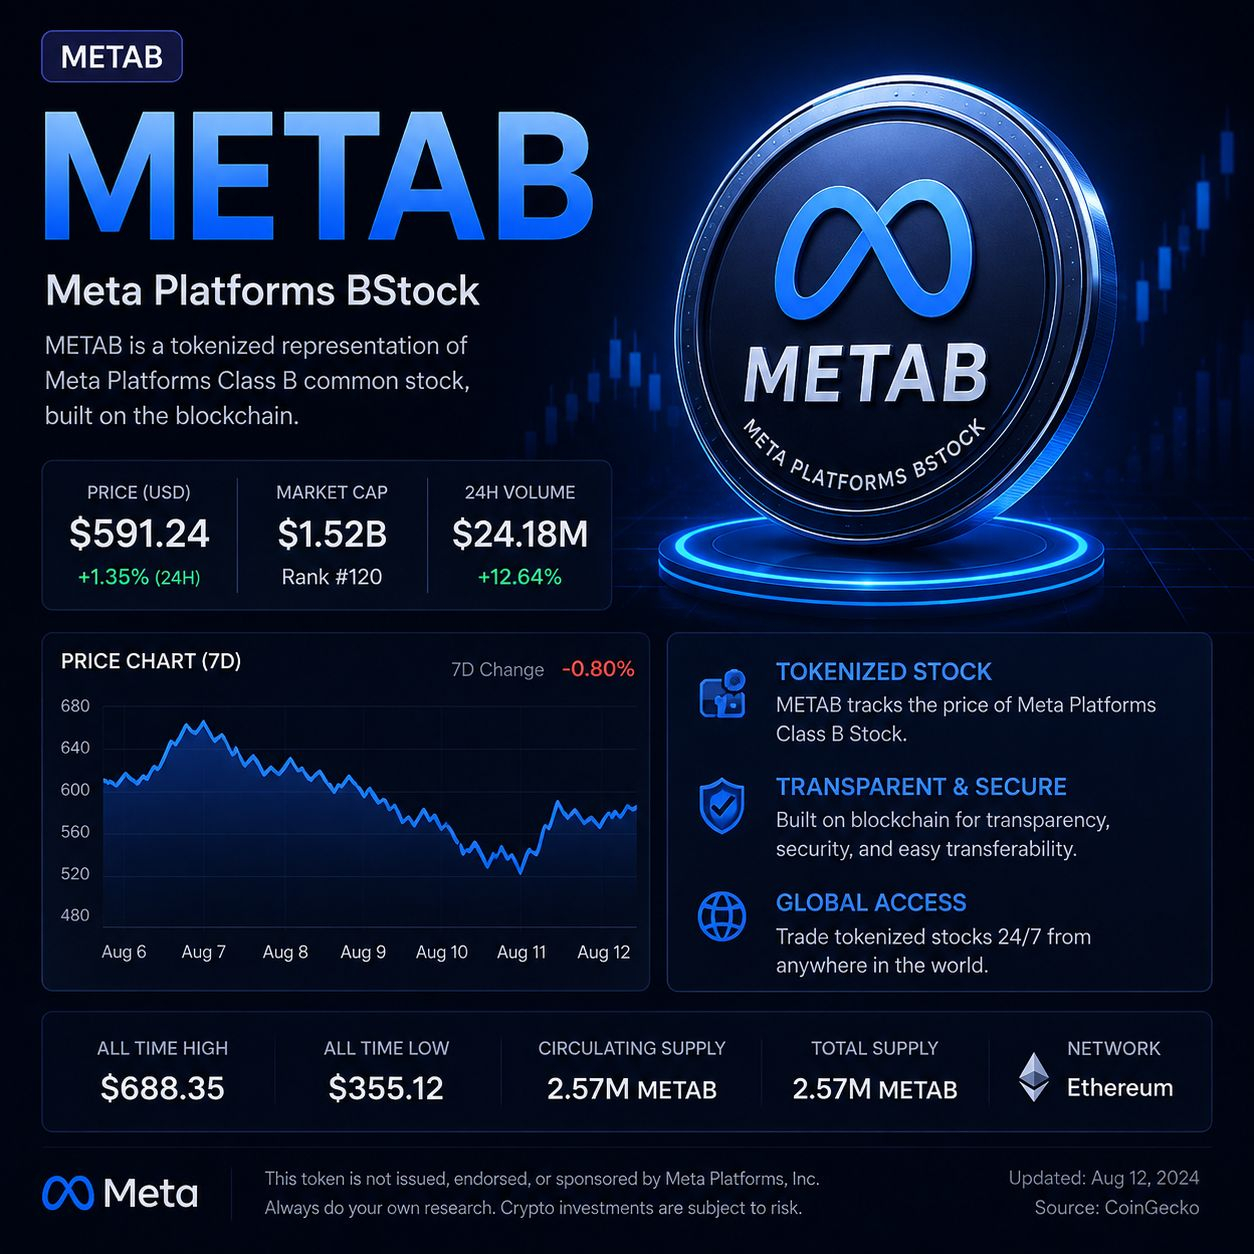
📊 $METAB (Meta Tokenized bStock) — Latest Technical Analysis $METAB is currently trading around $590–$600, showing relatively stable price action after the recent correction. 🔹 Current Price: ~$592–$598 🔹 24H: Slightly positive 🔹 7D: Mildly bearish 🔹 ATH: ~$688 🔹 Key Support: $580 → $560 → $524 🔹 Key Resistance: $610 → $630 → $688 📈 Bullish Scenario: If $METAB can break and hold above $610, momentum could strengthen toward $630. A clean breakout above $630 could bring the previous high near $688 back into focus. 📉 Bearish Scenario: Failure to reclaim $600–$610 could keep METAB under pressure. Losing $580 may open the way toward $560, while a deeper correction could retest the $524 area. 👀 What I’m Watching: The key level is $610. A strong breakout with rising volume would improve the short-term structure, while rejection below resistance could mean more consolidation. ⚠️ Personal Market analysis only - not financial advise.DYOR #METABUSDT #BinanceSquareTalks #CryptoNewss #TechnicalAnalysiss {spot}(METABUSDT)
📊 $METAB (Meta Tokenized bStock) — Latest Technical Analysis

$METAB is currently trading around $590–$600, showing relatively stable price action after the recent correction.

🔹 Current Price: ~$592–$598
🔹 24H: Slightly positive
🔹 7D: Mildly bearish
🔹 ATH: ~$688
🔹 Key Support: $580 → $560 → $524
🔹 Key Resistance: $610 → $630 → $688

📈 Bullish Scenario:
If $METAB can break and hold above $610, momentum could strengthen toward $630. A clean breakout above $630 could bring the previous high near $688 back into focus.

📉 Bearish Scenario:
Failure to reclaim $600–$610 could keep METAB under pressure. Losing $580 may open the way toward $560, while a deeper correction could retest the $524 area.

👀 What I’m Watching:
The key level is $610. A strong breakout with rising volume would improve the short-term structure, while rejection below resistance could mean more consolidation.

⚠️ Personal Market analysis only - not financial advise.DYOR

#METABUSDT #BinanceSquareTalks #CryptoNewss #TechnicalAnalysiss
What will Meta Platforms, Inc. (META) hit in August 2026?

What will Meta Platforms, Inc. (META) hit in August 2026?

↓ $46099%↑ $68099%↑ $66099%
Volume $0.0
·
--
Bullish
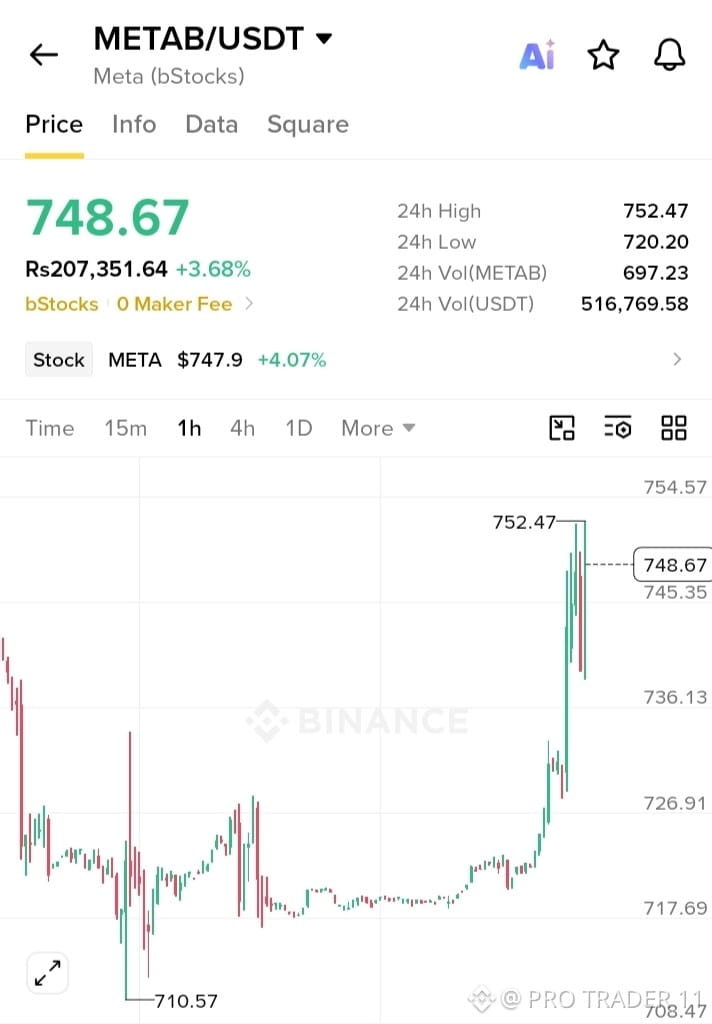
🔥 *$METAB /USDT Trading Setup: Key Levels to Watch* 📍 *Entry Zone:* 740.00 - 748.67 USDT (Based on your chart - current breakout retest) 🛑 *Stop Loss:* 726.91 USDT (Below the invalidation level / intraday support) 🎯 *TP1:* 752.47 USDT (24h High) 🎯 *TP2:* 765.00 USDT 🚀 *TP3:* 780.00 USDT (Final breakout target) 📊 *Analysis:* METAB (Meta bStocks) is up +3.68% tracking META stock $747.9 +4.07%. Your chart shows price bottomed at 710.57, consolidated around 718 for long time, then exploded to 752.47 with strong momentum, now holding at 748.67. ⚠️ *Risk Management:* Always manage risk. bStocks = stock-backed token, 0 Maker Fee but moves with US market hours, secure profit at TP1. #METAB #METABUSDT #bStocks #Binance #StockTokens {spot}(METABUSDT)
🔥 *$METAB /USDT Trading Setup: Key Levels to Watch*

📍 *Entry Zone:* 740.00 - 748.67 USDT (Based on your chart - current breakout retest)
🛑 *Stop Loss:* 726.91 USDT (Below the invalidation level / intraday support)
🎯 *TP1:* 752.47 USDT (24h High)
🎯 *TP2:* 765.00 USDT
🚀 *TP3:* 780.00 USDT (Final breakout target)

📊 *Analysis:* METAB (Meta bStocks) is up +3.68% tracking META stock $747.9 +4.07%. Your chart shows price bottomed at 710.57, consolidated around 718 for long time, then exploded to 752.47 with strong momentum, now holding at 748.67.
⚠️ *Risk Management:* Always manage risk. bStocks = stock-backed token, 0 Maker Fee but moves with US market hours, secure profit at TP1.

#METAB #METABUSDT #bStocks #Binance #StockTokens
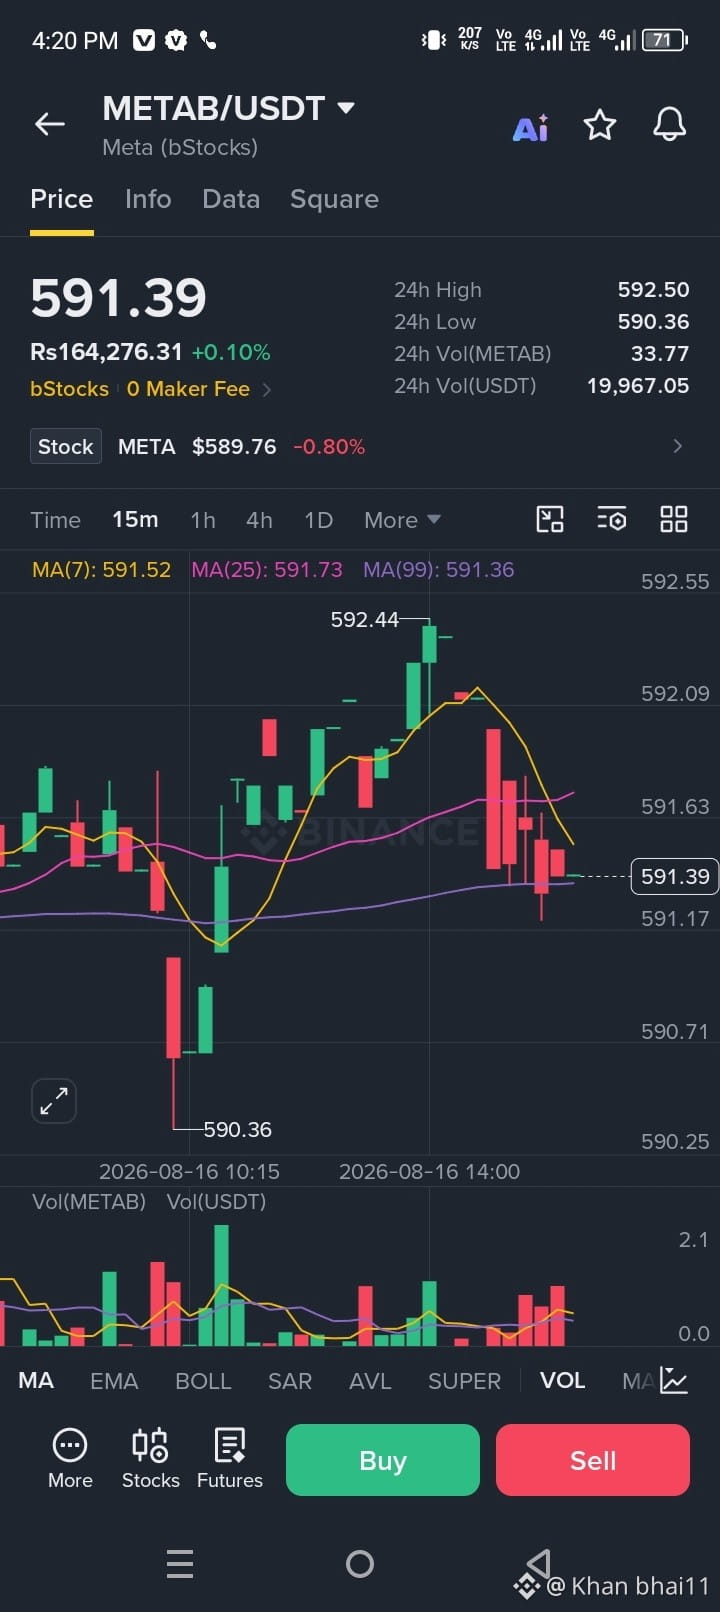
$METAB /USDT Short-Term Watch METAB is trading around 591.39 USDT on the 15M chart. Price recently touched 592.44 but faced selling pressure and pulled back toward the 591.2–591.4 area. 🔹 Resistance: 592.4–592.5 🔹 Support: 591.2 / 590.4 🔹 Key zone: 591.3–591.7 A strong breakout above 592.5 could bring fresh momentum, while losing 591.2 may increase downside pressure. Trade carefully and wait for confirmation. #METAB获得支撑 #METABUSDT #CryptoPatience #BinanceSquareTalks #trading
$METAB /USDT Short-Term Watch

METAB is trading around 591.39 USDT on the 15M chart. Price recently touched 592.44 but faced selling pressure and pulled back toward the 591.2–591.4 area.

🔹 Resistance: 592.4–592.5
🔹 Support: 591.2 / 590.4
🔹 Key zone: 591.3–591.7

A strong breakout above 592.5 could bring fresh momentum, while losing 591.2 may increase downside pressure. Trade carefully and wait for confirmation.

#METAB获得支撑 #METABUSDT #CryptoPatience #BinanceSquareTalks #trading
·
--
Bearish
Log in to explore more content
Join global crypto users on Binance Square
⚡️ Get latest and useful information about crypto.
💬 Trusted by the world’s largest crypto exchange.
👍 Discover real insights from verified creators.
Email / Phone number