Binance Square
#indicator

indicator

61,404 views
219 Discussing
VRTrader
ยท
--
Bearish
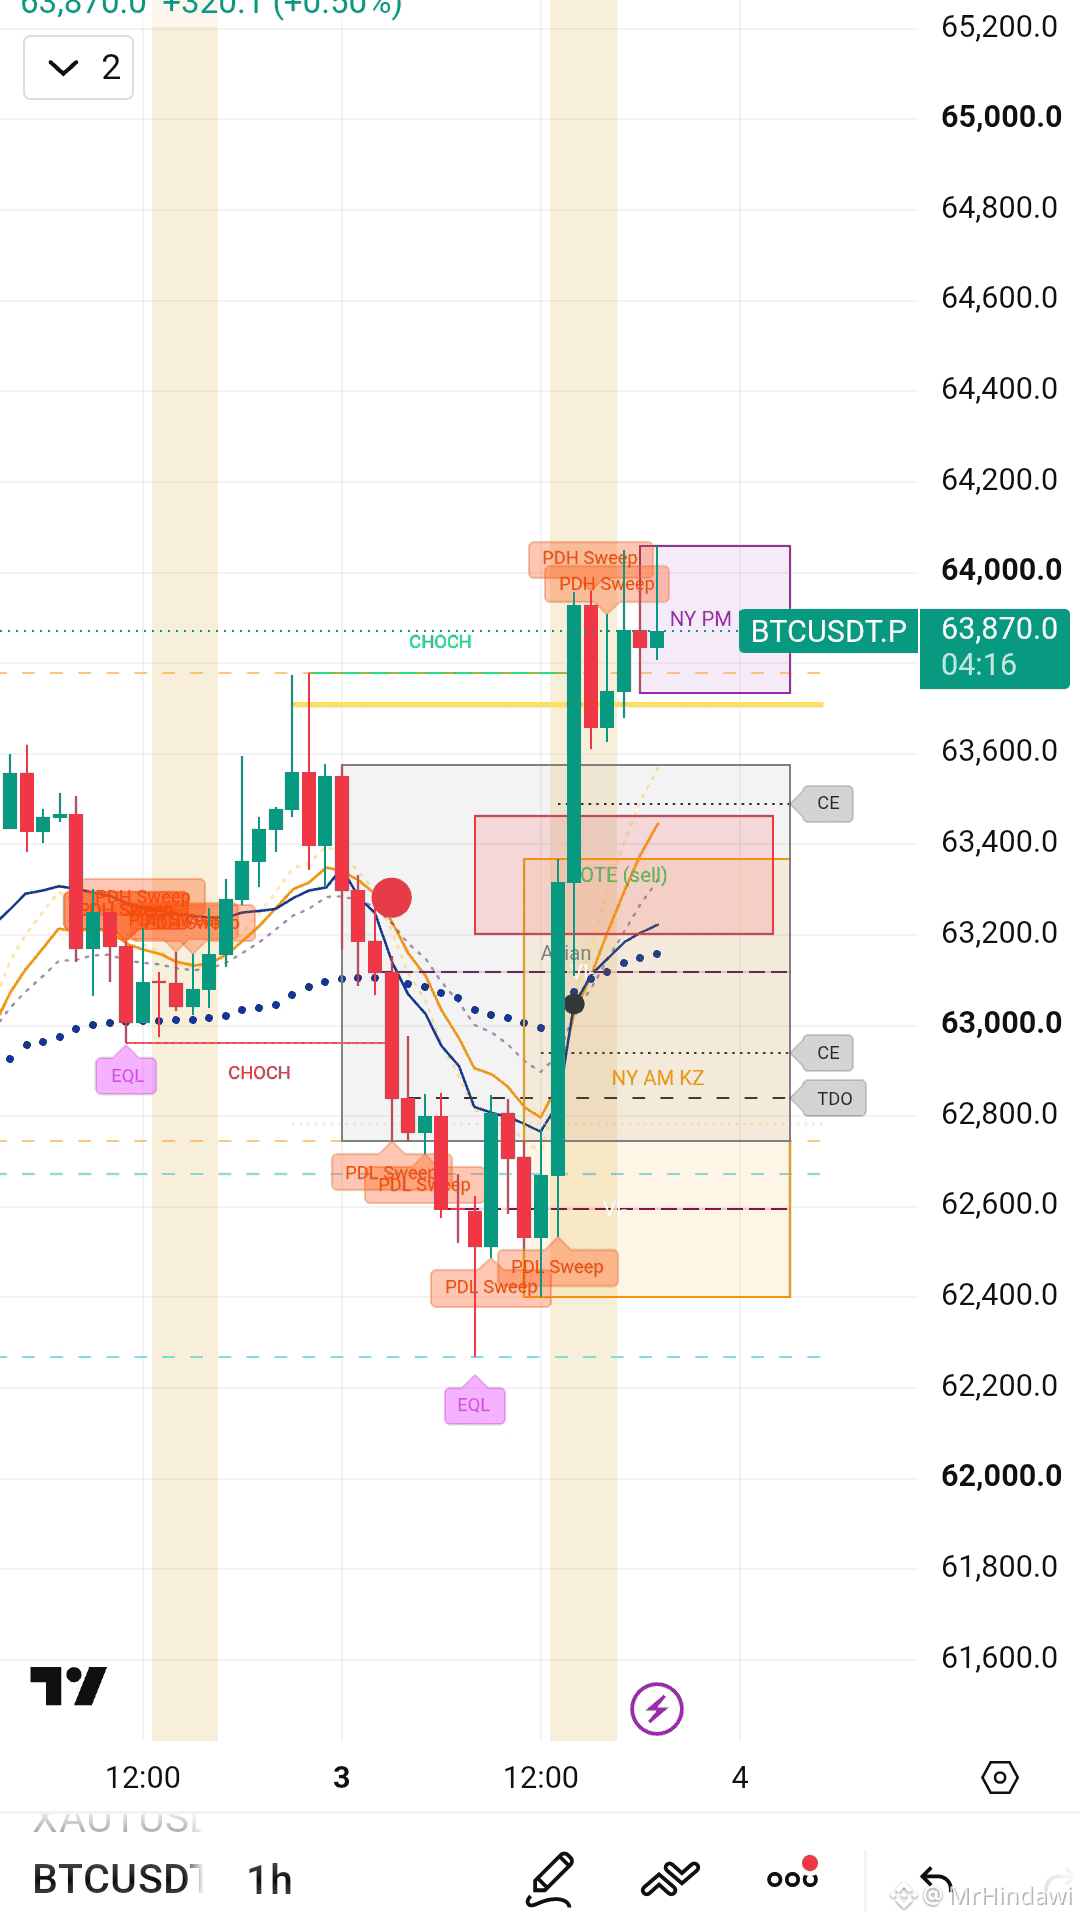
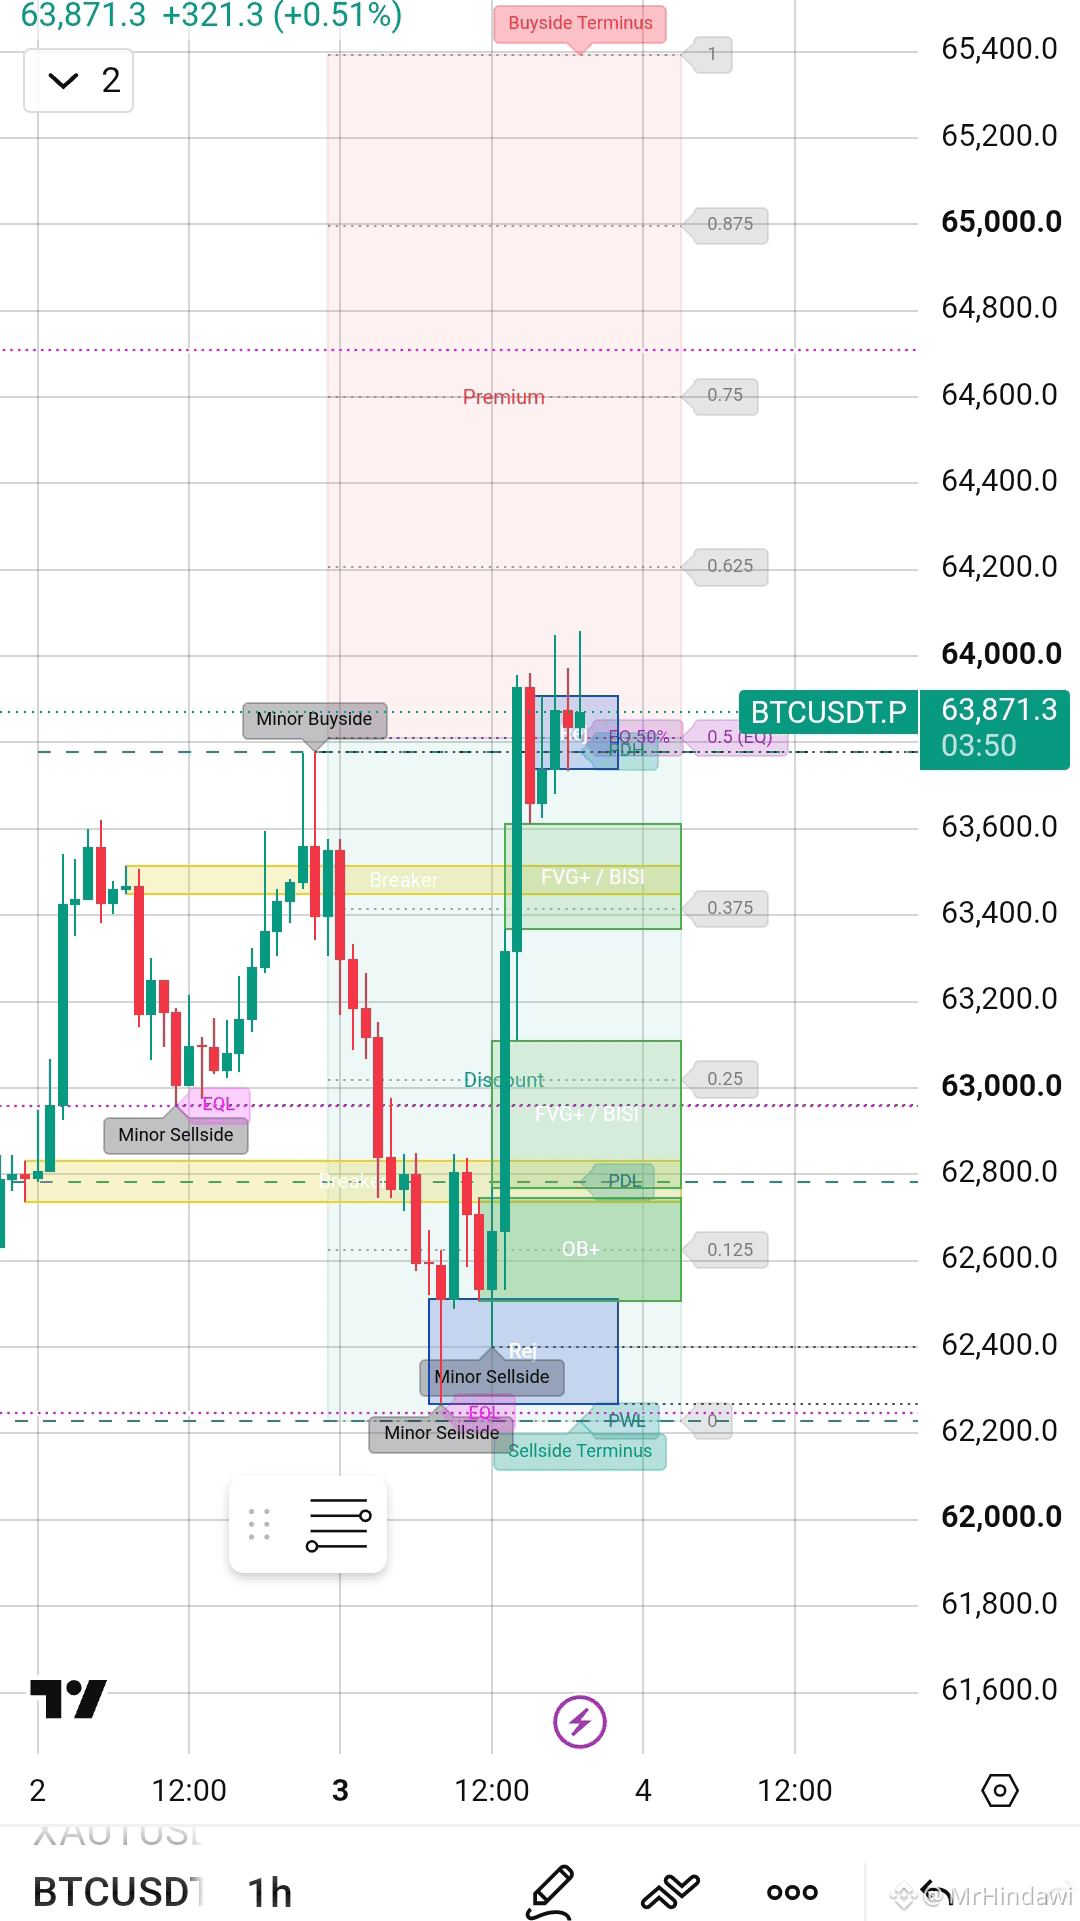
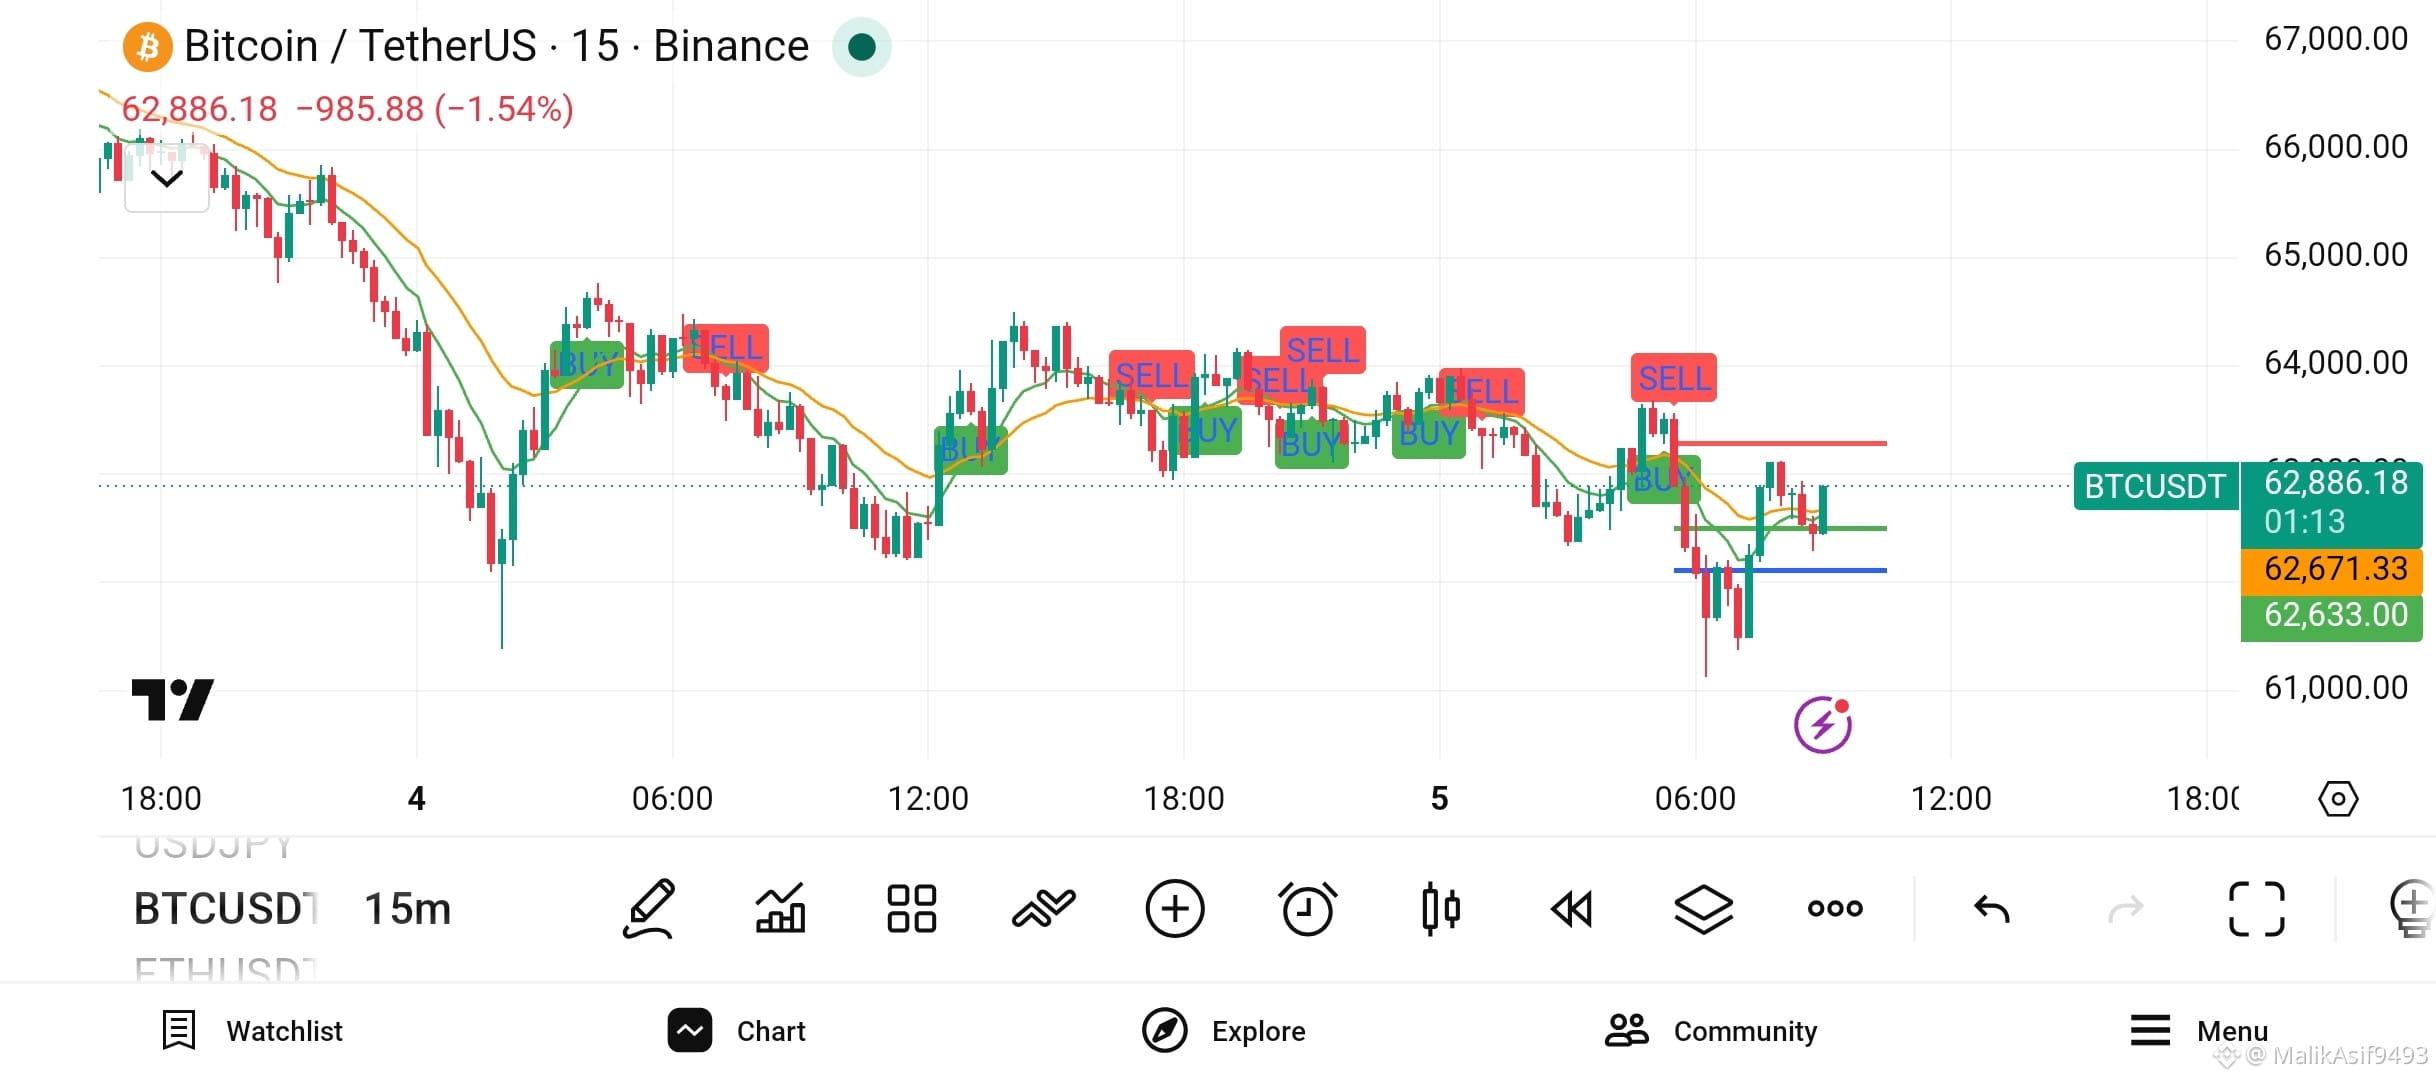
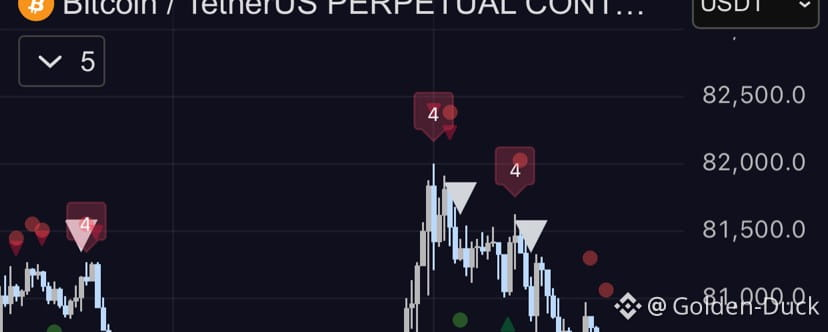
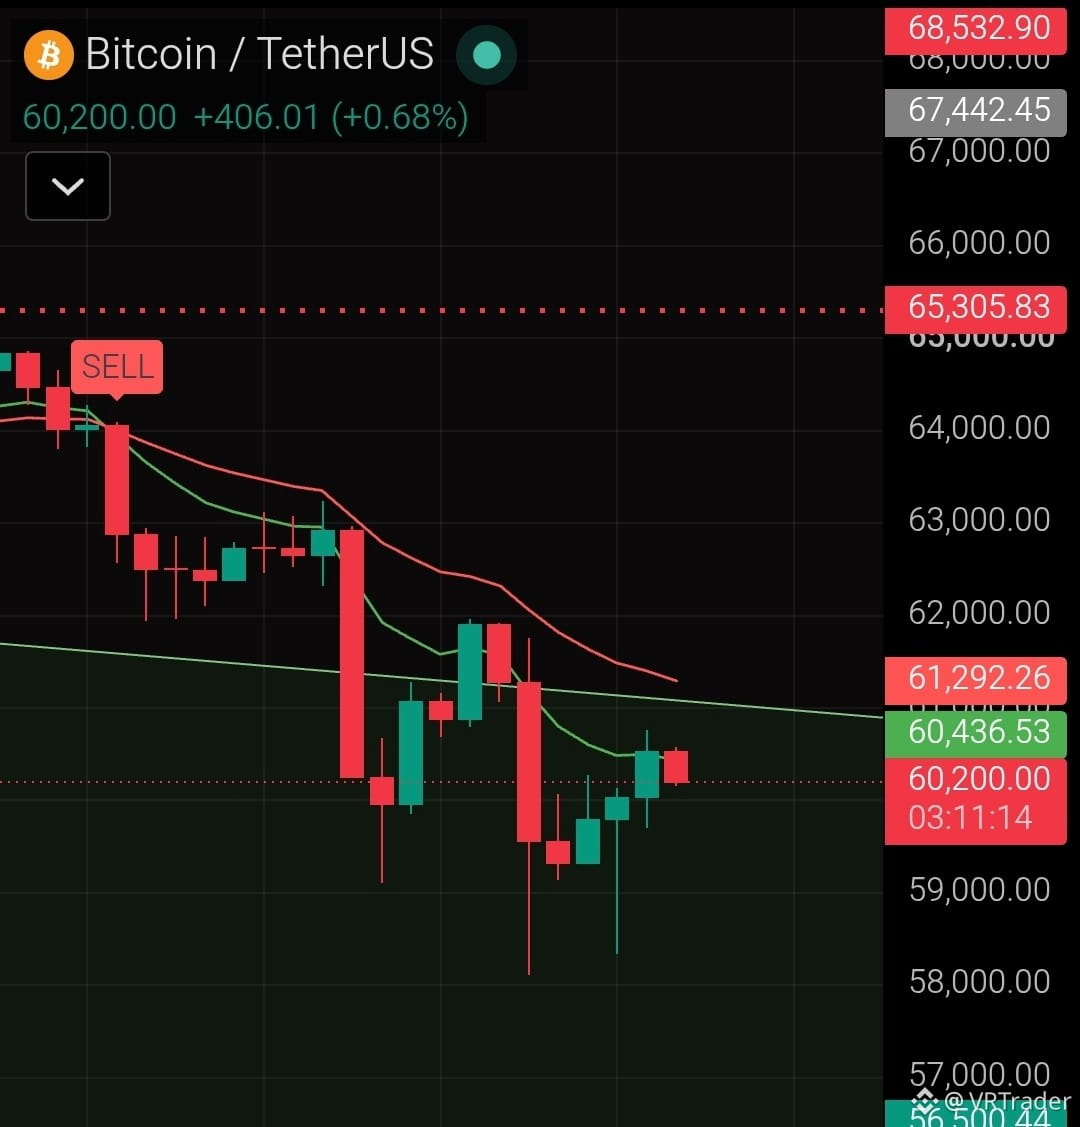
I developed this brilliant indicator that managed to predict $BTC fall long before the actual dump. {future}(BTCUSDT) It didn't predict not just once or twice, it's working very nicely on any chart. No buy signal so far so we're still in the bear run. ๐Ÿ“‰ DYOR #Binance #BTC #indicator $NVDAB $SIREN
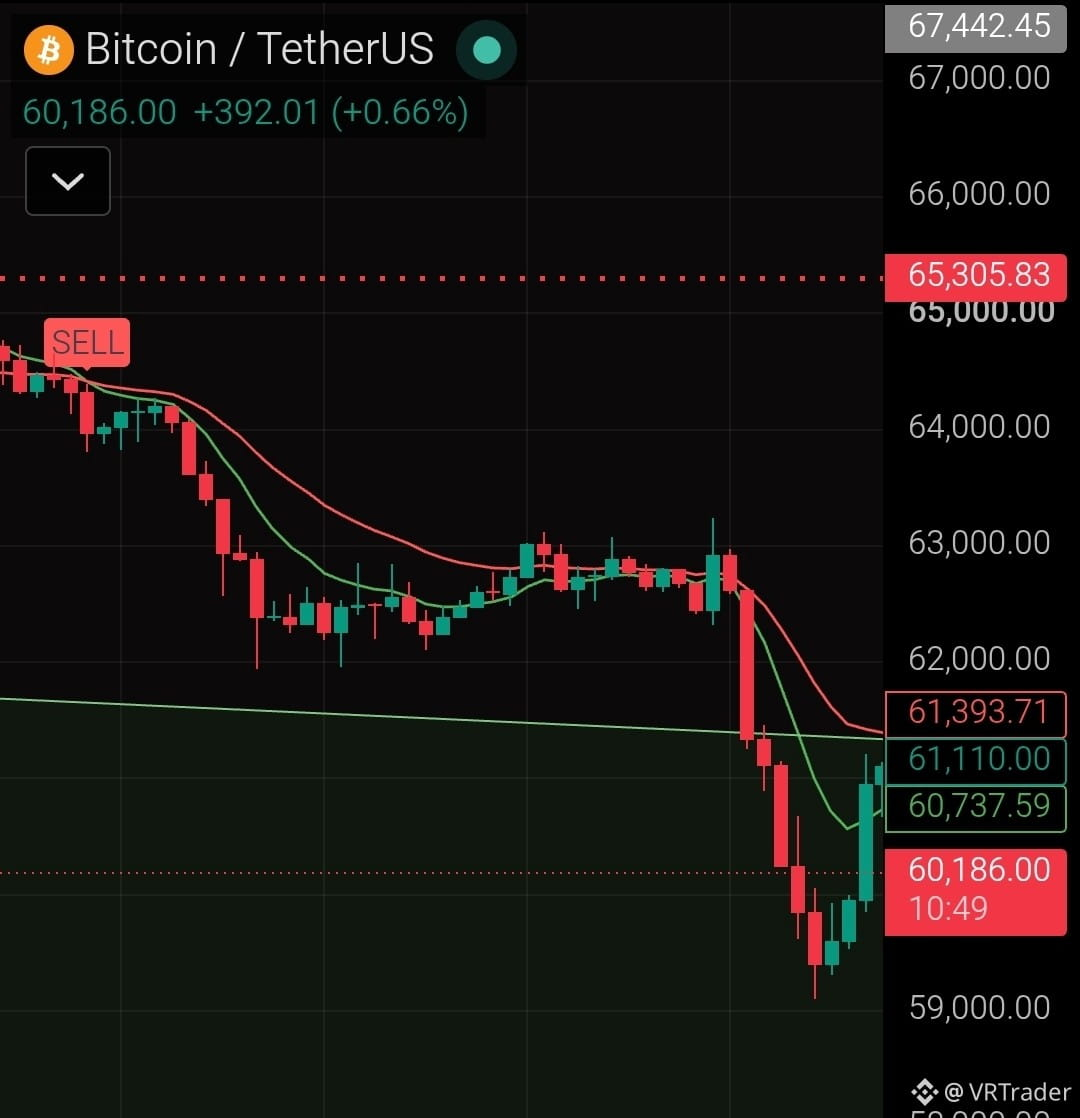
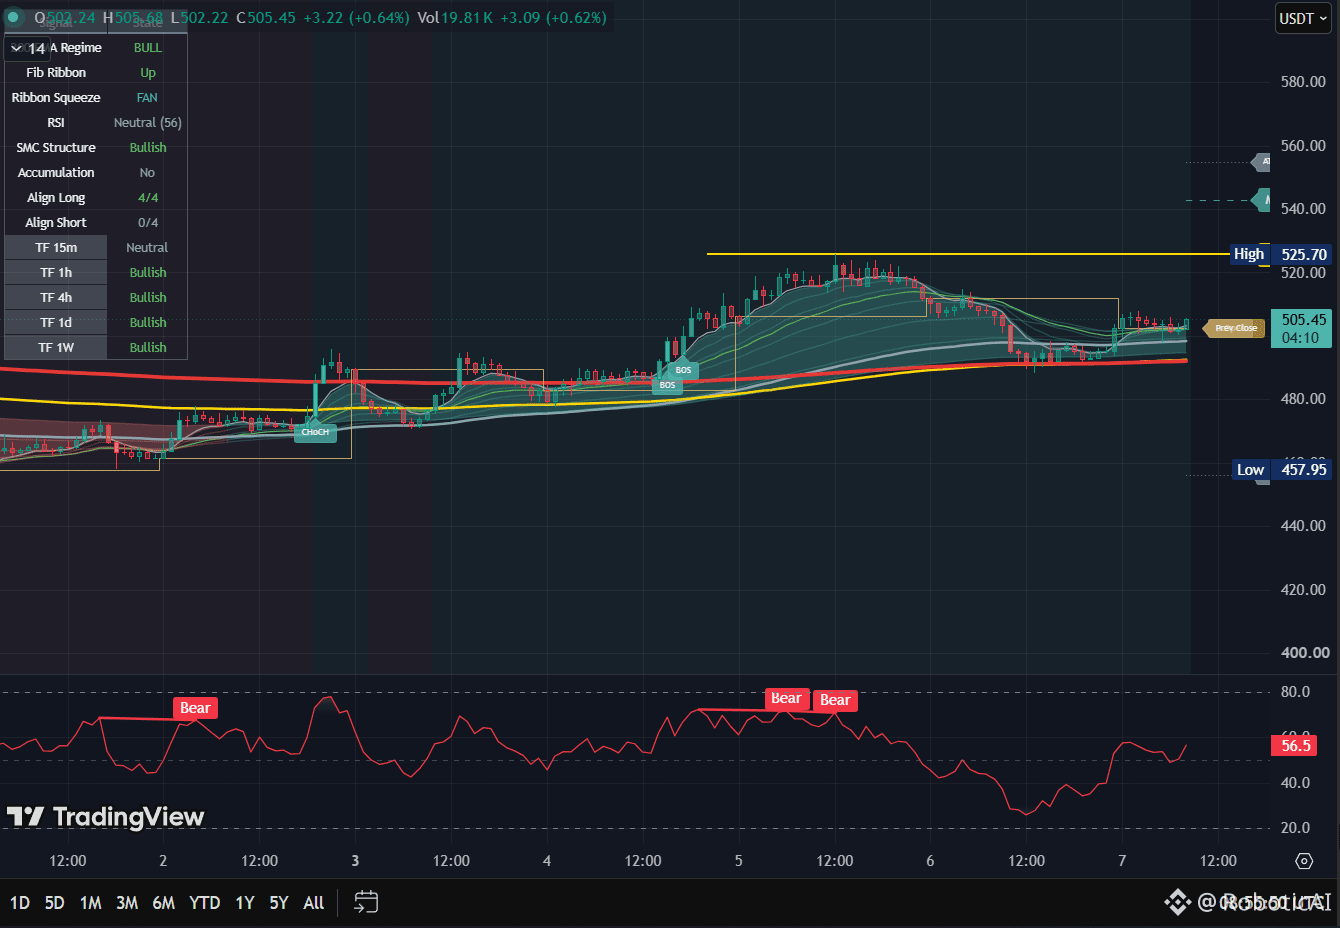
I developed this brilliant indicator that managed to predict $BTC fall long before the actual dump.
It didn't predict not just once or twice, it's working very nicely on any chart.

No buy signal so far so we're still in the bear run. ๐Ÿ“‰

DYOR #Binance #BTC #indicator $NVDAB $SIREN
ยท
--
Bullish
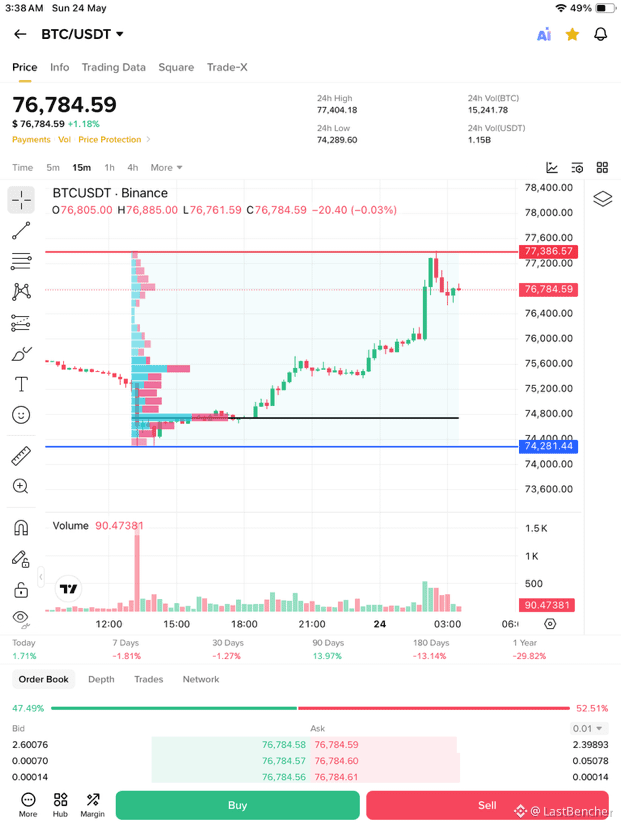
Fixed Range Volume Profile Indicator The Fixed Range Volume Profile shows how much buying and selling happened at different price levels inside a selected range. ๐Ÿ”ต Blue = Buying volume ๐Ÿ”ด Pink = Selling volume ๐Ÿ“ Bigger bar = More volume traded at that price How to Draw It ๐Ÿ“ˆ Uptrend: Draw from the swing low to the swing high. ๐Ÿ“‰ Downtrend: Draw from the swing high to the swing low. How to Use It โœ… High-volume zones = Strong support/resistance โœ… Low-volume zones = Price moves fast through them โœ… POC (biggest bar) = Most traded price level Trading Idea * Price above POC = Bullish * Price below POC = Bearish * Retest of high-volume zone + rejection = possible entry Volume Profile basically shows: โ€œWhere the market traded the most and is likely to come back.โ€ #LONG #SHORT #TRADE #SIGNAL #INDICATOR ๐Ÿ“ˆ Trade Now $BTC {future}(BTCUSDT)
Fixed Range Volume Profile Indicator

The Fixed Range Volume Profile shows how much buying and selling happened at different price levels inside a selected range.

๐Ÿ”ต Blue = Buying volume
๐Ÿ”ด Pink = Selling volume
๐Ÿ“ Bigger bar = More volume traded at that price

How to Draw It

๐Ÿ“ˆ Uptrend:
Draw from the swing low to the swing high.

๐Ÿ“‰ Downtrend:
Draw from the swing high to the swing low.

How to Use It

โœ… High-volume zones = Strong support/resistance
โœ… Low-volume zones = Price moves fast through them
โœ… POC (biggest bar) = Most traded price level

Trading Idea

* Price above POC = Bullish
* Price below POC = Bearish
* Retest of high-volume zone + rejection = possible entry

Volume Profile basically shows:

โ€œWhere the market traded the most and is likely to come back.โ€

#LONG #SHORT #TRADE #SIGNAL #INDICATOR

๐Ÿ“ˆ Trade Now $BTC
ยท
--
Article
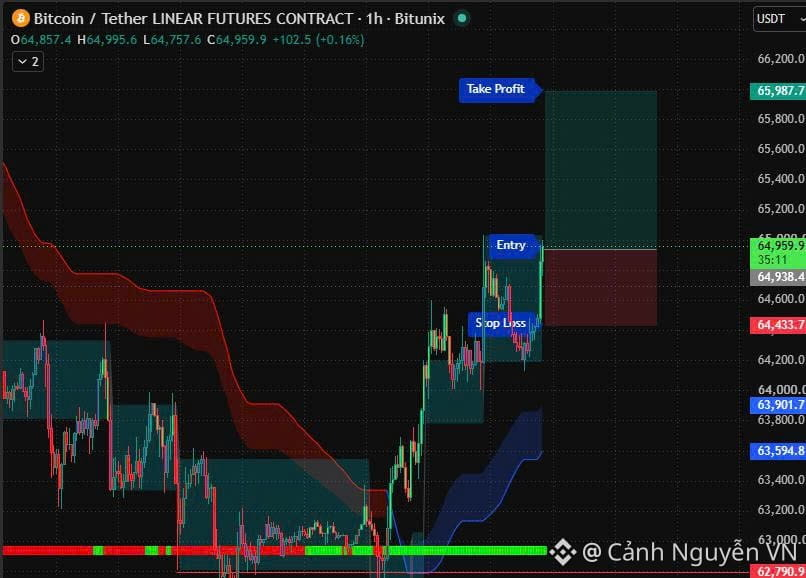
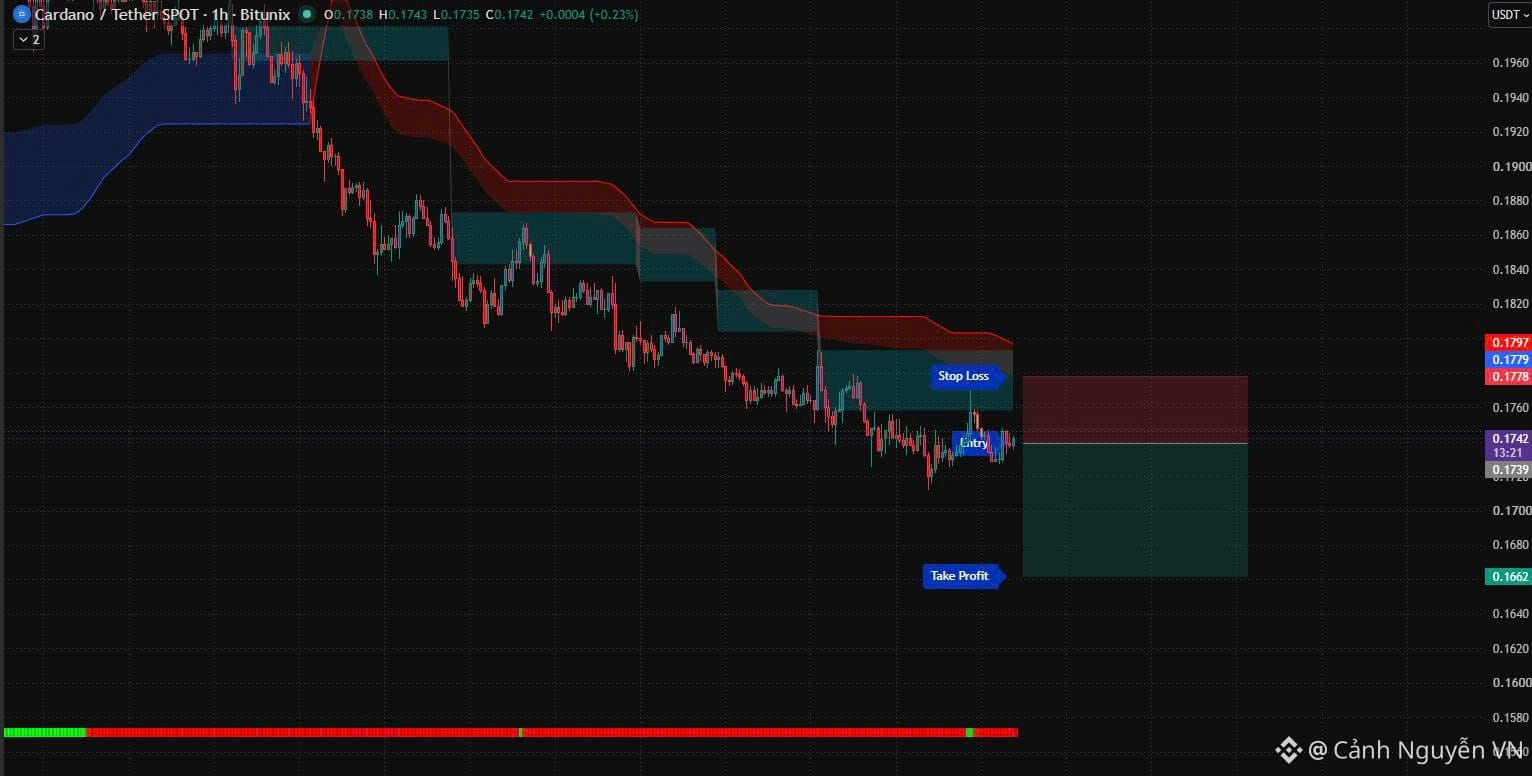
Ngฦฐแปi chฦกi hแป‡ chแป‰ bรกoฤรนa chแปฉ k cรณ chรฉn thรกnh ฤ‘รขu. Nhฦฐng ฤ‘ฦฐแปฃc cรกi lร  tแปท lแป‡ win short cao thแบญt #indicator $BTC {spot}(BTCUSDT)

Ngฦฐแปi chฦกi hแป‡ chแป‰ bรกo

ฤรนa chแปฉ k cรณ chรฉn thรกnh ฤ‘รขu. Nhฦฐng ฤ‘ฦฐแปฃc cรกi lร  tแปท lแป‡ win short cao thแบญt #indicator $BTC
ยท
--
Article
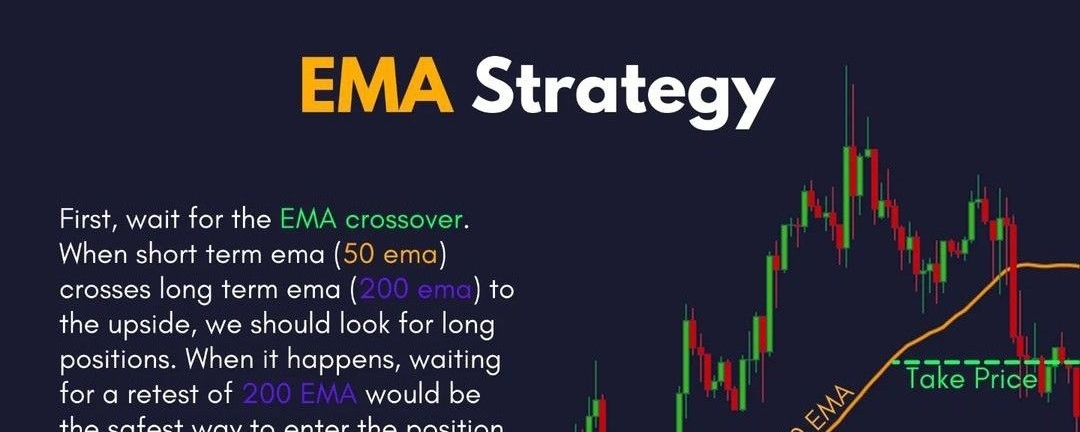
EMA CROSSOVER = FREE MONEY MOMENTWhen the 50 EMA rips above the 200 EMA, thatโ€™s your cue. Wait forthe retest, load the position, protect with a tight stop, and let the trend do the heavy lifting.$BNB #indicator

EMA CROSSOVER = FREE MONEY MOMENT

When the 50 EMA rips above the 200 EMA, thatโ€™s your cue. Wait forthe retest, load the position, protect with a tight stop, and let the trend do the heavy lifting.$BNB #indicator
ยท
--
Article
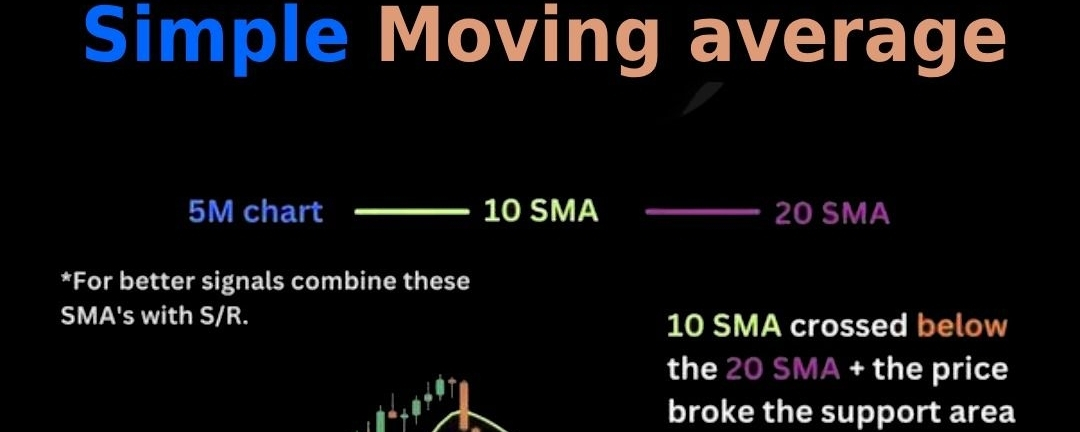
THE SMA CROSSOVER THAT PRINTS MONEYWhen the 10 SMA slices through the 20, the market isnโ€™t whispering, itโ€™s screaming direction. Combine it with S/R and you stop guessing, start sniping.$BTC #indicator

THE SMA CROSSOVER THAT PRINTS MONEY

When the 10 SMA slices through the
20, the market isnโ€™t whispering, itโ€™s
screaming direction. Combine it
with S/R and you stop guessing,
start sniping.$BTC #indicator
ยท
--
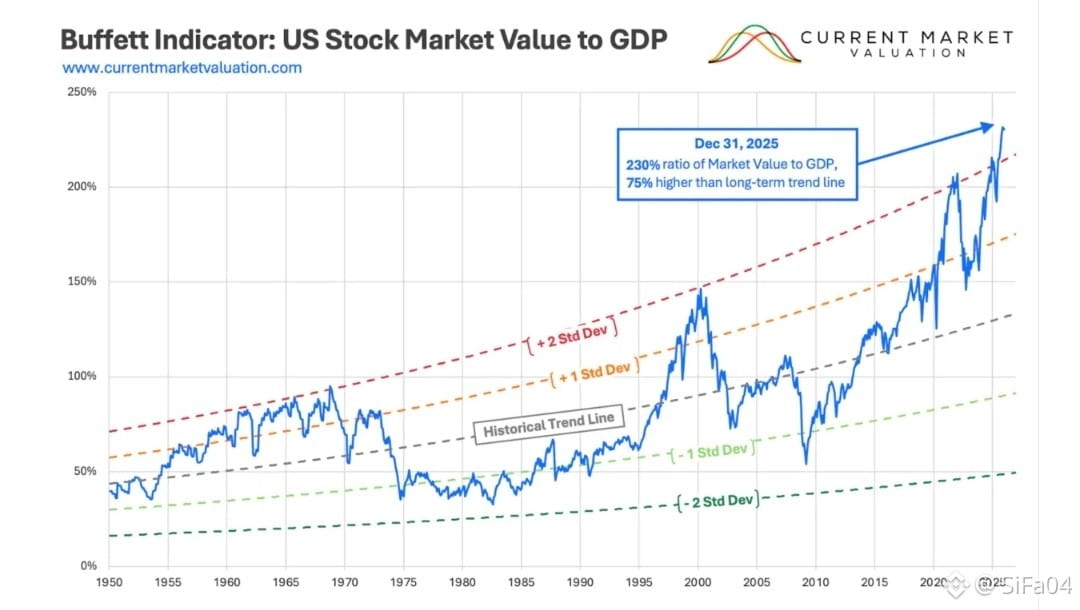
โšก Lโ€™INDICATORE DI BUFFETT รˆ ROTTO? PERCHร‰ IL โ€œTERMOMETRO DELLE BOLLEโ€ NON FUNZIONA PIร™ โšก Il celebre Buffett Indicator ha raggiunto il 230%, massimo storico, spingendo molti a parlare della piรน grande bolla di sempre. Ma cโ€™รจ un problema: questo indicatore รจ stato progettato per unโ€™economia che non esiste piรน. Il primo limite รจ strutturale: confronta la capitalizzazione globale delle aziende USA con un PIL che misura solo lโ€™economia domestica. Oggi colossi come Apple o Nvidia generano gran parte dei ricavi allโ€™estero, gonfiando il numeratore senza riflettersi nel denominatore. Inoltre, Buffett usava il GNP, non il GDP. Il GNP include i profitti globali delle aziende americane, mentre il GDP no. Questo cambiamento altera completamente le soglie storiche. Cโ€™รจ poi il tema dellโ€™economia digitale: servizi come Google, YouTube o WhatsApp creano valore enorme ma incidono poco sul PIL. Lo stesso vale per AI, software e asset intangibili, difficili da misurare. Anche i profitti aziendali sono cambiati: oggi sfiorano il 14% del PIL, contro una media storica del 7-8%. Un livello piรน alto giustifica valutazioni piรน elevate. Infine, la liquiditร  della Fed e la globalizzazione hanno distorto il rapporto. Non a caso, lโ€™indicatore segnala โ€œbollaโ€ dal 2013, mentre il mercato รจ triplicato. Questo non significa che i mercati siano sicuri. Ma che uno degli indicatori piรน usati potrebbe non essere piรน adatto al mondo moderno. #BREAKING #WarrenBuffett #indicator #market
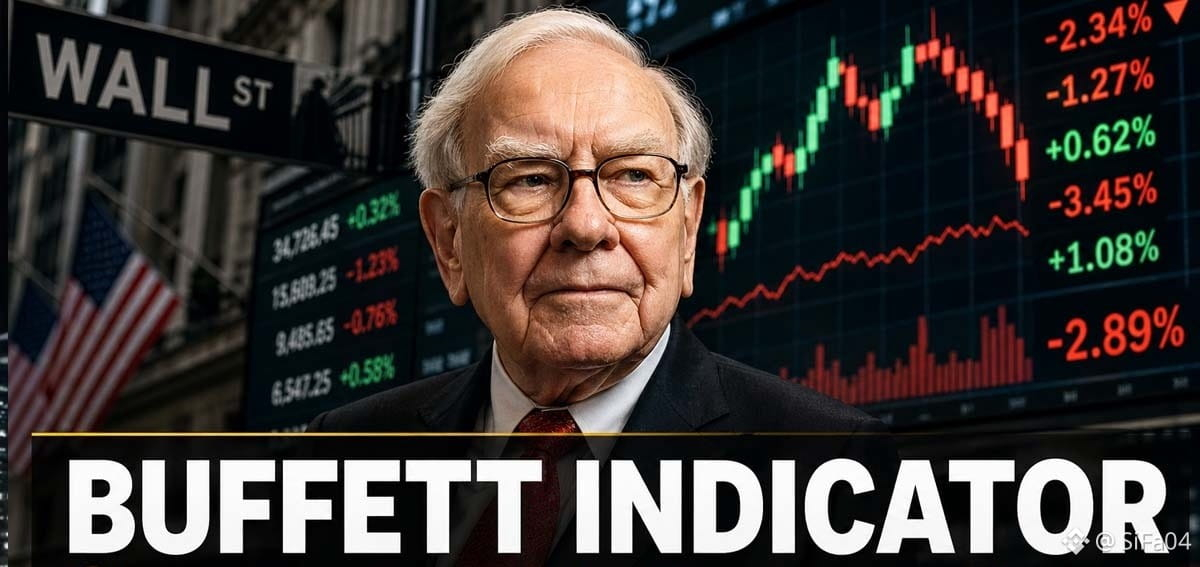
โšก Lโ€™INDICATORE DI BUFFETT รˆ ROTTO? PERCHร‰ IL โ€œTERMOMETRO DELLE BOLLEโ€ NON FUNZIONA PIร™ โšก

Il celebre Buffett Indicator ha raggiunto il 230%, massimo storico, spingendo molti a parlare della piรน grande bolla di sempre. Ma cโ€™รจ un problema: questo indicatore รจ stato progettato per unโ€™economia che non esiste piรน.

Il primo limite รจ strutturale: confronta la capitalizzazione globale delle aziende USA con un PIL che misura solo lโ€™economia domestica.
Oggi colossi come Apple o Nvidia generano gran parte dei ricavi allโ€™estero, gonfiando il numeratore senza riflettersi nel denominatore.
Inoltre, Buffett usava il GNP, non il GDP. Il GNP include i profitti globali delle aziende americane, mentre il GDP no.
Questo cambiamento altera completamente le soglie storiche.

Cโ€™รจ poi il tema dellโ€™economia digitale: servizi come Google, YouTube o WhatsApp creano valore enorme ma incidono poco sul PIL.
Lo stesso vale per AI, software e asset intangibili, difficili da misurare.
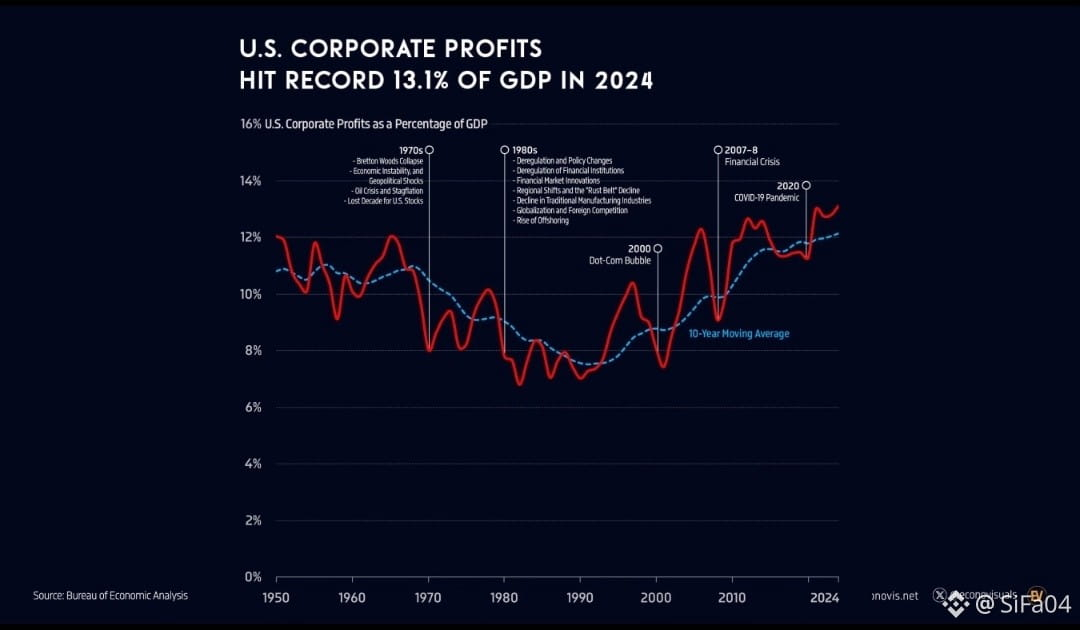
Anche i profitti aziendali sono cambiati: oggi sfiorano il 14% del PIL, contro una media storica del 7-8%.
Un livello piรน alto giustifica valutazioni piรน elevate.

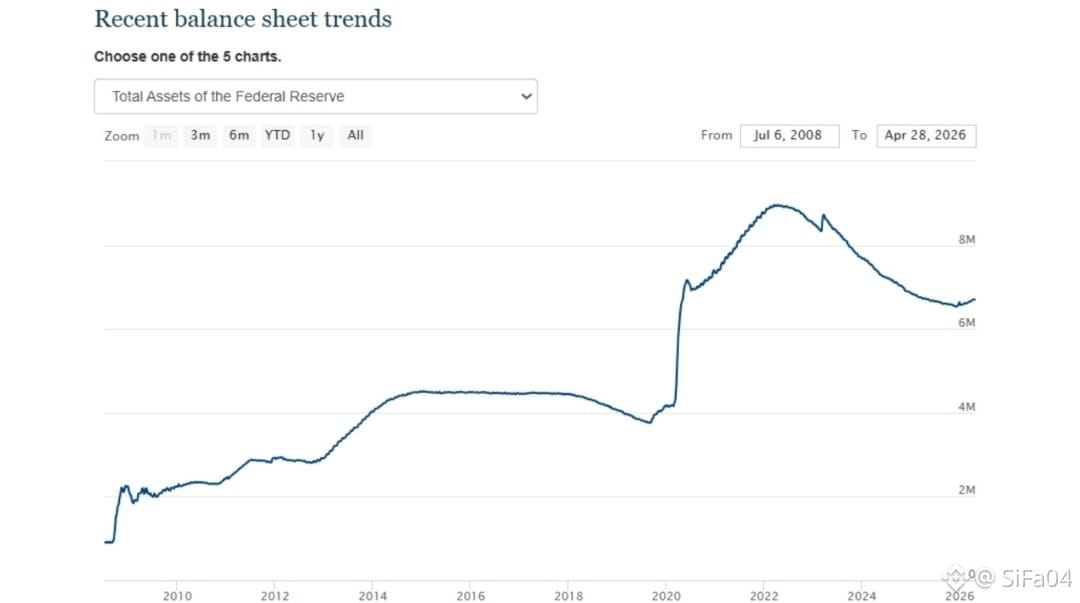
Infine, la liquiditร  della Fed e la globalizzazione hanno distorto il rapporto. Non a caso, lโ€™indicatore segnala โ€œbollaโ€ dal 2013, mentre il mercato รจ triplicato.
Questo non significa che i mercati siano sicuri.
Ma che uno degli indicatori piรน usati potrebbe non essere piรน adatto al mondo moderno.
#BREAKING #WarrenBuffett #indicator #market
ยท
--
Article
Understanding Open Interest in Crypto Trading: A Guide to Profitable StrategiesOpen Interest (OI) is a critical but often underutilized metric in the world of #CryptoTrading. This #guide will help you understand what #Openinterest is, how to use it effectively, and how to combine it with other trading instruments to enhance your trading strategy and boost profitability. What is Open Interest? Open Interest represents the total number of outstanding derivative contracts, such as futures or options, that are currently open and active. Itโ€™s a measure of the flow of money into the futures market and an #Indicator of market #Sentiments and liquidity. Why is Open Interest Important? Market Sentiment: Increasing OI suggests new money is flowing into the market, indicating a potential continuation of the current trend. Conversely, decreasing OI suggests money is leaving the market, which could signal a trend reversal.Liquidity: High OI indicates a liquid market where it is easier to enter and exit positions without significant slippage.Confirmation Tool: OI can be used to confirm trends. For instance, a price increase accompanied by rising OI suggests a strong bullish trend. How to Use Open Interest in Crypto Trading To effectively incorporate OI into your trading strategy, itโ€™s essential to combine it with other instruments and indicators. Here are some practical strategies: 1. Combining OI with Price Action Trend Confirmation: Use OI to confirm price trends. If prices are rising and OI is increasing, it suggests that the upward trend is strong and likely to continue. Conversely, if prices are rising but OI is falling, it may indicate that the trend is weakening.Divergence Analysis: Look for divergences between price and OI. For example, if the price of a cryptocurrency is rising but OI is decreasing, it could be a warning sign that the bullish trend is losing momentum. 2. OI and Volume Analysis Volume Confirmation: High trading volume alongside increasing OI can confirm the strength of a price movement. Conversely, if volume is high but OI is decreasing, it might indicate short-term speculation rather than a strong trend.Volume Spikes: Sudden spikes in volume accompanied by rising OI can signal the beginning of a new trend or the end of a consolidation phase. 3. OI and Volatility Volatility Analysis: Track changes in OI along with volatility measures like the Bollinger Bands or the Average True Range (ATR). Rising OI in a low volatility environment might signal a breakout, while high volatility with increasing OI can indicate a strong trending market.Volatility Breakouts: Use OI to identify potential breakouts. A sudden increase in OI during a period of low volatility might precede a significant price move. 4. OI and Sentiment Indicators Market Sentiment: Combine OI with sentiment indicators like the Fear and Greed Index or social media sentiment analysis to gauge the overall mood of the market. High OI during extreme greed could indicate a potential bubble, while high OI during extreme fear might present a buying opportunity.Contrarian Signals: Use OI to identify contrarian trading opportunities. For example, if OI is rising significantly in a bearish market, it might indicate that a bottom is forming. Practical Example: $RSR {spot}(RSRUSDT) Trade Analysis Let's delve into a practical example to illustrate how Open Interest can be used effectively in trading decisions. The following images and analysis provide a detailed look into an RSR/USDT trade. Example Breakdown: Step 1: Identifying Key Levels on Higher Timeframe The 4-hour chart of RSR/USDT shows a significant support level that was broken down. This breakdown indicated a potential change in trend direction from bullish to bearish. Step 2: ERKEScan Alert ERKEScan triggered an alert for a significant increase in Open Interest (OI Change 1h: 5.231). This alert indicates a substantial number of new positions being opened, suggesting strong market activity. Step 3: Zooming into Smaller Timeframes Moving into a smaller timeframe , we see that the price popped right into the newly formed resistance zone from the 4-hour breakdown level. This movement provided an ideal entry point for a short trade. The chart shows the significant spike in price followed by a quick reversal, confirming the resistance level's strength. Many positions were placed at this level, providing a high-probability trade setup. Trade Execution Based on the higher timeframe analysis and the confirmation from the OI spike, we could enter a short trade on RSR at the resistance level. The trade benefits from the confirmation of increased OI and the price action aligning with our higher timeframe analysis. Using ERKEScan's Top10 Leaderboard to Filter Fake Signals To avoid being misled by fake OI signals, you can use ERKEScan's Top10 leaderboard feature. This tool shows the top 10 tokens with the highest Open Interest increases, allowing you to filter out any anomalies or false signals. By focusing on the tokens with the most significant OI changes, you can make more informed trading decisions and enhance your strategy's effectiveness. Conclusion Open Interest is a powerful tool that, when used correctly, can provide valuable insights into market sentiment, liquidity, and potential price movements. By combining OI with other trading instruments such as price action, volume, volatility, and sentiment indicators, you can develop a robust trading strategy that enhances your profitability in the crypto market. As you refine your strategy, consider using advanced tools and platforms that offer real-time OI data and customizable alerts, like the ErkeScan crypto screener. By leveraging these resources, you can stay ahead of the market and make more informed trading decisions. With these strategies, you'll be well-equipped to incorporate Open Interest into your trading arsenal and improve your chances of success in the dynamic world of crypto trading.

Understanding Open Interest in Crypto Trading: A Guide to Profitable Strategies

Open Interest (OI) is a critical but often underutilized metric in the world of #CryptoTrading. This #guide will help you understand what #Openinterest is, how to use it effectively, and how to combine it with other trading instruments to enhance your trading strategy and boost profitability.
What is Open Interest?
Open Interest represents the total number of outstanding derivative contracts, such as futures or options, that are currently open and active. Itโ€™s a measure of the flow of money into the futures market and an #Indicator of market #Sentiments and liquidity.
Why is Open Interest Important?
Market Sentiment: Increasing OI suggests new money is flowing into the market, indicating a potential continuation of the current trend. Conversely, decreasing OI suggests money is leaving the market, which could signal a trend reversal.Liquidity: High OI indicates a liquid market where it is easier to enter and exit positions without significant slippage.Confirmation Tool: OI can be used to confirm trends. For instance, a price increase accompanied by rising OI suggests a strong bullish trend.
How to Use Open Interest in Crypto Trading
To effectively incorporate OI into your trading strategy, itโ€™s essential to combine it with other instruments and indicators. Here are some practical strategies:
1. Combining OI with Price Action
Trend Confirmation: Use OI to confirm price trends. If prices are rising and OI is increasing, it suggests that the upward trend is strong and likely to continue. Conversely, if prices are rising but OI is falling, it may indicate that the trend is weakening.Divergence Analysis: Look for divergences between price and OI. For example, if the price of a cryptocurrency is rising but OI is decreasing, it could be a warning sign that the bullish trend is losing momentum.
2. OI and Volume Analysis
Volume Confirmation: High trading volume alongside increasing OI can confirm the strength of a price movement. Conversely, if volume is high but OI is decreasing, it might indicate short-term speculation rather than a strong trend.Volume Spikes: Sudden spikes in volume accompanied by rising OI can signal the beginning of a new trend or the end of a consolidation phase.
3. OI and Volatility
Volatility Analysis: Track changes in OI along with volatility measures like the Bollinger Bands or the Average True Range (ATR). Rising OI in a low volatility environment might signal a breakout, while high volatility with increasing OI can indicate a strong trending market.Volatility Breakouts: Use OI to identify potential breakouts. A sudden increase in OI during a period of low volatility might precede a significant price move.
4. OI and Sentiment Indicators
Market Sentiment: Combine OI with sentiment indicators like the Fear and Greed Index or social media sentiment analysis to gauge the overall mood of the market. High OI during extreme greed could indicate a potential bubble, while high OI during extreme fear might present a buying opportunity.Contrarian Signals: Use OI to identify contrarian trading opportunities. For example, if OI is rising significantly in a bearish market, it might indicate that a bottom is forming.
Practical Example: $RSR
Trade Analysis
Let's delve into a practical example to illustrate how Open Interest can be used effectively in trading decisions. The following images and analysis provide a detailed look into an RSR/USDT trade.
Example Breakdown:
Step 1: Identifying Key Levels on Higher Timeframe
The 4-hour chart of RSR/USDT shows a significant support level that was broken down. This breakdown indicated a potential change in trend direction from bullish to bearish.
Step 2: ERKEScan Alert
ERKEScan triggered an alert for a significant increase in Open Interest (OI Change 1h: 5.231). This alert indicates a substantial number of new positions being opened, suggesting strong market activity.
Step 3: Zooming into Smaller Timeframes
Moving into a smaller timeframe , we see that the price popped right into the newly formed resistance zone from the 4-hour breakdown level. This movement provided an ideal entry point for a short trade.
The chart shows the significant spike in price followed by a quick reversal, confirming the resistance level's strength. Many positions were placed at this level, providing a high-probability trade setup.
Trade Execution
Based on the higher timeframe analysis and the confirmation from the OI spike, we could enter a short trade on RSR at the resistance level. The trade benefits from the confirmation of increased OI and the price action aligning with our higher timeframe analysis.
Using ERKEScan's Top10 Leaderboard to Filter Fake Signals
To avoid being misled by fake OI signals, you can use ERKEScan's Top10 leaderboard feature. This tool shows the top 10 tokens with the highest Open Interest increases, allowing you to filter out any anomalies or false signals. By focusing on the tokens with the most significant OI changes, you can make more informed trading decisions and enhance your strategy's effectiveness.
Conclusion
Open Interest is a powerful tool that, when used correctly, can provide valuable insights into market sentiment, liquidity, and potential price movements. By combining OI with other trading instruments such as price action, volume, volatility, and sentiment indicators, you can develop a robust trading strategy that enhances your profitability in the crypto market.
As you refine your strategy, consider using advanced tools and platforms that offer real-time OI data and customizable alerts, like the ErkeScan crypto screener. By leveraging these resources, you can stay ahead of the market and make more informed trading decisions.
With these strategies, you'll be well-equipped to incorporate Open Interest into your trading arsenal and improve your chances of success in the dynamic world of crypto trading.
ยท
--
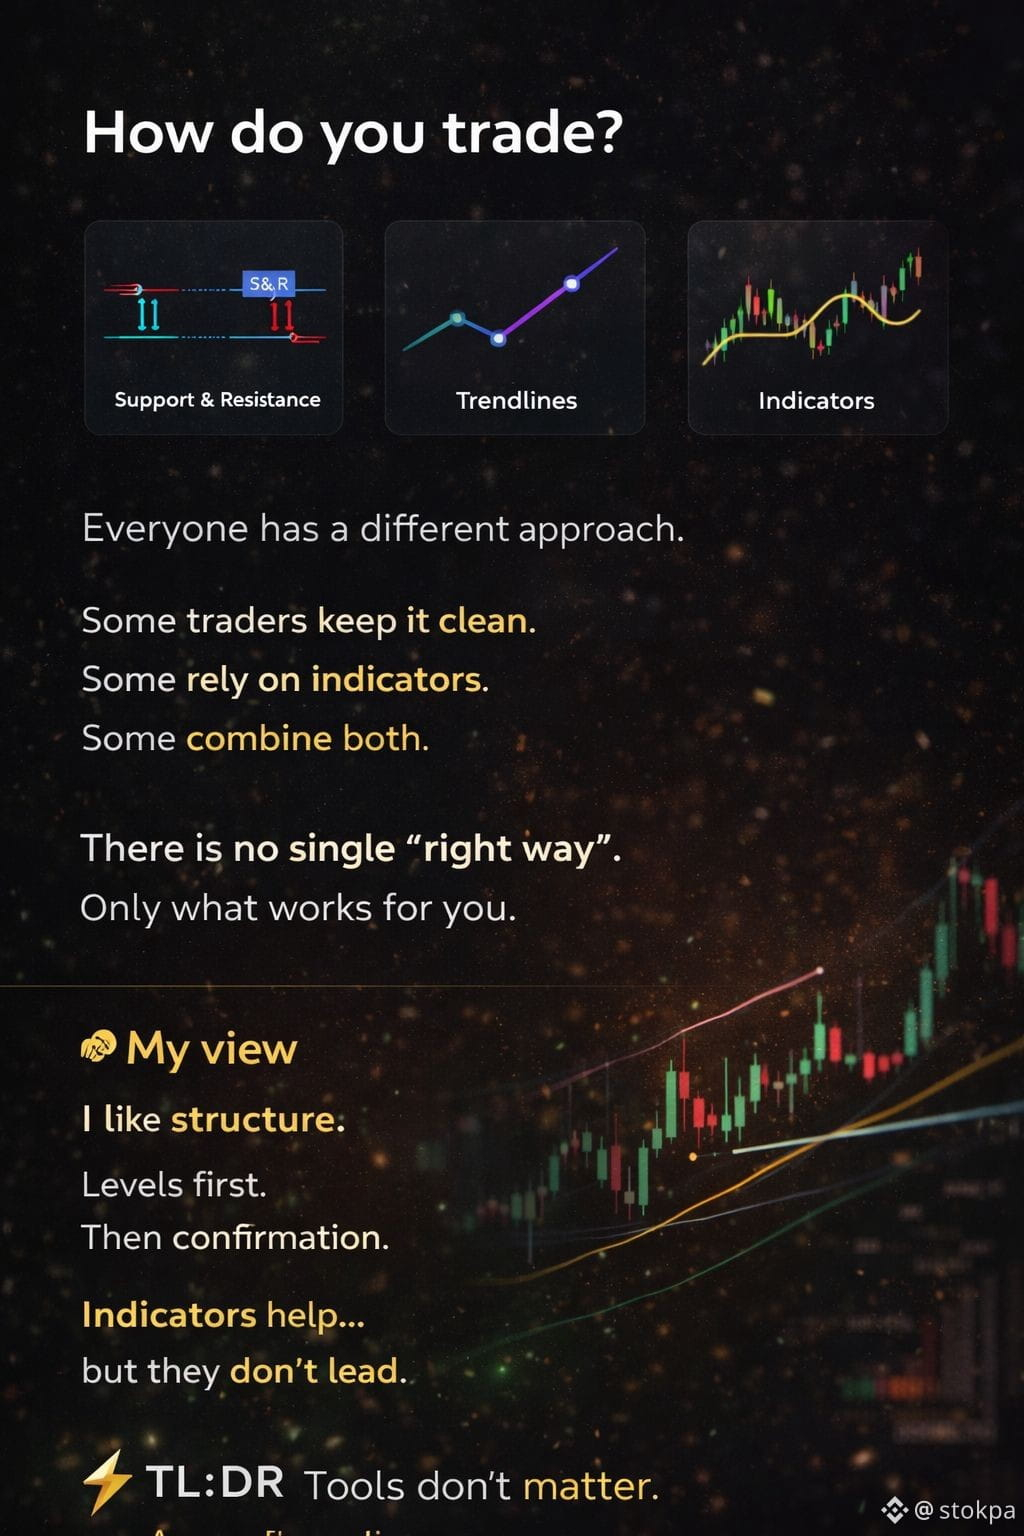
How do you trade? Do you use: Support & Resistance? Trendlines? Indicators? Everyone has a different approach. Some traders keep it clean. Some rely on indicators. Some combine both. There is no single โ€œright wayโ€. Only what works for you. ๐Ÿง  My view I like structure. Levels first. Then confirmation. Indicators helpโ€ฆ but they donโ€™t lead. โšก TL;DR Tools donโ€™t matter. Execution does. ๐Ÿ‘‰ Whatโ€™s your favorite indicator? Coments are welcome... #indicator #trading
How do you trade?

Do you use:
Support & Resistance?
Trendlines?
Indicators?
Everyone has a different approach.
Some traders keep it clean.
Some rely on indicators.
Some combine both.
There is no single โ€œright wayโ€.
Only what works for you.

๐Ÿง  My view
I like structure.
Levels first.
Then confirmation.
Indicators helpโ€ฆ
but they donโ€™t lead.

โšก TL;DR
Tools donโ€™t matter.
Execution does.

๐Ÿ‘‰ Whatโ€™s your favorite indicator?

Coments are welcome...
#indicator #trading
Article
Indicadores de trading: quais sรฃo os principais e como usรก-los a seu favor?Os indicadores de trading sรฃo ferramentas fundamentais para quem busca tomar decisรตes baseadas em dados nos mercados financeiros. Eles utilizam cรกlculos matemรกticos aplicados aos preรงos, volumes e outros fatores de mercado para trazer informaรงรตes relevantes sobre tendรชncias, momento, volatilidade e forรงa das movimentaรงรตes de ativos. $LAB Ao serem aplicados em grรกficos, os indicadores ajudam osย tradersย a identificar oportunidades, confirmar sinais de entrada e saรญda e gerenciar riscos de forma mais eficiente. Entender como funcionam e quais sรฃo os mais utilizados รฉ um passo essencial para aprimorar estratรฉgias de negociaรงรฃo. Por isso, neste artigo vamos te mostrar os principais indicadores de trading e como utilizรก-los a seu favor nas operaรงรตes. Vamos lรก? O que sรฃo indicadores de trading? $NFP Indicadores de trading sรฃoย ferramentas utilizadas por traders para analisar o comportamento do mercado financeiro e tomar decisรตes sobre compra e venda de ativos. Esses indicadores sรฃo baseados em cรกlculos matemรกticos aplicados a dados histรณricos de preรงos, volume ou outros fatores relacionados ao mercado. Isso significa que eles fazem parte daย Anรกlise Tรฉcnica. Eles ajudam a identificar tendรชncias, pontos de reversรฃo, nรญveis de suporte e resistรชncia, alรฉm de fornecer informaรงรตes importantes sobre a forรงa do mercado ou sobre possรญveis movimentos futuros. Os principais indicadores de trading podem ser divididos em 5 categorias: Indicadores de tendรชncia: identificam a direรงรฃo geral do mercado. Exemplos: Mรฉdia Mรณvel, MACD.Indicadores de momento: medem a forรงa de um movimento de preรงo. Exemplos: IFR (รndice de Forรงa Relativa) eย estocรกstico.Indicadores de volatilidade: avaliam o grau de variaรงรฃo dos preรงos em determinado perรญodo. Exemplo: Bandas de Bollinger.Indicadores de volume: analisam o volume negociado para identificar a forรงa de uma tendรชncia. Exemplo: OBV (On Balance Volume).Indicadores de suporte e resistรชncia: apontam possรญveis zonas onde o preรงo pode parar ou reverter. Exemplos:ย pontos de pivรด, retraรงรฃo de Fibonacci. Principais indicadores de trading Para vocรช saber por onde pode comeรงar a estudar os principais indicadores de trading, selecionamos os mais utilizados porย traders profissionais. Alรฉm disso, vocรช pode conferir artigos especรญficos sobre cada um dos principais indicadores, com explicaรงรตes completas para vocรช se aprofundar neles. Vamos lรก? 1. Mรฉdia mรณvel A mรฉdia mรณvel รฉ uma ferramenta que suaviza os preรงos ao longo de um perรญodo definido, ajudando a identificar tendรชncias. Existem dois tipos principais: Mรฉdia Mรณvel Simples: calcula a mรฉdia dos preรงos em um perรญodo especรญfico (exemplo: 10 dias).Mรฉdia Mรณvel Exponencial: dรก mais peso aos preรงos recentes, reagindo mais rรกpido ร s mudanรงas. O cruzamento de mรฉdias (curta e longa) sinaliza compra ou venda. Se o preรงo estiver acima da mรฉdia, sugere tendรชncia de alta; abaixo, tendรชncia de baixa. 2. Bandas de Bollinger As Bandas de Bollinger consistem em trรชs linhas: Mรฉdia mรณvel central:ย base para as bandas.Bandas superior e inferior: calculadas com base naย volatilidadeย (desvio padrรฃo). Dessa forma, quando o preรงo atinge a banda superior, pode indicar sobrecompra; na inferior, sobrevenda. 3. MACD O MACD mede a diferenรงa entre duas mรฉdias mรณveis exponenciais (geralmente de 12 e 26 perรญodos). Ele inclui: Linha MACD: diferenรงa entre as mรฉdias mรณveis.Linha de sinal: mรฉdia mรณvel da linha MACD.Histograma: diferenรงa entre a linha MACD e a linha de sinal. Assim, o cruzamento da linha MACD com a linha de sinal indica compra ou venda. O histograma positivo sugere alta; jรก o negativo sugere baixa. 4. รndice de Forรงa Relativa (IFR) O รndice de Forรงa Relativa (IFR) mede a forรงa dos movimentos de alta e baixa em um intervalo de 0 a 100. IFR acima de 70 indica sobrecompra (possรญvel reversรฃo para baixa).IFR abaixo de 30 indica sobrevenda (possรญvel reversรฃo para alta). Jรก as divergรชncias entre o IFR e o preรงo podem sinalizar reversรตes. 5. Estocรกstico lento e estocรกstico rรกpido O Estocรกstico compara o preรงo de fechamento com a faixa de preรงos em um perรญodo especรญfico. Estocรกstico rรกpido: reage rapidamente ร s mudanรงas de preรงo.Estocรกstico lento: รฉ suavizado para reduzir ruรญdos. Valores acima de 80 indicam sobrecompra; abaixo de 20, sobrevenda. Ademais, o cruzamento das linhas %K e %D sinaliza compra ou venda. 6. Retraรงรฃo de Fibonacci Baseia-se nos nรญveis de retraรงรฃo (%), como 38,2%, 50% e 61,8%, que sรฃo usados para identificar possรญveis zonas deย suporte e resistรชncia. Apรณs um movimento significativo, o preรงo frequentemente โ€œretraiโ€ para um desses nรญveis antes de continuar na direรงรฃo original. 7. On Balance Volume (OBV) O On Balance Volume (OBV) mede a forรงa de uma tendรชncia por meio da avaliaรงรฃo do volume de negociaรงรตes. Assim, ele funciona somando o volume de negociaรงรตes em dias em que o preรงo aumenta e subtraindo o volume em dias em que o preรงo cai. 8. Nuvem de Ichimoku ร‰ um indicador multifuncional que identifica suporte, resistรชncia, tendรชncia e forรงa do mercado. Ele inclui: Linha Tenkan-sen e Kijun-sen: mรฉdias mรณveis de curto e mรฉdio prazo.Senkou Span A e B: criam a โ€œnuvemโ€, projetando suporte ou resistรชncia futura.Linha Chikou Span: preรงo atrasado (lagging). Se o preรงo estiver acima da nuvem, hรก tendรชncia de alta; abaixo, tendรชncia de baixa. Os cruzamentos das linhas Tenkan e Kijun geram sinais de compra e venda. 9. Oscilador de preรงo percentual (PPO) Esse รฉ um indicador de momentum que leva em conta a diferenรงa entre duas mรฉdias mรณveis. Ela รฉ usada para avaliar a tendรชncia de um ativo. O cรกlculo do PPO leva a diferenรงa entre uma mรฉdia mรณvel de curto prazo e outra de longo prazo. 10. Volume de balanรงo (OBV) Esse รฉ um indicador baseado no volume de negociaรงรฃo para medir a pressรฃo de compra e venda de um ativo. Ou seja, ele calcula a atividade comercial acumulada de compradores e vendedores. Ele foi criado por Joseph Granville e รฉ รบtil para perceber o movimento de grandes investidores e prever mudanรงas na direรงรฃo do mercado. Quais indicadores tรฉcnicos aprender primeiro? Se vocรช estรก comeรงando no trading, รฉ ideal comeรงar com os indicadores tรฉcnicos mais simples e bastante utilizados, que ajudam a entender tendรชncias, forรงa do mercado e pontos de reversรฃo. Como citamos anteriormente, as mรฉdias mรณveis sรฃo simples de entender e ajudam a identificar a tendรชncia geral do mercado. Jรก o IFR mostra rapidamente condiรงรตes de sobrecompra ou sobrevenda, sendo fรกcil de interpretar e pode ser combinado com outros indicadores. O MACD combina a anรกlise de tendรชncia e momento, sendo visual e prรกtico para identificar sinais de compra e venda. Por fim, o OBV mostra o interesse dos participantes do mercado em determinada movimentaรงรฃo de preรงos, ajudando a confirmar tendรชncias (mais volume = tendรชncia mais forte). $B {future}(UBUSDT) {future}(LABUSDT) {future}(BUSDT) #trading #analysis #StrategicTrading #MACD #indicator

Indicadores de trading: quais sรฃo os principais e como usรก-los a seu favor?

Os indicadores de trading sรฃo ferramentas fundamentais para quem busca tomar decisรตes baseadas em dados nos mercados financeiros.
Eles utilizam cรกlculos matemรกticos aplicados aos preรงos, volumes e outros fatores de mercado para trazer informaรงรตes relevantes sobre tendรชncias, momento, volatilidade e forรงa das movimentaรงรตes de ativos.
$LAB Ao serem aplicados em grรกficos, os indicadores ajudam os traders a identificar oportunidades, confirmar sinais de entrada e saรญda e gerenciar riscos de forma mais eficiente.
Entender como funcionam e quais sรฃo os mais utilizados รฉ um passo essencial para aprimorar estratรฉgias de negociaรงรฃo.
Por isso, neste artigo vamos te mostrar os principais indicadores de trading e como utilizรก-los a seu favor nas operaรงรตes. Vamos lรก?
O que sรฃo indicadores de trading? $NFP
Indicadores de trading sรฃo ferramentas utilizadas por traders para analisar o comportamento do mercado financeiro e tomar decisรตes sobre compra e venda de ativos.
Esses indicadores sรฃo baseados em cรกlculos matemรกticos aplicados a dados histรณricos de preรงos, volume ou outros fatores relacionados ao mercado. Isso significa que eles fazem parte da Anรกlise Tรฉcnica.
Eles ajudam a identificar tendรชncias, pontos de reversรฃo, nรญveis de suporte e resistรชncia, alรฉm de fornecer informaรงรตes importantes sobre a forรงa do mercado ou sobre possรญveis movimentos futuros.
Os principais indicadores de trading podem ser divididos em 5 categorias:
Indicadores de tendรชncia: identificam a direรงรฃo geral do mercado. Exemplos: Mรฉdia Mรณvel, MACD.Indicadores de momento: medem a forรงa de um movimento de preรงo. Exemplos: IFR (รndice de Forรงa Relativa) e estocรกstico.Indicadores de volatilidade: avaliam o grau de variaรงรฃo dos preรงos em determinado perรญodo. Exemplo: Bandas de Bollinger.Indicadores de volume: analisam o volume negociado para identificar a forรงa de uma tendรชncia. Exemplo: OBV (On Balance Volume).Indicadores de suporte e resistรชncia: apontam possรญveis zonas onde o preรงo pode parar ou reverter. Exemplos: pontos de pivรด, retraรงรฃo de Fibonacci.
Principais indicadores de trading
Para vocรช saber por onde pode comeรงar a estudar os principais indicadores de trading, selecionamos os mais utilizados por traders profissionais.
Alรฉm disso, vocรช pode conferir artigos especรญficos sobre cada um dos principais indicadores, com explicaรงรตes completas para vocรช se aprofundar neles. Vamos lรก?
1. Mรฉdia mรณvel
A mรฉdia mรณvel รฉ uma ferramenta que suaviza os preรงos ao longo de um perรญodo definido, ajudando a identificar tendรชncias.
Existem dois tipos principais:
Mรฉdia Mรณvel Simples: calcula a mรฉdia dos preรงos em um perรญodo especรญfico (exemplo: 10 dias).Mรฉdia Mรณvel Exponencial: dรก mais peso aos preรงos recentes, reagindo mais rรกpido ร s mudanรงas.
O cruzamento de mรฉdias (curta e longa) sinaliza compra ou venda. Se o preรงo estiver acima da mรฉdia, sugere tendรชncia de alta; abaixo, tendรชncia de baixa.
2. Bandas de Bollinger
As Bandas de Bollinger consistem em trรชs linhas:
Mรฉdia mรณvel central: base para as bandas.Bandas superior e inferior: calculadas com base na volatilidade (desvio padrรฃo).
Dessa forma, quando o preรงo atinge a banda superior, pode indicar sobrecompra; na inferior, sobrevenda.
3. MACD
O MACD mede a diferenรงa entre duas mรฉdias mรณveis exponenciais (geralmente de 12 e 26 perรญodos). Ele inclui:
Linha MACD: diferenรงa entre as mรฉdias mรณveis.Linha de sinal: mรฉdia mรณvel da linha MACD.Histograma: diferenรงa entre a linha MACD e a linha de sinal.
Assim, o cruzamento da linha MACD com a linha de sinal indica compra ou venda. O histograma positivo sugere alta; jรก o negativo sugere baixa.
4. รndice de Forรงa Relativa (IFR)
O รndice de Forรงa Relativa (IFR) mede a forรงa dos movimentos de alta e baixa em um intervalo de 0 a 100.
IFR acima de 70 indica sobrecompra (possรญvel reversรฃo para baixa).IFR abaixo de 30 indica sobrevenda (possรญvel reversรฃo para alta).
Jรก as divergรชncias entre o IFR e o preรงo podem sinalizar reversรตes.
5. Estocรกstico lento e estocรกstico rรกpido
O Estocรกstico compara o preรงo de fechamento com a faixa de preรงos em um perรญodo especรญfico.
Estocรกstico rรกpido: reage rapidamente ร s mudanรงas de preรงo.Estocรกstico lento: รฉ suavizado para reduzir ruรญdos.
Valores acima de 80 indicam sobrecompra; abaixo de 20, sobrevenda. Ademais, o cruzamento das linhas %K e %D sinaliza compra ou venda.
6. Retraรงรฃo de Fibonacci
Baseia-se nos nรญveis de retraรงรฃo (%), como 38,2%, 50% e 61,8%, que sรฃo usados para identificar possรญveis zonas de suporte e resistรชncia.
Apรณs um movimento significativo, o preรงo frequentemente โ€œretraiโ€ para um desses nรญveis antes de continuar na direรงรฃo original.
7. On Balance Volume (OBV)
O On Balance Volume (OBV) mede a forรงa de uma tendรชncia por meio da avaliaรงรฃo do volume de negociaรงรตes.
Assim, ele funciona somando o volume de negociaรงรตes em dias em que o preรงo aumenta e subtraindo o volume em dias em que o preรงo cai.
8. Nuvem de Ichimoku
ร‰ um indicador multifuncional que identifica suporte, resistรชncia, tendรชncia e forรงa do mercado. Ele inclui:
Linha Tenkan-sen e Kijun-sen: mรฉdias mรณveis de curto e mรฉdio prazo.Senkou Span A e B: criam a โ€œnuvemโ€, projetando suporte ou resistรชncia futura.Linha Chikou Span: preรงo atrasado (lagging).
Se o preรงo estiver acima da nuvem, hรก tendรชncia de alta; abaixo, tendรชncia de baixa. Os cruzamentos das linhas Tenkan e Kijun geram sinais de compra e venda.
9. Oscilador de preรงo percentual (PPO)
Esse รฉ um indicador de momentum que leva em conta a diferenรงa entre duas mรฉdias mรณveis. Ela รฉ usada para avaliar a tendรชncia de um ativo.
O cรกlculo do PPO leva a diferenรงa entre uma mรฉdia mรณvel de curto prazo e outra de longo prazo.
10. Volume de balanรงo (OBV)
Esse รฉ um indicador baseado no volume de negociaรงรฃo para medir a pressรฃo de compra e venda de um ativo. Ou seja, ele calcula a atividade comercial acumulada de compradores e vendedores.
Ele foi criado por Joseph Granville e รฉ รบtil para perceber o movimento de grandes investidores e prever mudanรงas na direรงรฃo do mercado.
Quais indicadores tรฉcnicos aprender primeiro?
Se vocรช estรก comeรงando no trading, รฉ ideal comeรงar com os indicadores tรฉcnicos mais simples e bastante utilizados, que ajudam a entender tendรชncias, forรงa do mercado e pontos de reversรฃo.
Como citamos anteriormente, as mรฉdias mรณveis sรฃo simples de entender e ajudam a identificar a tendรชncia geral do mercado.
Jรก o IFR mostra rapidamente condiรงรตes de sobrecompra ou sobrevenda, sendo fรกcil de interpretar e pode ser combinado com outros indicadores.
O MACD combina a anรกlise de tendรชncia e momento, sendo visual e prรกtico para identificar sinais de compra e venda.
Por fim, o OBV mostra o interesse dos participantes do mercado em determinada movimentaรงรฃo de preรงos, ajudando a confirmar tendรชncias (mais volume = tendรชncia mais forte). $B
#trading #analysis #StrategicTrading #MACD #indicator
ยท
--
Bearish
๐Ÿ“‰ Premium Index Can Show a Dump Before Price Does Most traders watch candles. If price is flat, they think nothing is changing. But the skew often starts earlier. What premium index shows ๐Ÿ“‰ Premium index is the gap between futures and spot. When futures start losing strength against spot, it usually means leveraged demand is weakening. Price can still look stable. The internal pressure is already shifting. Where traders get trapped The usual trap looks like this: ๐Ÿ“ price holds in a range or keeps grinding slightly higher ๐Ÿ“ open interest grows ๐Ÿ“ premium index fades ๐Ÿ“ then the flush starts That setup often ends with long liquidations. The market still looks โ€œfineโ€ on the chart. But derivatives are already losing conviction. How I use it Premium index is not an entry trigger by itself. It is a filter. If premium is weakening, I stop looking for late longs. Then I wait for confirmation: local structure break, seller pressure, liquidations, failed bounce. That is where the trade starts making sense. Why it matters Good trades are often built by avoiding bad entries first. You do not need to guess the exact top. You need to see when upside is getting weaker while most people still read the chart as neutral. That is where premium index becomes useful. In Crypto Resources, we read it together with open interest, liquidations, and market phase. When all of them lean in one direction, the picture gets much cleaner Manual traders usually notice the dump after the candle expands. Premium index can show the crack earlier. โš™๏ธ #PREMIUM_SIGNAL #indicator $BASED
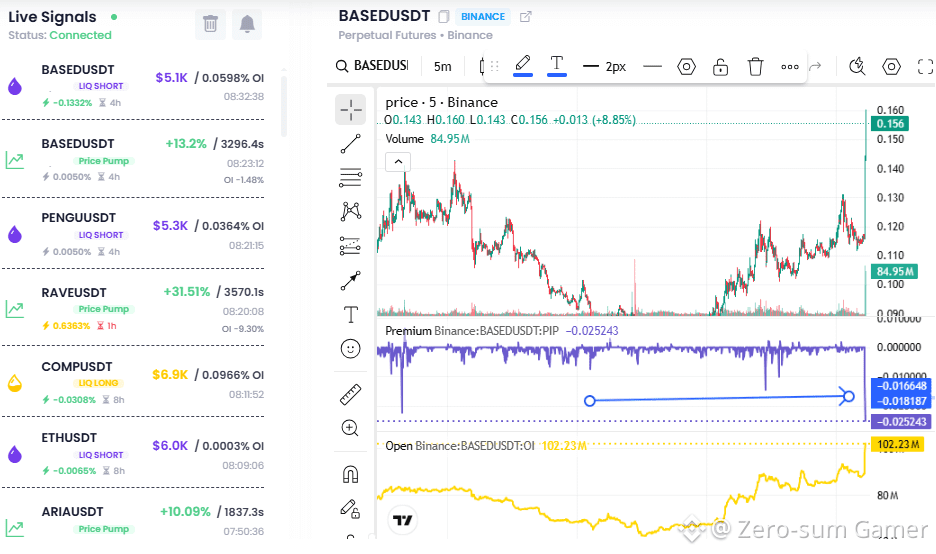
๐Ÿ“‰ Premium Index Can Show a Dump Before Price Does

Most traders watch candles.
If price is flat, they think nothing is changing.
But the skew often starts earlier.

What premium index shows ๐Ÿ“‰
Premium index is the gap between futures and spot.

When futures start losing strength against spot, it usually means leveraged demand is weakening.

Price can still look stable.
The internal pressure is already shifting.

Where traders get trapped
The usual trap looks like this:

๐Ÿ“ price holds in a range or keeps grinding slightly higher
๐Ÿ“ open interest grows
๐Ÿ“ premium index fades
๐Ÿ“ then the flush starts

That setup often ends with long liquidations.
The market still looks โ€œfineโ€ on the chart.
But derivatives are already losing conviction.
How I use it

Premium index is not an entry trigger by itself.

It is a filter.
If premium is weakening, I stop looking for late longs.

Then I wait for confirmation: local structure break, seller pressure, liquidations, failed bounce.
That is where the trade starts making sense.

Why it matters
Good trades are often built by avoiding bad entries first.

You do not need to guess the exact top.

You need to see when upside is getting weaker while most people still read the chart as neutral.
That is where premium index becomes useful.

In Crypto Resources, we read it together with open interest, liquidations, and market phase.

When all of them lean in one direction, the picture gets much cleaner
Manual traders usually notice the dump after the candle expands.
Premium index can show the crack earlier. โš™๏ธ
#PREMIUM_SIGNAL #indicator $BASED
ยท
--
Article
EMA CROSS ALERT ๐Ÿ”ฅWhen EMA50 dives belowEMA200, itโ€™s a signal traders canโ€™tignore. Watch for the pullback near EMA50, thatโ€™s your entry forthe bearish move.$BTC #indicator

EMA CROSS ALERT ๐Ÿ”ฅ

When EMA50 dives belowEMA200, itโ€™s a signal traders canโ€™tignore. Watch for the pullback
near EMA50, thatโ€™s your entry forthe bearish move.$BTC #indicator
#Openinterest #indicator #Write2Earn #Squar2earn #Secret_Tools {future}(RAVEUSDT) $RAVE ะฟั€ะพัั‚ะธะน ั‚ะฐ ะตะปะตะผะตะฝั‚ะฐั€ะฝะธะน ะฟั€ะธะบะปะฐะด ะฝะฐ ัƒะฒะฐะถะฝั–ัั‚ัŒ ั‚ะฐ ัะฟะพัั‚ะตั€ะตะถะปะธะฒั–ัั‚ัŒ. ะฒั–ะดะบั€ะธะนั‚ะต ัƒ ัะตะฑะต ะฑัƒะดัŒ-ัะบะธะน ะณั€ะฐั„ั–ะบ ั‚ะฐ ะฟั€ะพะปะธัั‚ะฐะนั‚ะต ะฝะฐ ั€ั–ะทะฝะธั… ั‚ะฐะนะผั„ั€ะตะนะผะฐั… . ะฝะฐ 5ั…ะฒ Open Interest ะบะพะปะธ ะทะฝะฐั…ะพะดะธั‚ัŒัั: - ะท ัะฐะผะพะณะพ ะฝะธะทัƒ- ะผะพะถะปะธะฒะธะน ะฒั–ัะดะบะพะบ ั‡ะธ ั‚ะธะผั‡ะฐัะพะฒะธะน ั€ะพะทะฒะพั€ะพั‚ - ะท ัะฐะผะพะณะพ ะฒะตั€ั…ัƒ, ะฝะฐะด ะพะฑ'ั”ะผะฐะผะธ ะทะฝะฐั‡ะธั‚ัŒ ะฝะฐะฑะธั€ะฐัŽั‚ัŒัั ัˆะพั€ั‚ะธ ะฟั€ะธ ั†ัŒะพะผัƒ ั–ะฝะพะดั– ั‚ะธะผั‡ะฐัะพะฒะพ ะผะพะถะต ะฑัƒั‚ะธ ั€ั–ัั‚ ั†ั–ะฝ ะฝะฐะนะบั€ะฐั‰ะธะน ะฒั…ั–ะด ะฒ ะฟะพะทะธั†ั–ัŽ ะถ: โ†’ะท ัะฐะผะพะณะพ ะฒะตั€ั…ัƒ ะฒ ะจะพั€ั‚ โ†’ะท ัะฐะผะพะณะพ ะฝะธะทัƒ ะฒ ะ›ะพะฝะณ p.s. good night ))
#Openinterest #indicator #Write2Earn #Squar2earn #Secret_Tools

$RAVE

ะฟั€ะพัั‚ะธะน ั‚ะฐ ะตะปะตะผะตะฝั‚ะฐั€ะฝะธะน ะฟั€ะธะบะปะฐะด ะฝะฐ ัƒะฒะฐะถะฝั–ัั‚ัŒ ั‚ะฐ ัะฟะพัั‚ะตั€ะตะถะปะธะฒั–ัั‚ัŒ.

ะฒั–ะดะบั€ะธะนั‚ะต ัƒ ัะตะฑะต ะฑัƒะดัŒ-ัะบะธะน ะณั€ะฐั„ั–ะบ ั‚ะฐ ะฟั€ะพะปะธัั‚ะฐะนั‚ะต ะฝะฐ ั€ั–ะทะฝะธั… ั‚ะฐะนะผั„ั€ะตะนะผะฐั… .

ะฝะฐ 5ั…ะฒ Open Interest ะบะพะปะธ ะทะฝะฐั…ะพะดะธั‚ัŒัั:
- ะท ัะฐะผะพะณะพ ะฝะธะทัƒ- ะผะพะถะปะธะฒะธะน ะฒั–ัะดะบะพะบ ั‡ะธ ั‚ะธะผั‡ะฐัะพะฒะธะน ั€ะพะทะฒะพั€ะพั‚
- ะท ัะฐะผะพะณะพ ะฒะตั€ั…ัƒ, ะฝะฐะด ะพะฑ'ั”ะผะฐะผะธ ะทะฝะฐั‡ะธั‚ัŒ ะฝะฐะฑะธั€ะฐัŽั‚ัŒัั ัˆะพั€ั‚ะธ ะฟั€ะธ ั†ัŒะพะผัƒ ั–ะฝะพะดั– ั‚ะธะผั‡ะฐัะพะฒะพ ะผะพะถะต ะฑัƒั‚ะธ ั€ั–ัั‚ ั†ั–ะฝ

ะฝะฐะนะบั€ะฐั‰ะธะน ะฒั…ั–ะด ะฒ ะฟะพะทะธั†ั–ัŽ ะถ:
โ†’ะท ัะฐะผะพะณะพ ะฒะตั€ั…ัƒ ะฒ ะจะพั€ั‚
โ†’ะท ัะฐะผะพะณะพ ะฝะธะทัƒ ะฒ ะ›ะพะฝะณ

p.s. good night ))
Bitcoin Elliott Wave Analysis 24-04-2025$BTCย ย #Elliottwave #indicator BTC 4H looks like an almost completed double zigzag, but the last C wave doesnโ€™t look like an impulse wave, so Iโ€™ll show you some alternate counts. An zigzag con be unfolding, but that C wave is too long compared to A wave, so I'll show you an impulse count as a more likely count. As it still appears to be an incomplete five-wave impulse, some upward movement could still be in play. A break below the 73,724 low could be evidence that the impulse is complete.

Bitcoin Elliott Wave Analysis 24-04-2025

$BTC #Elliottwave #indicator
BTC 4H looks like an almost completed double zigzag, but the last C wave doesnโ€™t look like an impulse wave, so Iโ€™ll show you some alternate counts.
An zigzag con be unfolding, but that C wave is too long compared to A wave, so I'll show you an impulse count as a more likely count.
As it still appears to be an incomplete five-wave impulse, some upward movement could still be in play. A break below the 73,724 low could be evidence that the impulse is complete.
ยท
--
Article
TRADING WITH FIBONACCIFibonacci retracement levels help identify pullbacks in trends. In an uptrend, levels act as support, while in a downtrend, they act as resistance for better trade entries.$ETH #indicator

TRADING WITH FIBONACCI

Fibonacci retracement levels help identify pullbacks in trends. In an uptrend, levels act as support, while in a downtrend, they act as resistance for better trade entries.$ETH #indicator
ยท
--
Bullish
๐Ÿ“Š Why I Check Market Median Before Trading I donโ€™t trade signals without market context. The same pump works differently in different regimes. In a strong market, it can continue. In a weak market, it often becomes a long trap and a short setup after confirmation. Market Median gives the background It shows the state of the whole market, not one coin: overheating, oversold pressure, market breadth, impulse strength, deviation from the baseline path. When the market is weak and one coin pumps on thin liquidity, I donโ€™t rush into a long. I check open interest, funding, liquidations, premium index, and structure. Regime decides what is tradable Risk-on: continuation is allowed. Weak market: bounce is not a reversal. Overheated market: longs get expensive. Panic mode: late shorts need a pullback. Screener gives the event. Market Median gives the background. Regime gives permission or rejection. Without context, a trader only sees the candle. Thatโ€™s an expensive way to learn. I give free access to Market Median for Binance traders on Crypto Resources com ๐Ÿ“Š #indicator #market $KNC $IRYS $CHR {future}(CHRUSDT) {future}(KNCUSDT)
๐Ÿ“Š Why I Check Market Median Before Trading

I donโ€™t trade signals without market context.

The same pump works differently in different regimes. In a strong market, it can continue. In a weak market, it often becomes a long trap and a short setup after confirmation.

Market Median gives the background

It shows the state of the whole market, not one coin:

overheating,
oversold pressure,
market breadth,
impulse strength,
deviation from the baseline path.

When the market is weak and one coin pumps on thin liquidity, I donโ€™t rush into a long. I check open interest, funding, liquidations, premium index, and structure.

Regime decides what is tradable

Risk-on: continuation is allowed.
Weak market: bounce is not a reversal.
Overheated market: longs get expensive.
Panic mode: late shorts need a pullback.

Screener gives the event.
Market Median gives the background.
Regime gives permission or rejection.

Without context, a trader only sees the candle. Thatโ€™s an expensive way to learn.

I give free access to Market Median for Binance traders on Crypto Resources com ๐Ÿ“Š #indicator #market $KNC $IRYS $CHR
ยท
--
Article
MASTER THE 50% FIBONACCI ENTRYSmart traders donโ€™t chase price, they wait for price to return. The 50%Fibonacci level, combined withmarket structure, BOS, and an Order Block, creates high-probabilityentry zone. Trade with precision.Enter with confidence. Target liquidity.$BNB #indicator

MASTER THE 50% FIBONACCI ENTRY

Smart traders donโ€™t chase price, they wait for price to return. The 50%Fibonacci level, combined withmarket structure, BOS, and an Order Block, creates high-probabilityentry zone. Trade with precision.Enter with confidence. Target liquidity.$BNB #indicator
Log in to explore more content
Join global crypto users on Binance Square
โšก๏ธ Get latest and useful information about crypto.
๐Ÿ’ฌ Trusted by the worldโ€™s largest crypto exchange.
๐Ÿ‘ Discover real insights from verified creators.
Email / Phone number