
#buffettindicator
buffettindicator
35,038 views
27 Discussing
Hot
Latest

·
--
Bearish
Verified
🚨📉 EL INDICADOR WARREN BUFFETT ACABA DE MARCAR EL NIVEL MÁS ALTO DE LA HISTORIA 💥😳🔥
Si quieres entender por qué algunos creen que Wall Street está viviendo una burbuja histórica quédate por aquí 👀📊 dale seguir para no perderte nada
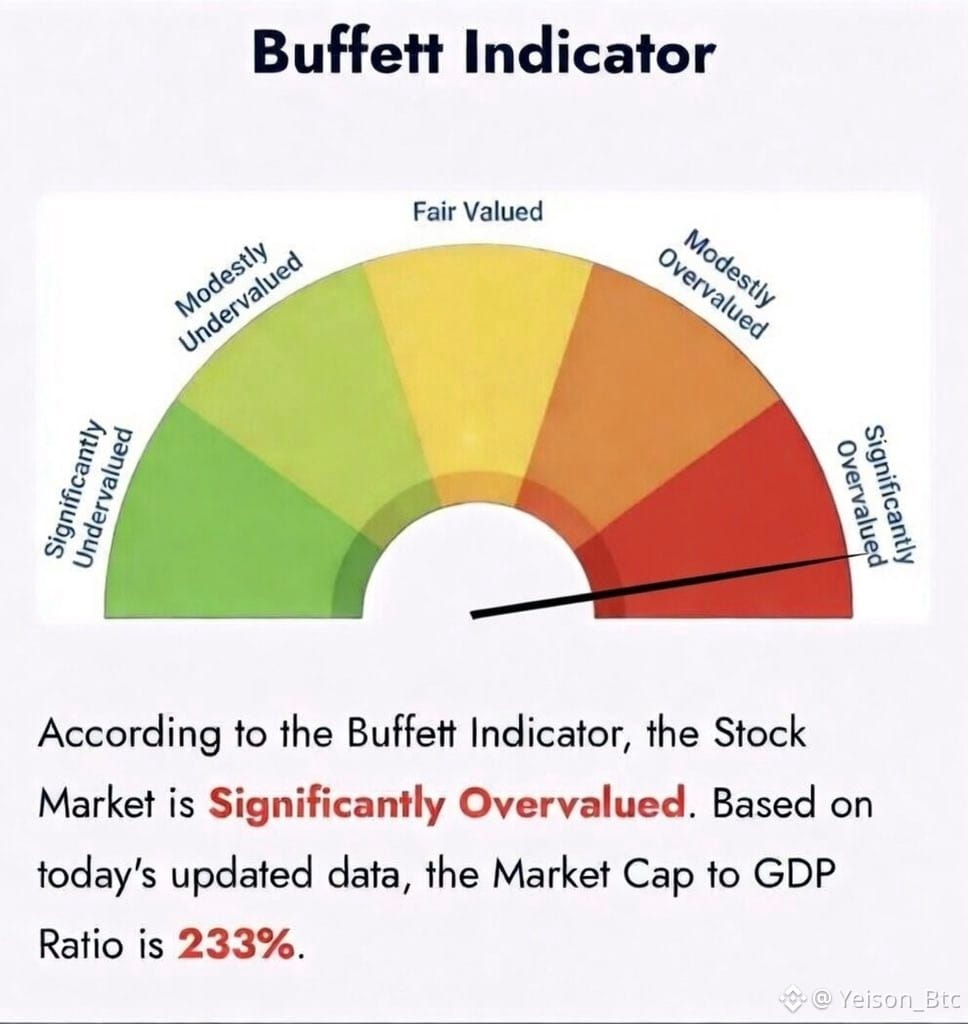
🧠 El famoso “#BuffettIndicator ” acaba de tocar 233% y eso significa algo MUY serio:
La bolsa de Estados Unidos vale más del doble que toda la economía real del país 😶💰
Este indicador compara:
📈 Capitalización total del mercado
vs
🏛️ PIB de Estados Unidos
Y cuando esa diferencia se vuelve extrema… históricamente el mercado entra en zonas muy peligrosas ⚠️📉
📊 Para ponerlo en perspectiva:
✅ 70%-100% = mercado relativamente normal
⚠️ 120%-150% = sobrevaloración
🚨 Más de 200% = territorio históricamente extremo
Y ahora estamos en 233%… el nivel más alto jamás registrado 😳🔥
Pero aquí viene lo interesante… lo que casi nadie quiere ver 👀
❌ Esto NO significa necesariamente que mañana llegue un crash
Porque el mercado actual está impulsado por cosas que antes no existían a esta escala:
💸 Trillones impresos por la #Fed
🤖 #FOMO por inteligencia artificial
📈 #ETFs comprando constantemente
🌍 Empresas tech generando dinero globalmente
🧠 Liquidez gigantesca moviendo activos de riesgo
Por eso el mercado puede seguir subiendo incluso estando absurdamente caro 😵💫📊
🔥 El verdadero peligro aparece cuando:
baja la liquidez
la FED endurece condiciones
aparece miedo real
las ganancias decepcionan
o simplemente desaparece el optimismo
Porque cuando un mercado está tan sobrevalorado… cualquier chispa puede provocar movimientos MUY violentos 📉💥
Y normalmente… la mayoría solo se da cuenta cuando ya es tarde 😶
👇 Entonces la pregunta es:
{spot}(BTCUSDT)
¿Estamos viendo la mayor burbuja financiera de todos los tiempos… o todavía falta la subida más irracional antes del verdadero colapso? 🚀📉🔥
🚨📉 EL INDICADOR WARREN BUFFETT ACABA DE MARCAR EL NIVEL MÁS ALTO DE LA HISTORIA 💥😳🔥
Si quieres entender por qué algunos creen que Wall Street está viviendo una burbuja histórica quédate por aquí 👀📊 dale seguir para no perderte nada
🧠 El famoso “#BuffettIndicator ” acaba de tocar 233% y eso significa algo MUY serio:
La bolsa de Estados Unidos vale más del doble que toda la economía real del país 😶💰
Este indicador compara:
📈 Capitalización total del mercado
vs
🏛️ PIB de Estados Unidos
Y cuando esa diferencia se vuelve extrema… históricamente el mercado entra en zonas muy peligrosas ⚠️📉
📊 Para ponerlo en perspectiva:
✅ 70%-100% = mercado relativamente normal
⚠️ 120%-150% = sobrevaloración
🚨 Más de 200% = territorio históricamente extremo
Y ahora estamos en 233%… el nivel más alto jamás registrado 😳🔥
Pero aquí viene lo interesante… lo que casi nadie quiere ver 👀
❌ Esto NO significa necesariamente que mañana llegue un crash
Porque el mercado actual está impulsado por cosas que antes no existían a esta escala:
💸 Trillones impresos por la #Fed
🤖 #FOMO por inteligencia artificial
📈 #ETFs comprando constantemente
🌍 Empresas tech generando dinero globalmente
🧠 Liquidez gigantesca moviendo activos de riesgo
Por eso el mercado puede seguir subiendo incluso estando absurdamente caro 😵💫📊
🔥 El verdadero peligro aparece cuando:
baja la liquidez
la FED endurece condiciones
aparece miedo real
las ganancias decepcionan
o simplemente desaparece el optimismo
Porque cuando un mercado está tan sobrevalorado… cualquier chispa puede provocar movimientos MUY violentos 📉💥
Y normalmente… la mayoría solo se da cuenta cuando ya es tarde 😶
👇 Entonces la pregunta es:
¿Estamos viendo la mayor burbuja financiera de todos los tiempos… o todavía falta la subida más irracional antes del verdadero colapso? 🚀📉🔥
Si quieres entender por qué algunos creen que Wall Street está viviendo una burbuja histórica quédate por aquí 👀📊 dale seguir para no perderte nada
🧠 El famoso “#BuffettIndicator ” acaba de tocar 233% y eso significa algo MUY serio:
La bolsa de Estados Unidos vale más del doble que toda la economía real del país 😶💰
Este indicador compara:
📈 Capitalización total del mercado
vs
🏛️ PIB de Estados Unidos
Y cuando esa diferencia se vuelve extrema… históricamente el mercado entra en zonas muy peligrosas ⚠️📉
📊 Para ponerlo en perspectiva:
✅ 70%-100% = mercado relativamente normal
⚠️ 120%-150% = sobrevaloración
🚨 Más de 200% = territorio históricamente extremo
Y ahora estamos en 233%… el nivel más alto jamás registrado 😳🔥
Pero aquí viene lo interesante… lo que casi nadie quiere ver 👀
❌ Esto NO significa necesariamente que mañana llegue un crash
Porque el mercado actual está impulsado por cosas que antes no existían a esta escala:
💸 Trillones impresos por la #Fed
🤖 #FOMO por inteligencia artificial
📈 #ETFs comprando constantemente
🌍 Empresas tech generando dinero globalmente
🧠 Liquidez gigantesca moviendo activos de riesgo
Por eso el mercado puede seguir subiendo incluso estando absurdamente caro 😵💫📊
🔥 El verdadero peligro aparece cuando:
baja la liquidez
la FED endurece condiciones
aparece miedo real
las ganancias decepcionan
o simplemente desaparece el optimismo
Porque cuando un mercado está tan sobrevalorado… cualquier chispa puede provocar movimientos MUY violentos 📉💥
Y normalmente… la mayoría solo se da cuenta cuando ya es tarde 😶
👇 Entonces la pregunta es:
¿Estamos viendo la mayor burbuja financiera de todos los tiempos… o todavía falta la subida más irracional antes del verdadero colapso? 🚀📉🔥
4
13
7.1k

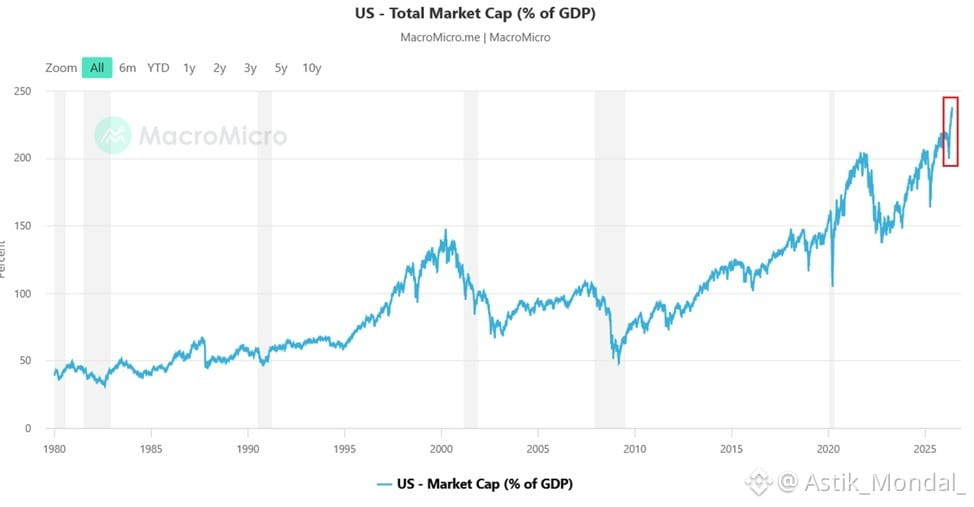
The US stock market is now worth 238% of the entire US economy. A record that makes the Dot-Com bubble look modest.
$75.7 trillion in stock market value.
$31.8 trillion in actual economic output.
The market is worth more than twice the economy that is supposed to support it.
And this number just keeps climbing.
The Dot-Com bubble peak in 2000 hit 148%. Everyone remembers what happened next. Trillions wiped out. Years of pain. The most famous crash of a generation.
Today's reading is 90 percentage points above that.
Let that land.
This ratio has surged 38 percentage points since just March 30th of this year. In weeks. Not years. Weeks.
Since the 2008 financial crisis, the US stock market has grown at 5 times the rate of the underlying economy. Five times. For 17 straight years.
That is not organic wealth creation. That is asset price inflation on a historic scale.
Trump is publicly demanding stocks go up. The Fed has been printing and cutting for over a decade. Every dip gets bought by passive flows. VOO just hit $1 trillion. The system is designed to make asset prices rise faster than the economy that justifies them.
And who wins in that system?
The people who already own the assets.
Employee compensation just hit a 78 year low as a share of corporate income. Workers are taking home less than ever while the market that owns the companies they work for hits all time highs.
The Buffett Indicator has never been this stretched.
Every major crash in history started with someone saying this time is different.
#StockMarket #BuffettIndicator #Valuation #Bubble #Investing
The US stock market is now worth 238% of the entire US economy. A record that makes the Dot-Com bubble look modest.
$75.7 trillion in stock market value.
$31.8 trillion in actual economic output.
The market is worth more than twice the economy that is supposed to support it.
And this number just keeps climbing.
The Dot-Com bubble peak in 2000 hit 148%. Everyone remembers what happened next. Trillions wiped out. Years of pain. The most famous crash of a generation.
Today's reading is 90 percentage points above that.
Let that land.
This ratio has surged 38 percentage points since just March 30th of this year. In weeks. Not years. Weeks.
Since the 2008 financial crisis, the US stock market has grown at 5 times the rate of the underlying economy. Five times. For 17 straight years.
That is not organic wealth creation. That is asset price inflation on a historic scale.
Trump is publicly demanding stocks go up. The Fed has been printing and cutting for over a decade. Every dip gets bought by passive flows. VOO just hit $1 trillion. The system is designed to make asset prices rise faster than the economy that justifies them.
And who wins in that system?
The people who already own the assets.
Employee compensation just hit a 78 year low as a share of corporate income. Workers are taking home less than ever while the market that owns the companies they work for hits all time highs.
The Buffett Indicator has never been this stretched.
Every major crash in history started with someone saying this time is different.
#StockMarket #BuffettIndicator #Valuation #Bubble #Investing
$75.7 trillion in stock market value.
$31.8 trillion in actual economic output.
The market is worth more than twice the economy that is supposed to support it.
And this number just keeps climbing.
The Dot-Com bubble peak in 2000 hit 148%. Everyone remembers what happened next. Trillions wiped out. Years of pain. The most famous crash of a generation.
Today's reading is 90 percentage points above that.
Let that land.
This ratio has surged 38 percentage points since just March 30th of this year. In weeks. Not years. Weeks.
Since the 2008 financial crisis, the US stock market has grown at 5 times the rate of the underlying economy. Five times. For 17 straight years.
That is not organic wealth creation. That is asset price inflation on a historic scale.
Trump is publicly demanding stocks go up. The Fed has been printing and cutting for over a decade. Every dip gets bought by passive flows. VOO just hit $1 trillion. The system is designed to make asset prices rise faster than the economy that justifies them.
And who wins in that system?
The people who already own the assets.
Employee compensation just hit a 78 year low as a share of corporate income. Workers are taking home less than ever while the market that owns the companies they work for hits all time highs.
The Buffett Indicator has never been this stretched.
Every major crash in history started with someone saying this time is different.
#StockMarket #BuffettIndicator #Valuation #Bubble #Investing
172

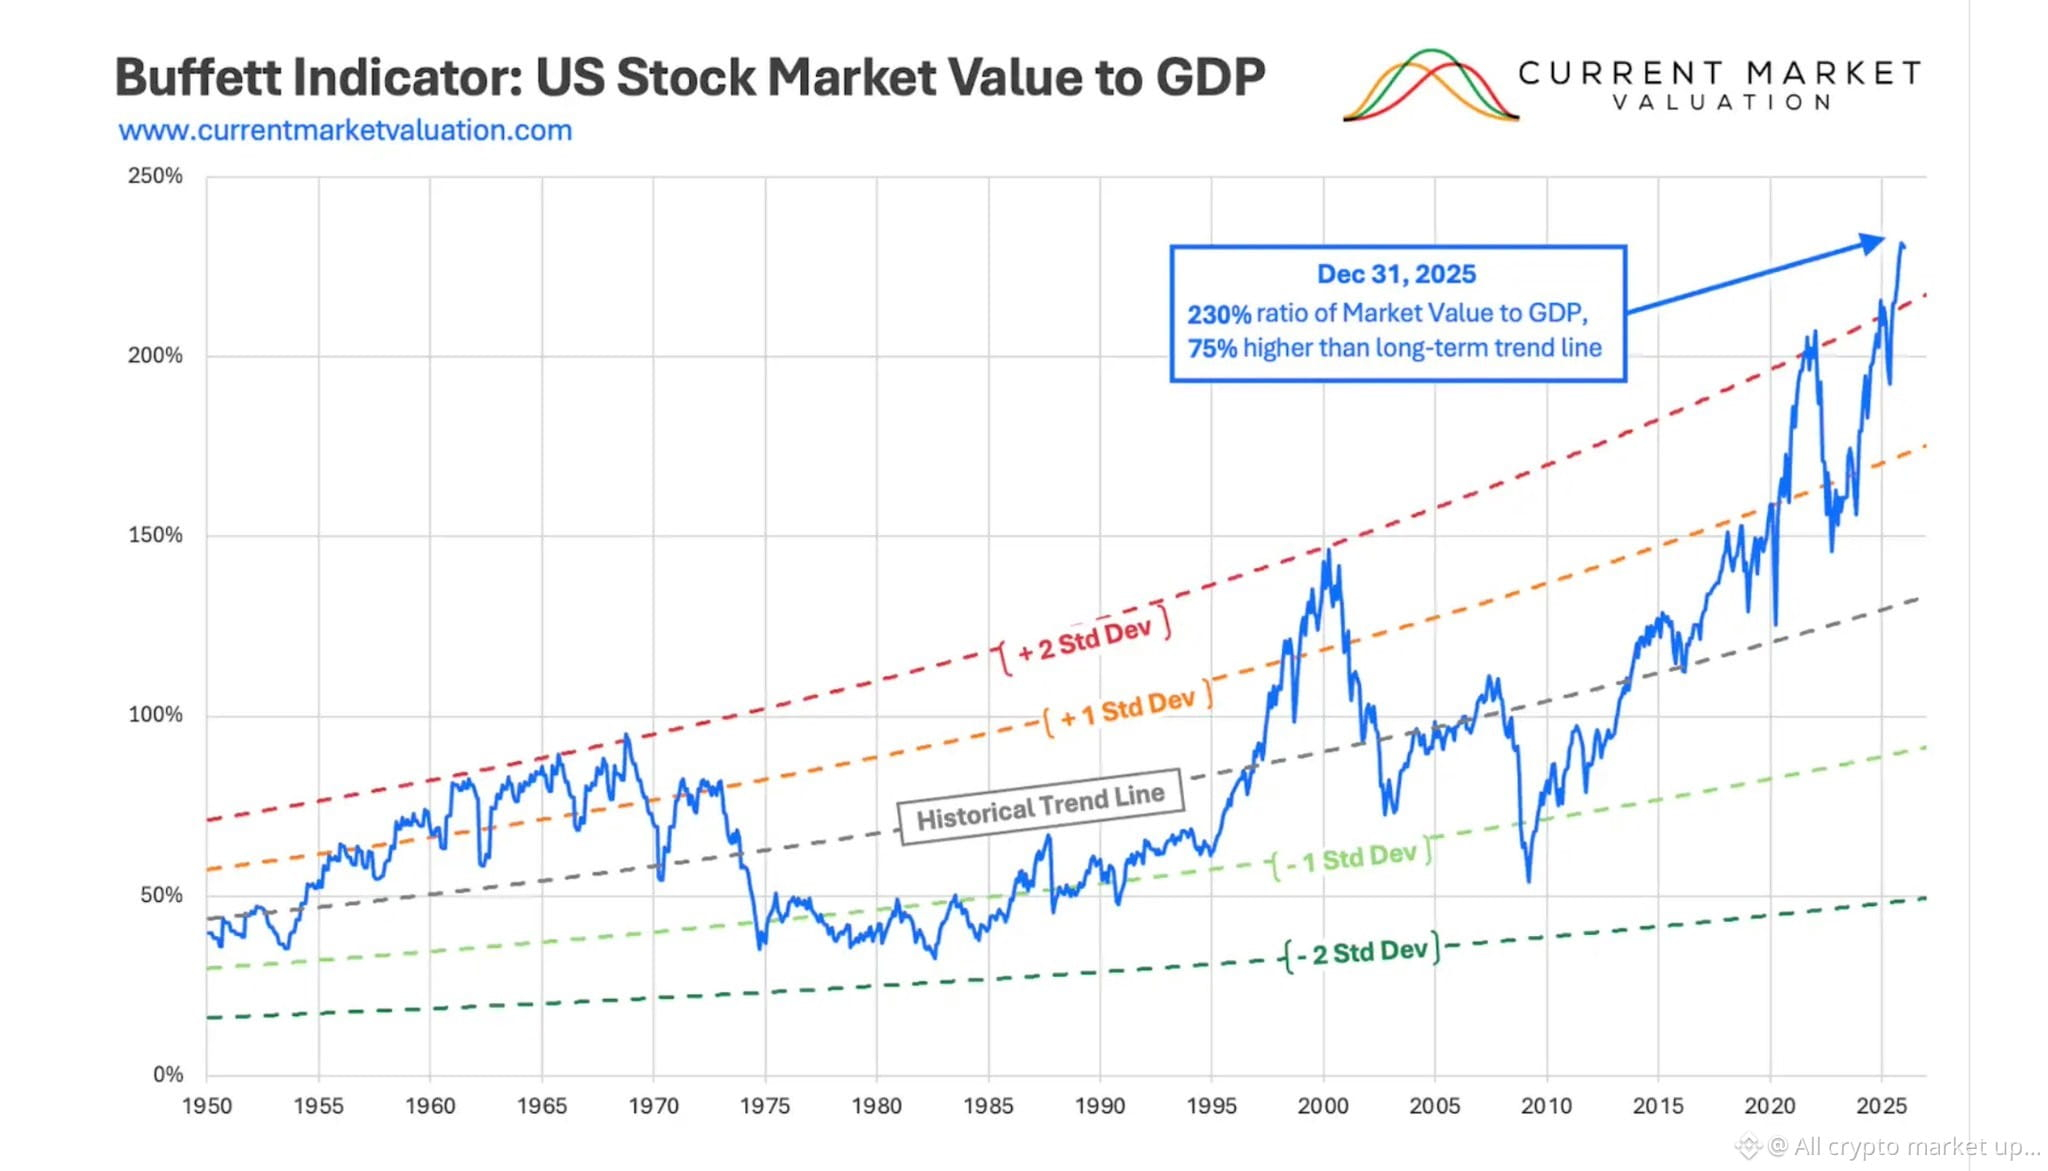
**Warren Buffett Indicator just hit 230%. Highest ever.** 🎯
Everyone calling it the biggest bubble in history.
But the formula was built for 2001. Not 2026. ⚡
Here's what the indicator gets wrong — 💣
**Problem 1 — Global vs Domestic**
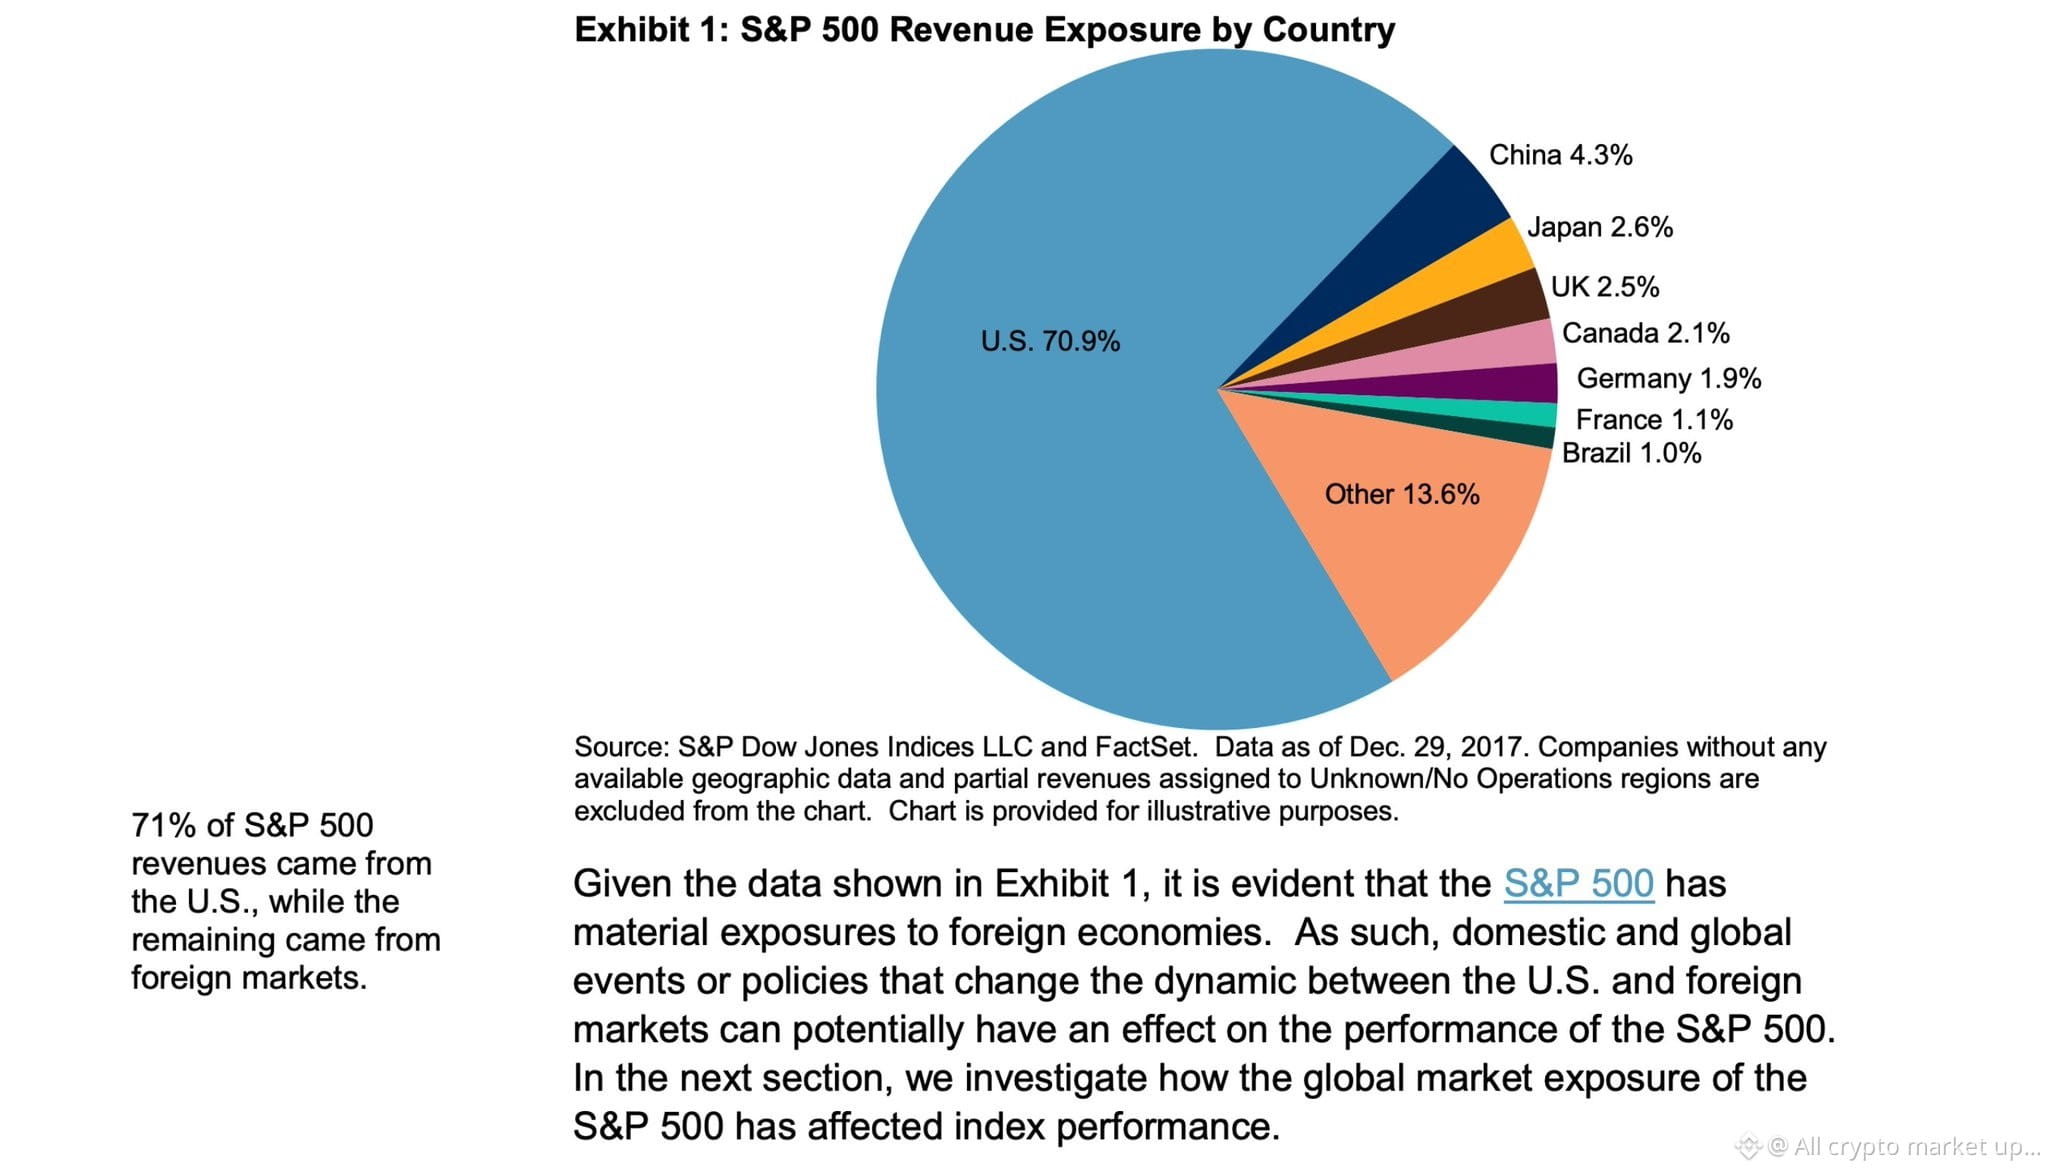
Numerator = global stock market value.
Denominator = US GDP only.
Apple. Nvidia. Microsoft.
56-67% of tech revenue comes from outside US.
Stock market prices global cash flows.
GDP only measures domestic production.
**The math is structurally broken.** 🎯
**Problem 2 — Buffett used GNP not GDP**
Almost nobody mentions this.
GDP = production inside US borders.
GNP = production by US businesses globally.
Modern analysts quietly swapped them.
**That alone inflates the reading artificially.** 🌍
**Problem 3 — Digital economy is invisible to GDP**
Google. YouTube. Instagram. Gmail.
Trillion dollar businesses.
Users pay nothing.
GDP captures almost none of it. 💣
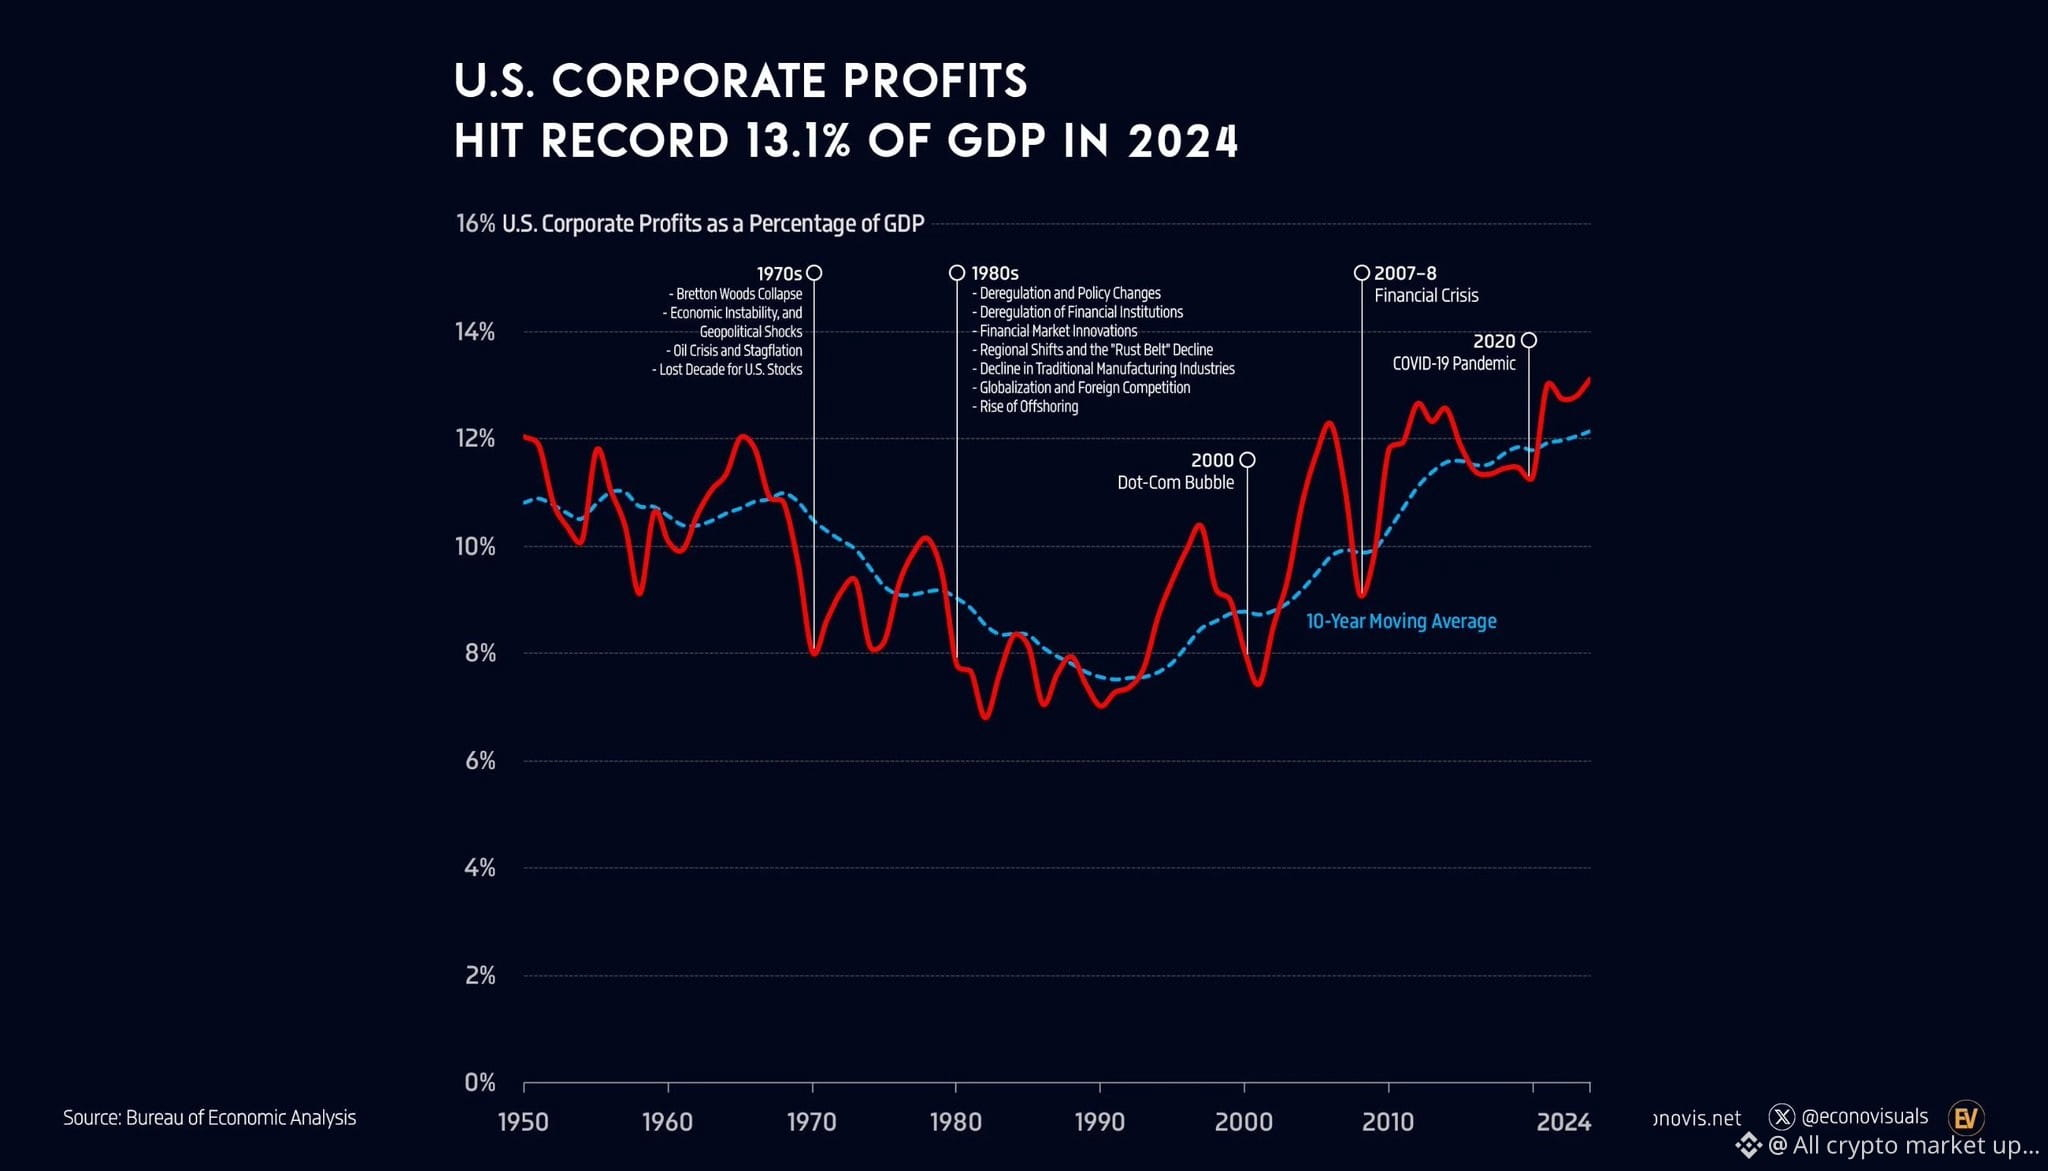
**Problem 4 — Corporate profits structurally higher**
Historical average: 7-8% of GDP.
Today: nearly 14%.
Higher permanent profits = higher valuations justified.
Indicator assumes full reversion.
**That assumption may be permanently wrong.** 🎯
**Problem 5 — Track record is weak**
Indicator crossed 100% in 2013.
S&P tripled since then.
Study found it correctly predicted only 50% of major declines.
**That's a coin flip.** 🌍
**Problem 6 — Fed changed everything**
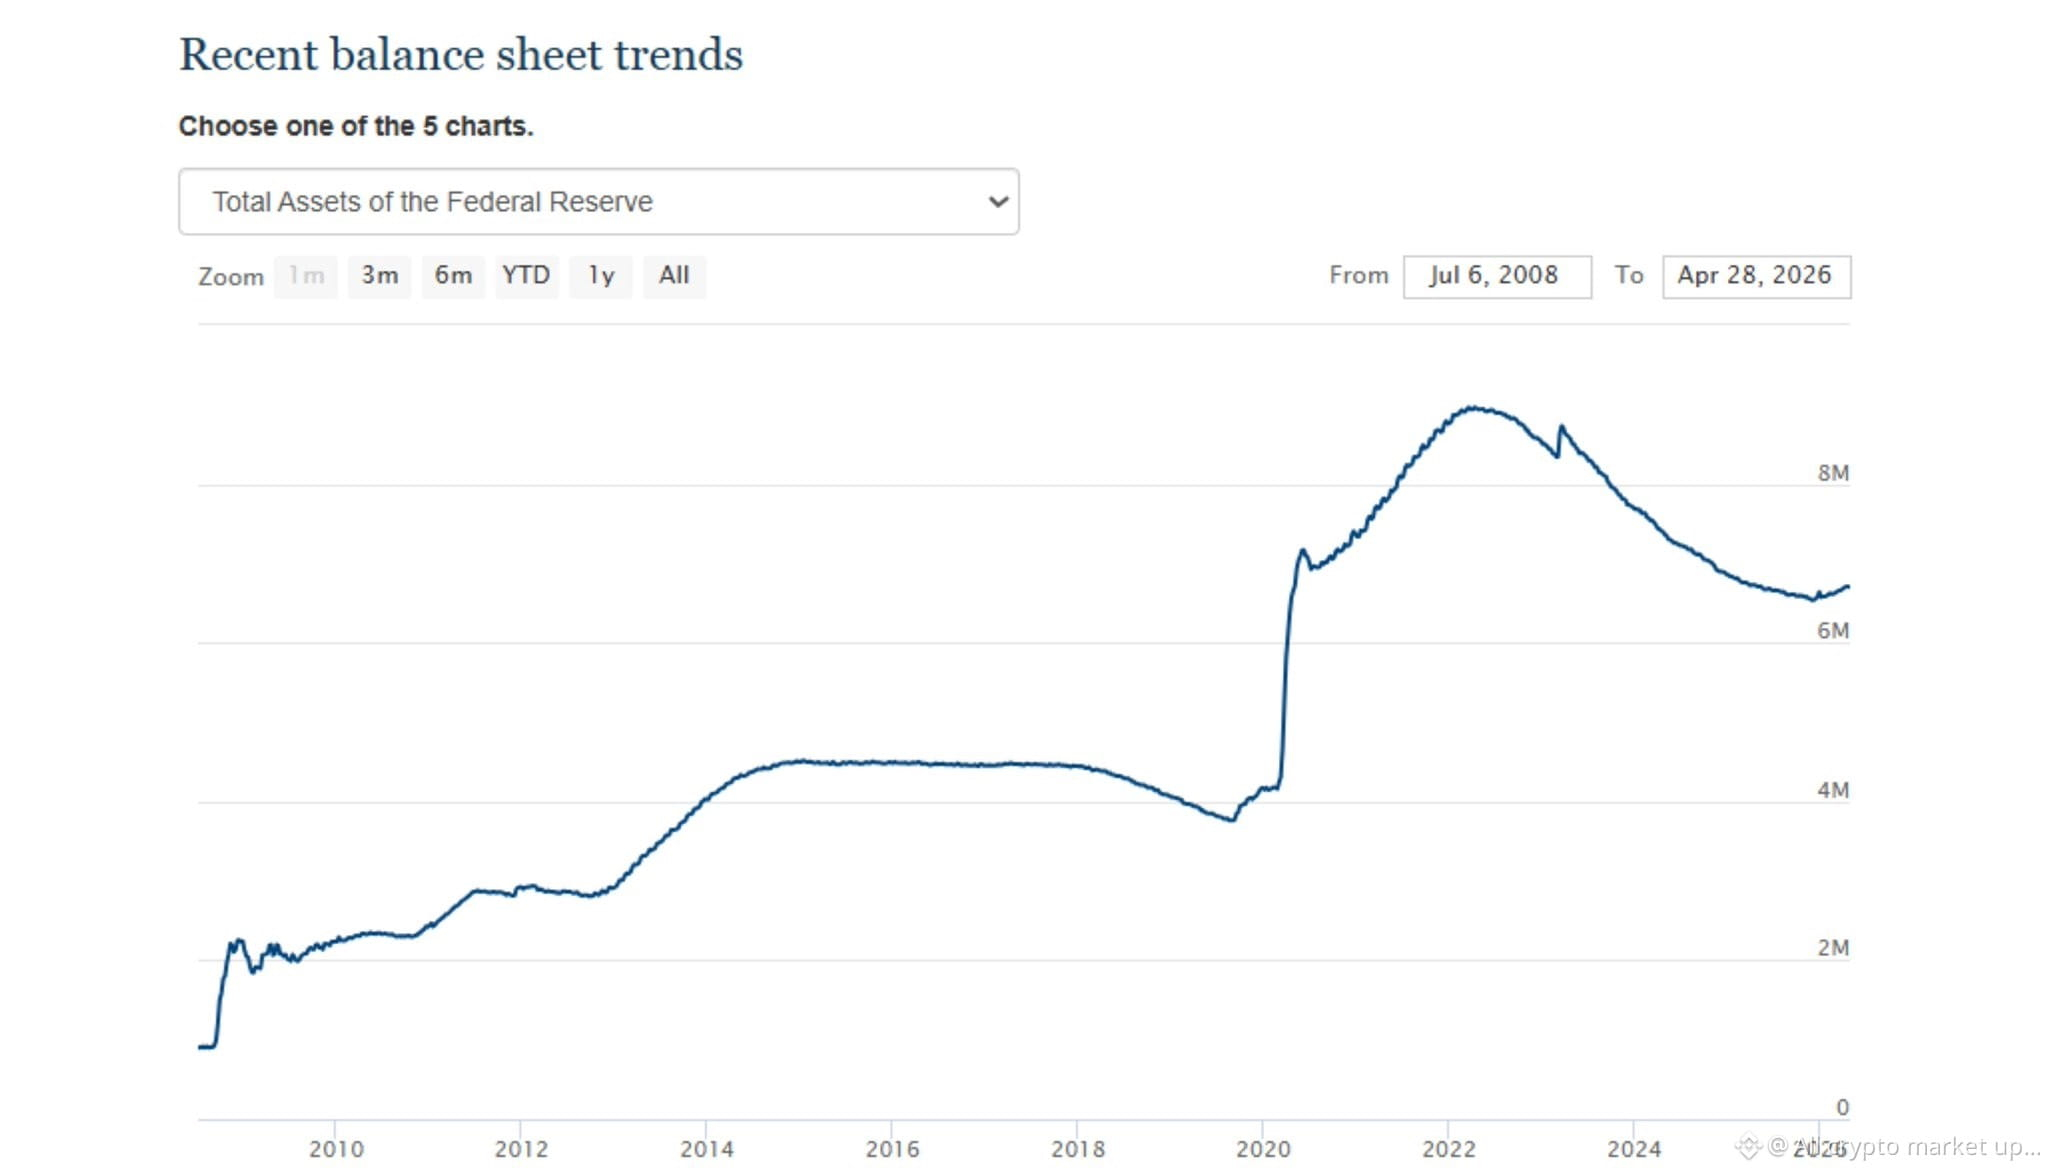
Pre-2008 Fed balance sheet: under $1T.
Peak: above $9T.
Trillions in liquidity inflated asset prices.
Original thresholds never accounted for this. 💣
**Problem 7 — International comparison breaks the model**
Taiwan Buffett Indicator: 325%.
Hong Kong: exceeds 1000%.
Not because they're in bigger bubbles.
Because their markets price global dominance. 🎯
None of this means stocks are cheap.
Markets can still crash. Hard. 🌍
But applying a 2001 formula
to a 2026 global digital economy
and calling it definitive —
**Is like using a 1990 map
to navigate a 2026 city.** 📉
The roads changed.
The map didn't. 🔢
#BuffettIndicator #Stocks #SP500 #Bubble #Macro
**Warren Buffett Indicator just hit 230%. Highest ever.** 🎯
Everyone calling it the biggest bubble in history.
But the formula was built for 2001. Not 2026. ⚡
Here's what the indicator gets wrong — 💣
**Problem 1 — Global vs Domestic**
Numerator = global stock market value.
Denominator = US GDP only.
Apple. Nvidia. Microsoft.
56-67% of tech revenue comes from outside US.
Stock market prices global cash flows.
GDP only measures domestic production.
**The math is structurally broken.** 🎯
**Problem 2 — Buffett used GNP not GDP**
Almost nobody mentions this.
GDP = production inside US borders.
GNP = production by US businesses globally.
Modern analysts quietly swapped them.
**That alone inflates the reading artificially.** 🌍
**Problem 3 — Digital economy is invisible to GDP**
Google. YouTube. Instagram. Gmail.
Trillion dollar businesses.
Users pay nothing.
GDP captures almost none of it. 💣
**Problem 4 — Corporate profits structurally higher**
Historical average: 7-8% of GDP.
Today: nearly 14%.
Higher permanent profits = higher valuations justified.
Indicator assumes full reversion.
**That assumption may be permanently wrong.** 🎯
**Problem 5 — Track record is weak**
Indicator crossed 100% in 2013.
S&P tripled since then.
Study found it correctly predicted only 50% of major declines.
**That's a coin flip.** 🌍
**Problem 6 — Fed changed everything**
Pre-2008 Fed balance sheet: under $1T.
Peak: above $9T.
Trillions in liquidity inflated asset prices.
Original thresholds never accounted for this. 💣
**Problem 7 — International comparison breaks the model**
Taiwan Buffett Indicator: 325%.
Hong Kong: exceeds 1000%.
Not because they're in bigger bubbles.
Because their markets price global dominance. 🎯
None of this means stocks are cheap.
Markets can still crash. Hard. 🌍
But applying a 2001 formula
to a 2026 global digital economy
and calling it definitive —
**Is like using a 1990 map
to navigate a 2026 city.** 📉
The roads changed.
The map didn't. 🔢
#BuffettIndicator #Stocks #SP500 #Bubble #Macro
Everyone calling it the biggest bubble in history.
But the formula was built for 2001. Not 2026. ⚡
Here's what the indicator gets wrong — 💣
**Problem 1 — Global vs Domestic**
Numerator = global stock market value.
Denominator = US GDP only.
Apple. Nvidia. Microsoft.
56-67% of tech revenue comes from outside US.
Stock market prices global cash flows.
GDP only measures domestic production.
**The math is structurally broken.** 🎯
**Problem 2 — Buffett used GNP not GDP**
Almost nobody mentions this.
GDP = production inside US borders.
GNP = production by US businesses globally.
Modern analysts quietly swapped them.
**That alone inflates the reading artificially.** 🌍
**Problem 3 — Digital economy is invisible to GDP**
Google. YouTube. Instagram. Gmail.
Trillion dollar businesses.
Users pay nothing.
GDP captures almost none of it. 💣
**Problem 4 — Corporate profits structurally higher**
Historical average: 7-8% of GDP.
Today: nearly 14%.
Higher permanent profits = higher valuations justified.
Indicator assumes full reversion.
**That assumption may be permanently wrong.** 🎯
**Problem 5 — Track record is weak**
Indicator crossed 100% in 2013.
S&P tripled since then.
Study found it correctly predicted only 50% of major declines.
**That's a coin flip.** 🌍
**Problem 6 — Fed changed everything**
Pre-2008 Fed balance sheet: under $1T.
Peak: above $9T.
Trillions in liquidity inflated asset prices.
Original thresholds never accounted for this. 💣
**Problem 7 — International comparison breaks the model**
Taiwan Buffett Indicator: 325%.
Hong Kong: exceeds 1000%.
Not because they're in bigger bubbles.
Because their markets price global dominance. 🎯
None of this means stocks are cheap.
Markets can still crash. Hard. 🌍
But applying a 2001 formula
to a 2026 global digital economy
and calling it definitive —
**Is like using a 1990 map
to navigate a 2026 city.** 📉
The roads changed.
The map didn't. 🔢
#BuffettIndicator #Stocks #SP500 #Bubble #Macro
49
Log in to explore more content
Join global crypto users on Binance Square
⚡️ Get latest and useful information about crypto.
💬 Trusted by the world’s largest crypto exchange.
👍 Discover real insights from verified creators.
Email / Phone number
Trending Topics
1
#HuangRisksOusterOverReportedAffairWithSubordinate
11,067 views
205 Discussing
2
#AnthropicRejectsIPODelayValuationinQuestion
440,547 views
3,719 Discussing
3
#CoreWeaveJumps10%On168%RevenueGrowth
51,841 views
733 Discussing
4
#ZcashFallsBelow$1000ForFirstTimeSinceSeptember
27,031 views
137 Discussing
5
#CanNvidiaEarningsEaseMarketConcerns?
155,768 views
1,669 Discussing
6
#SolanaCompanyReports$3.4MQ3Revenue
294 views
7 Discussing
7
#StrategyMetaplanetLoseMSCIIndexMembership
3,468 views
61 Discussing
8
#tZEROWinsCFTCApprovalForRegulatedDerivativesExchange
392 views
9 Discussing
9
#HotCPIDecemberHikePriced
470,289 views
3,701 Discussing
10
#StablecoinSupplyDrops$14.2BIn30Days
494 views
8 Discussing