
#berish
berish
192,398 views
421 Discussing
Hot
Latest

Article
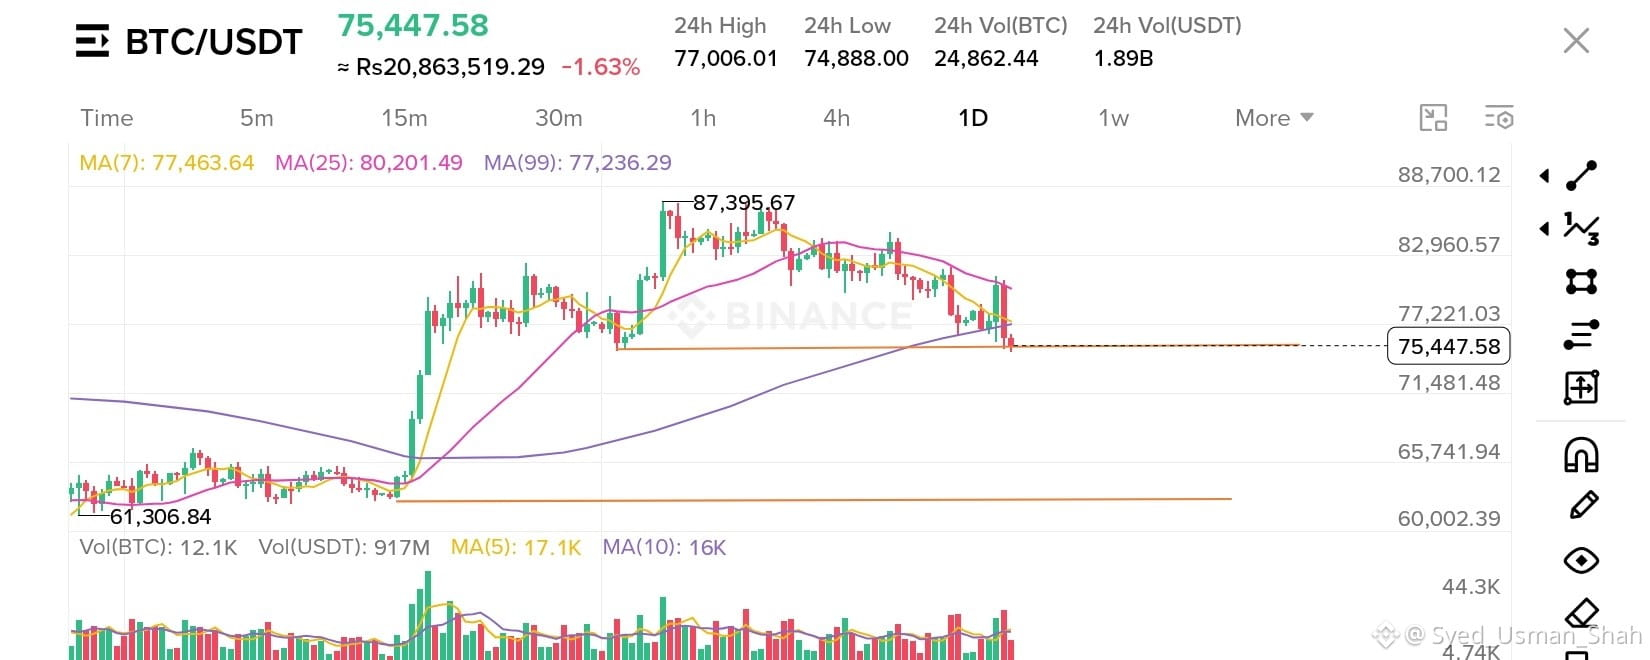
BTC long or Short? 🧐$BTC currently going Bearish
It hit 75447 Support Zone
This very critical all traders should wait for the next move .
Bearish:
If it goes Bearish wait for the confirmation at 71 and then Sell and set Take Profit at 67.
Bullish:
If it goes bullish wait for BTC to hit 80 then buy it but still buying it is high risk and sell near 84 to 85 .
Disclaimer:
Trading is high risk don't put all your money.
#Binance #BTC #bullish #berish
BTC long or Short? 🧐
$BTC currently going Bearish
It hit 75447 Support Zone
This very critical all traders should wait for the next move .
Bearish:
If it goes Bearish wait for the confirmation at 71 and then Sell and set Take Profit at 67.
Bullish:
If it goes bullish wait for BTC to hit 80 then buy it but still buying it is high risk and sell near 84 to 85 .
Disclaimer:
Trading is high risk don't put all your money.
#Binance #BTC #bullish #berish
It hit 75447 Support Zone
This very critical all traders should wait for the next move .
Bearish:
If it goes Bearish wait for the confirmation at 71 and then Sell and set Take Profit at 67.
Bullish:
If it goes bullish wait for BTC to hit 80 then buy it but still buying it is high risk and sell near 84 to 85 .
Disclaimer:
Trading is high risk don't put all your money.
#Binance #BTC #bullish #berish
80

·
--
Bearish
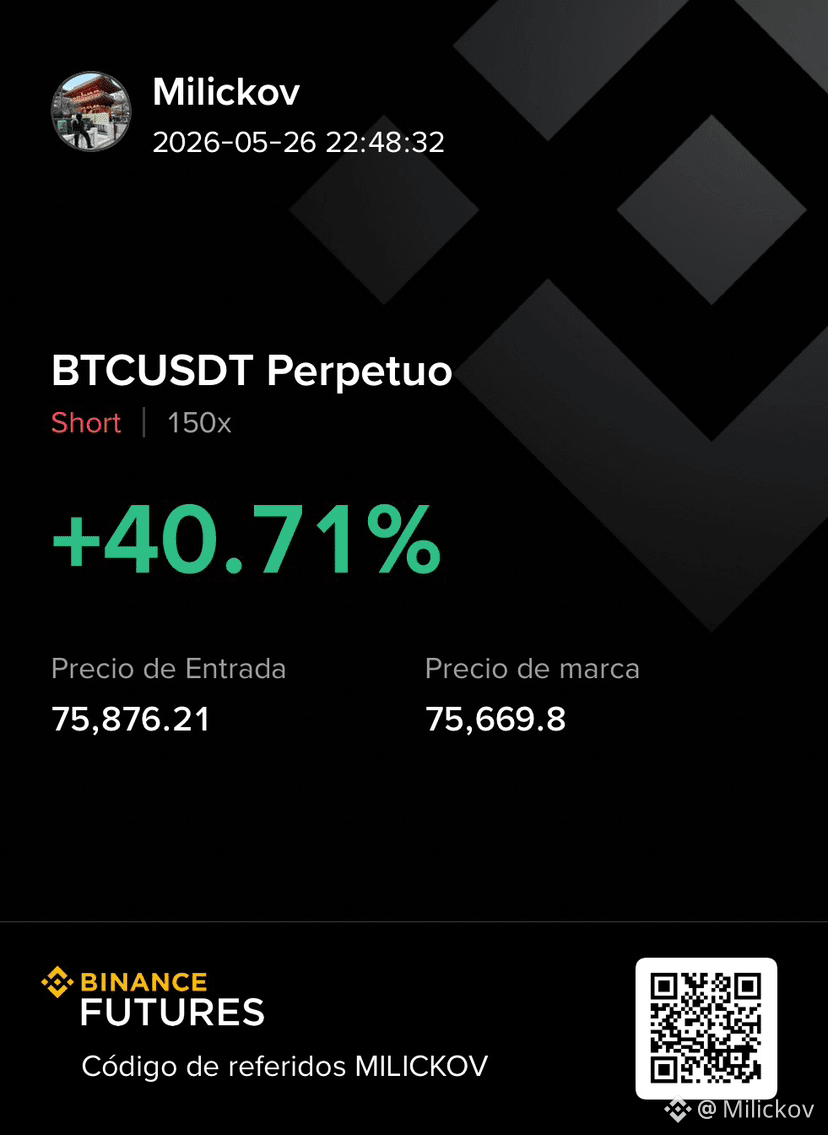
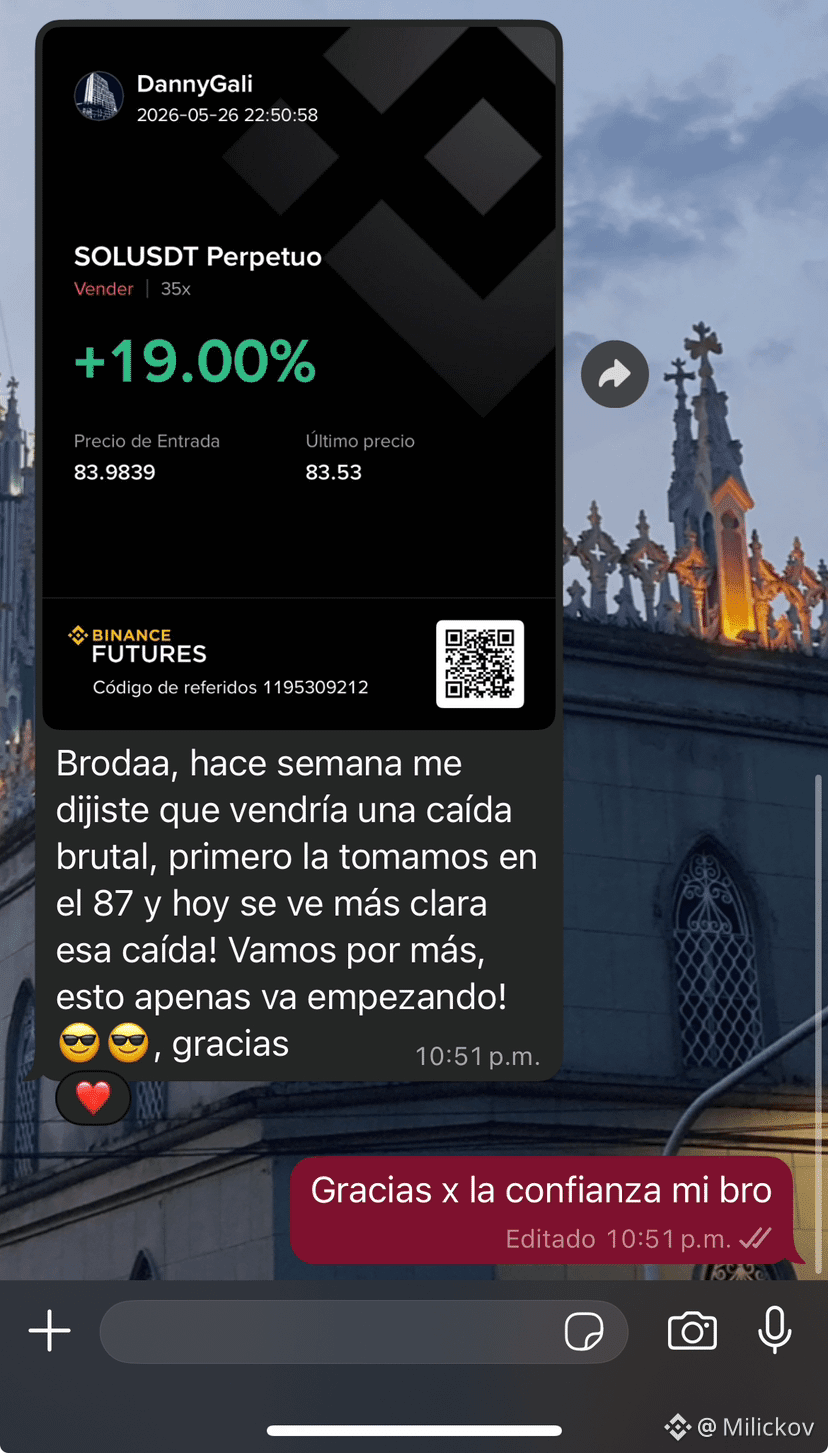
$BTC $SOL Nos Preparamos Para Un Escenario Súper Bajista De BTC En Los Próximos 3 O 4 Meses Y Como Es Costumbre, Buscamos La Mejor Entrada Posible Para Llevarnos El Beneficio De Esta Grán Caída, De Aquí A Octubre BTC Puede Caer A Los 25k Para Luego Buscar Un Nuevo Máximo Histórico Luego De Que Retestee La Zona De 126k Y Rompa Con Fuerza (Último Máximo Histórico), Para Buscar Un Nuevo Máximo Entre 150 y 200k - Para Nov - Dic o el Primer Trimestre De 2027 - Toda Esta Información Privilegiada Podrás Recibirla Estándo Dentro Del VIP Junto Con Los Que Tomamos Acción, Si Te Interesa Ser Parte, Házmelo Saber En Comentarios 💎🫡
#berish #crash #crashmarket
{future}(BTCUSDT)
{future}(SOLUSDT)
$BTC $SOL Nos Preparamos Para Un Escenario Súper Bajista De BTC En Los Próximos 3 O 4 Meses Y Como Es Costumbre, Buscamos La Mejor Entrada Posible Para Llevarnos El Beneficio De Esta Grán Caída, De Aquí A Octubre BTC Puede Caer A Los 25k Para Luego Buscar Un Nuevo Máximo Histórico Luego De Que Retestee La Zona De 126k Y Rompa Con Fuerza (Último Máximo Histórico), Para Buscar Un Nuevo Máximo Entre 150 y 200k - Para Nov - Dic o el Primer Trimestre De 2027 - Toda Esta Información Privilegiada Podrás Recibirla Estándo Dentro Del VIP Junto Con Los Que Tomamos Acción, Si Te Interesa Ser Parte, Házmelo Saber En Comentarios 💎🫡
#berish #crash #crashmarket
#berish #crash #crashmarket
137


·
--
#berish
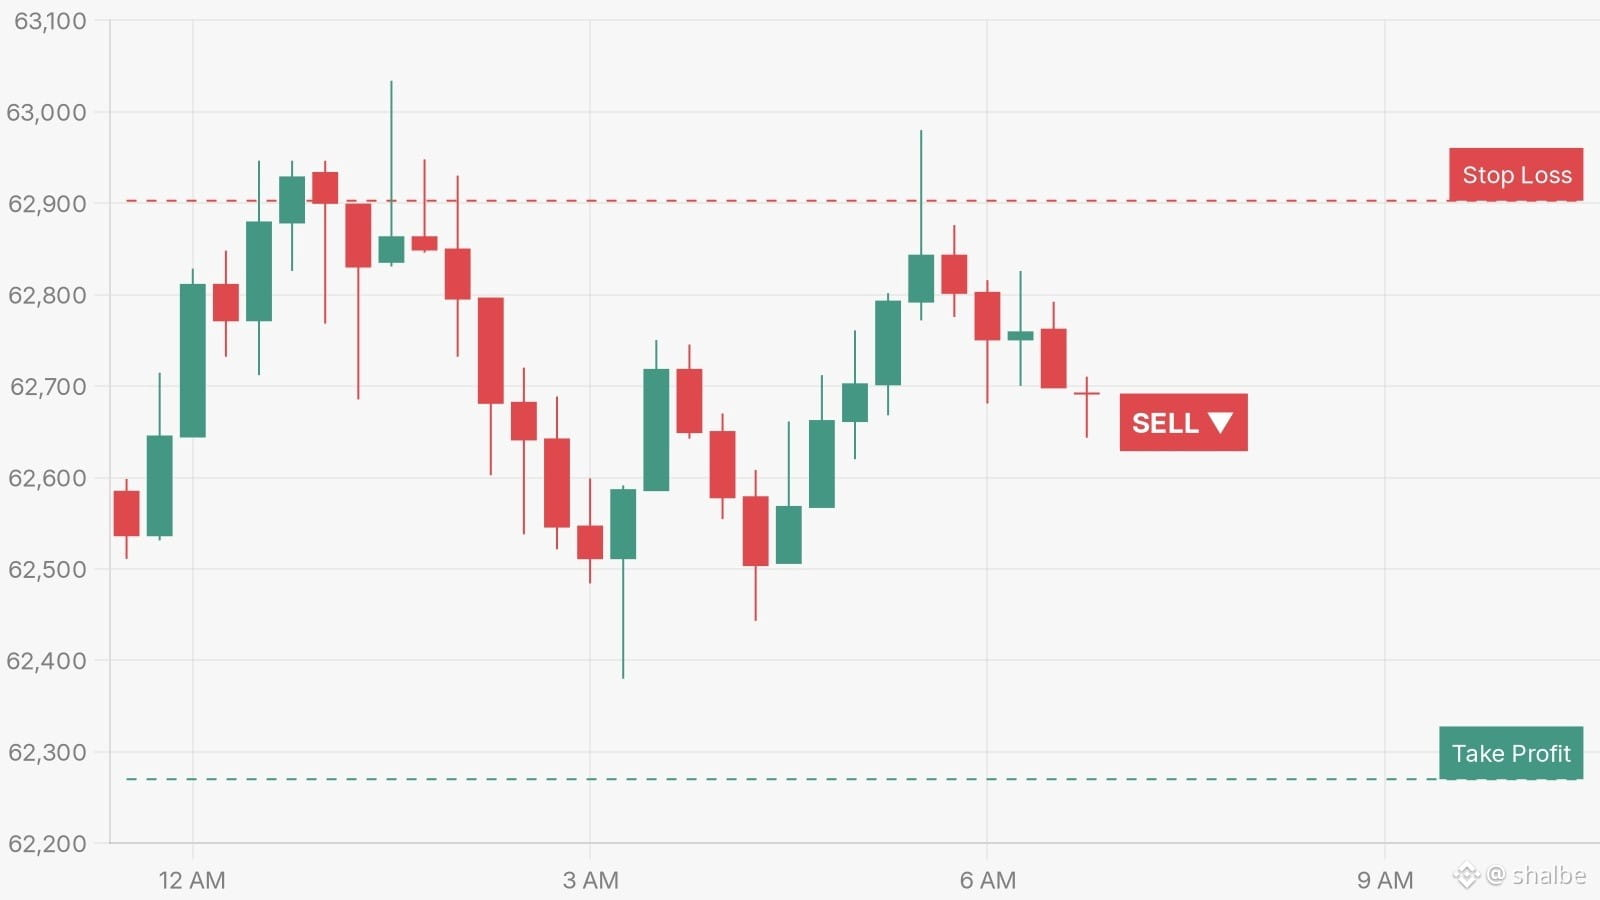
*Bearish Sell Setup Targets 62,300 as Price Rejects 62,900 Resistance*
Price action shows a clear SELL entry near 62,700 after multiple rejections at the 62,900 level. The intraday chart reveals a double-top structure formed between 12 AM and 6 AM, with sellers defending 62,900 as a key resistance. Stop Loss sits above at 62,900, protecting against a breakout above recent swing highs. Take Profit targets 62,300, aligning with prior demand from the 3 AM lows. Momentum favors bears after lower highs formed through the session. A break below 62,650 confirms short-term weakness toward 62,300. Invalidation occurs only above 62,900, which would shift bias bullish. Structure supports downside continuation. .
#berish
*Bearish Sell Setup Targets 62,300 as Price Rejects 62,900 Resistance*
Price action shows a clear SELL entry near 62,700 after multiple rejections at the 62,900 level. The intraday chart reveals a double-top structure formed between 12 AM and 6 AM, with sellers defending 62,900 as a key resistance. Stop Loss sits above at 62,900, protecting against a breakout above recent swing highs. Take Profit targets 62,300, aligning with prior demand from the 3 AM lows. Momentum favors bears after lower highs formed through the session. A break below 62,650 confirms short-term weakness toward 62,300. Invalidation occurs only above 62,900, which would shift bias bullish. Structure supports downside continuation. .
*Bearish Sell Setup Targets 62,300 as Price Rejects 62,900 Resistance*
Price action shows a clear SELL entry near 62,700 after multiple rejections at the 62,900 level. The intraday chart reveals a double-top structure formed between 12 AM and 6 AM, with sellers defending 62,900 as a key resistance. Stop Loss sits above at 62,900, protecting against a breakout above recent swing highs. Take Profit targets 62,300, aligning with prior demand from the 3 AM lows. Momentum favors bears after lower highs formed through the session. A break below 62,650 confirms short-term weakness toward 62,300. Invalidation occurs only above 62,900, which would shift bias bullish. Structure supports downside continuation. .
1
85

·
--
Bearish
For $ZEST holders, I know the chart looks bearish right now, but sometimes the strongest moves come after the hardest corrections. Stay patient, Zest coin will soon create the bullish momentum once again, and hit the $1. God willing
#zest #ZestProtocol #ALPHA #berish
{alpha}(560x5506599c722389a60580b5213ea1da60d64754a1)
For $ZEST holders, I know the chart looks bearish right now, but sometimes the strongest moves come after the hardest corrections. Stay patient, Zest coin will soon create the bullish momentum once again, and hit the $1. God willing
#zest #ZestProtocol #ALPHA #berish
#zest #ZestProtocol #ALPHA #berish

4
2
917

·
--
93



·
--
Bearish
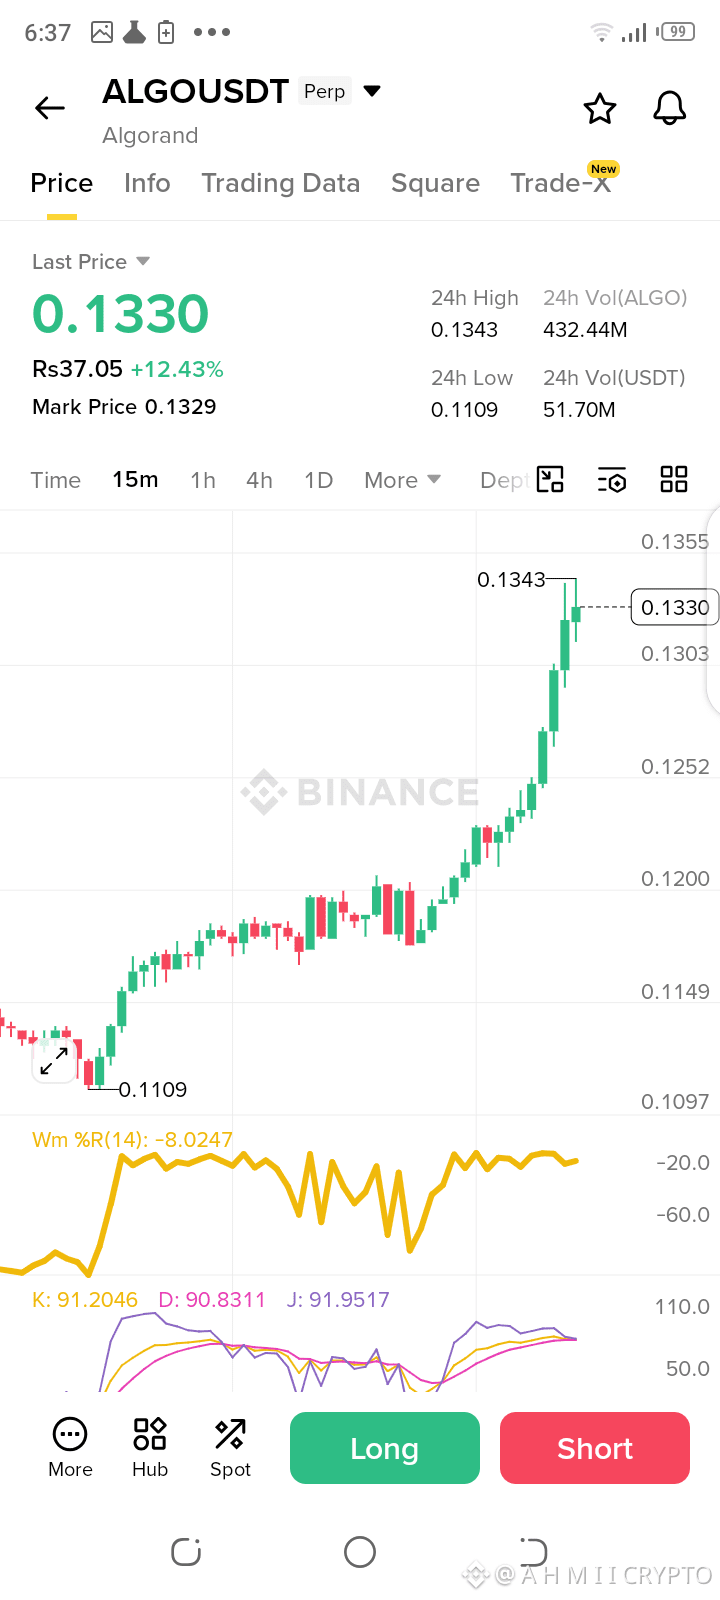
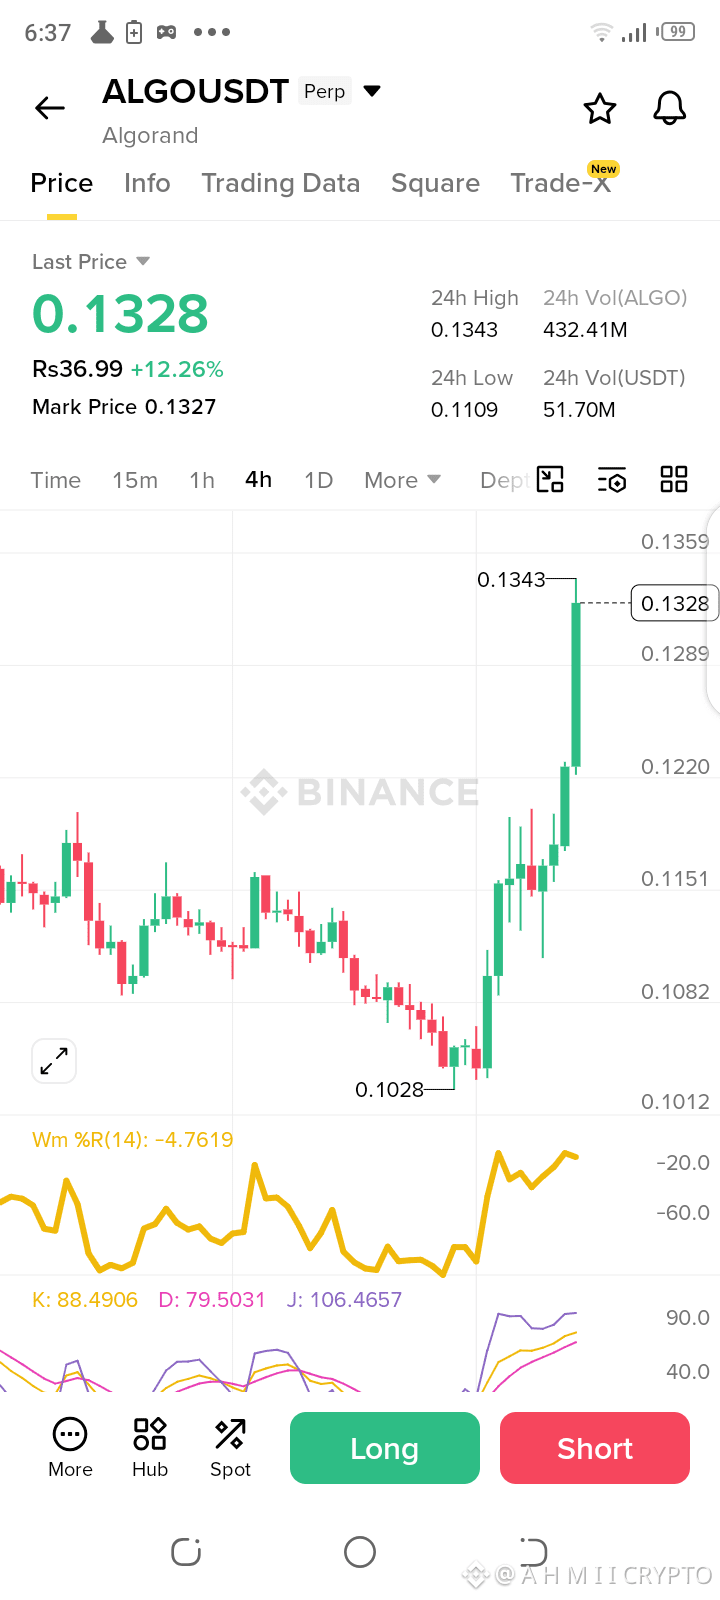
See $ALGO The Time to Dip 👀
It is already claim upward🤑 In AF
Not Open Short Position🚀
When Byers Take Exit Because They Earn Profit Then Market Bearish Move
The market rewards smart entries, and with $49.72M in 24h volume, this one is another perfect example of that. 🚀$XRP Also
#ALGO #berish #TrendingTopic #foryou #TrendingTopic
See $ALGO The Time to Dip 👀
It is already claim upward🤑 In AF
Not Open Short Position🚀
When Byers Take Exit Because They Earn Profit Then Market Bearish Move
The market rewards smart entries, and with $49.72M in 24h volume, this one is another perfect example of that. 🚀$XRP Also
#ALGO #berish #TrendingTopic #foryou #TrendingTopic
It is already claim upward🤑 In AF
Not Open Short Position🚀
When Byers Take Exit Because They Earn Profit Then Market Bearish Move
The market rewards smart entries, and with $49.72M in 24h volume, this one is another perfect example of that. 🚀$XRP Also
#ALGO #berish #TrendingTopic #foryou #TrendingTopic
278
·
--
Bearish
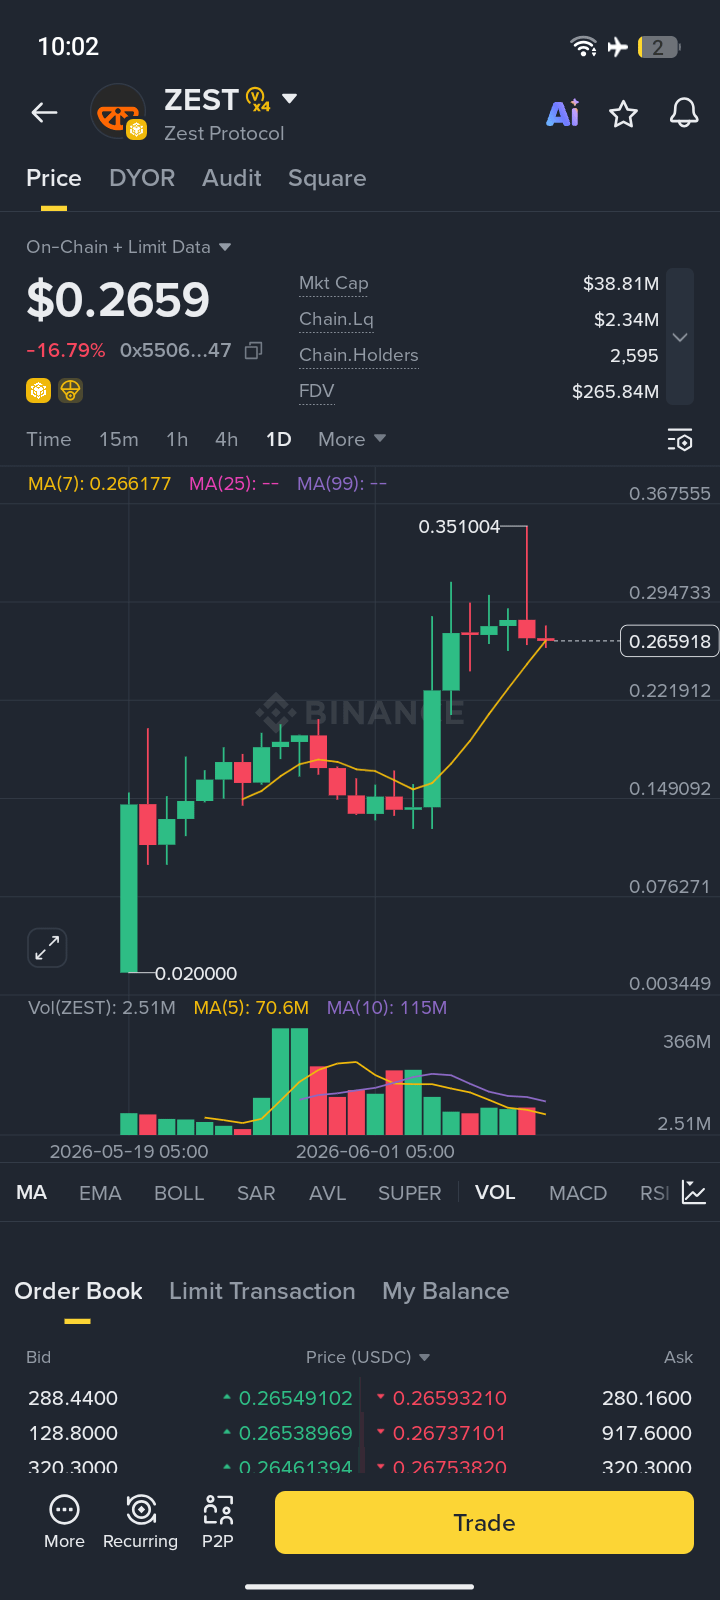
$ZEST holders, be patient, I know the chart is bearish right now. Soon, Zest Coin will show bullish momentum.
Keep holding the $ZEST coin!
#zest #ZestProtocol #berish #CPIWatch
{alpha}(560x5506599c722389a60580b5213ea1da60d64754a1)
$ZEST holders, be patient, I know the chart is bearish right now. Soon, Zest Coin will show bullish momentum.
Keep holding the $ZEST coin!
#zest #ZestProtocol #berish #CPIWatch
Keep holding the $ZEST coin!
#zest #ZestProtocol #berish #CPIWatch
2
705

·
--
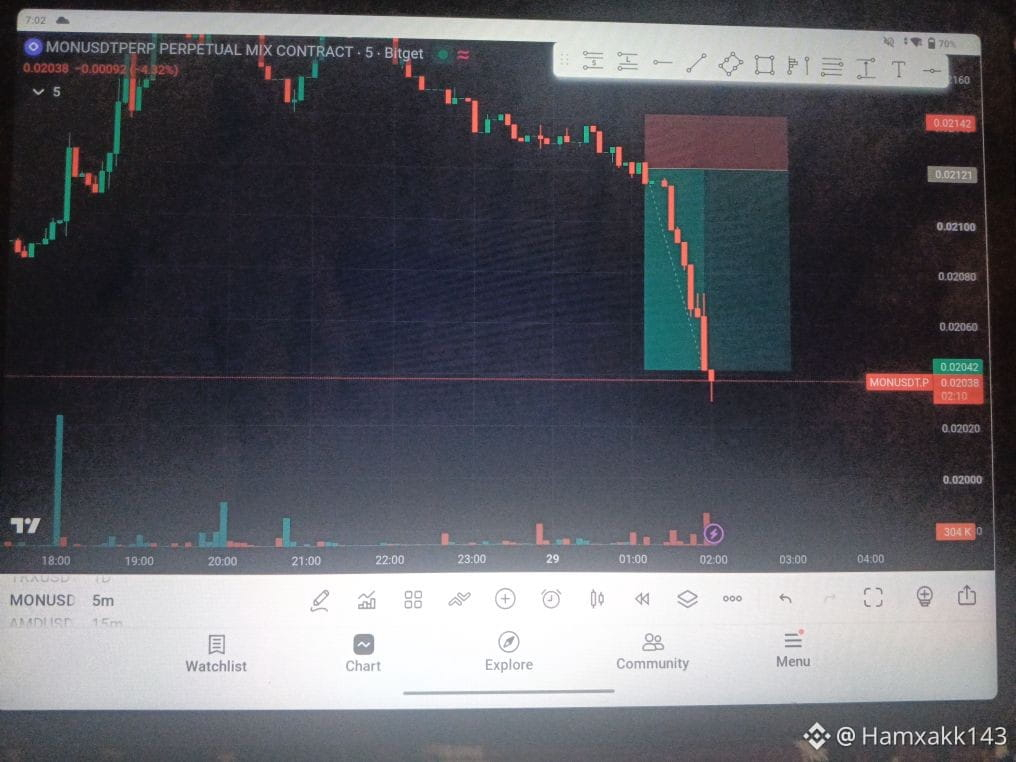
$BERA $ Your PIN, and don't let anyone kiss you#berish
{spot}(BERAUSDT)
$BERA $ Your PIN, and don't let anyone kiss you#berish
User-13f24分复古纯纯粹粹付出才行:
你快点买,好让我们解套
1
315



75

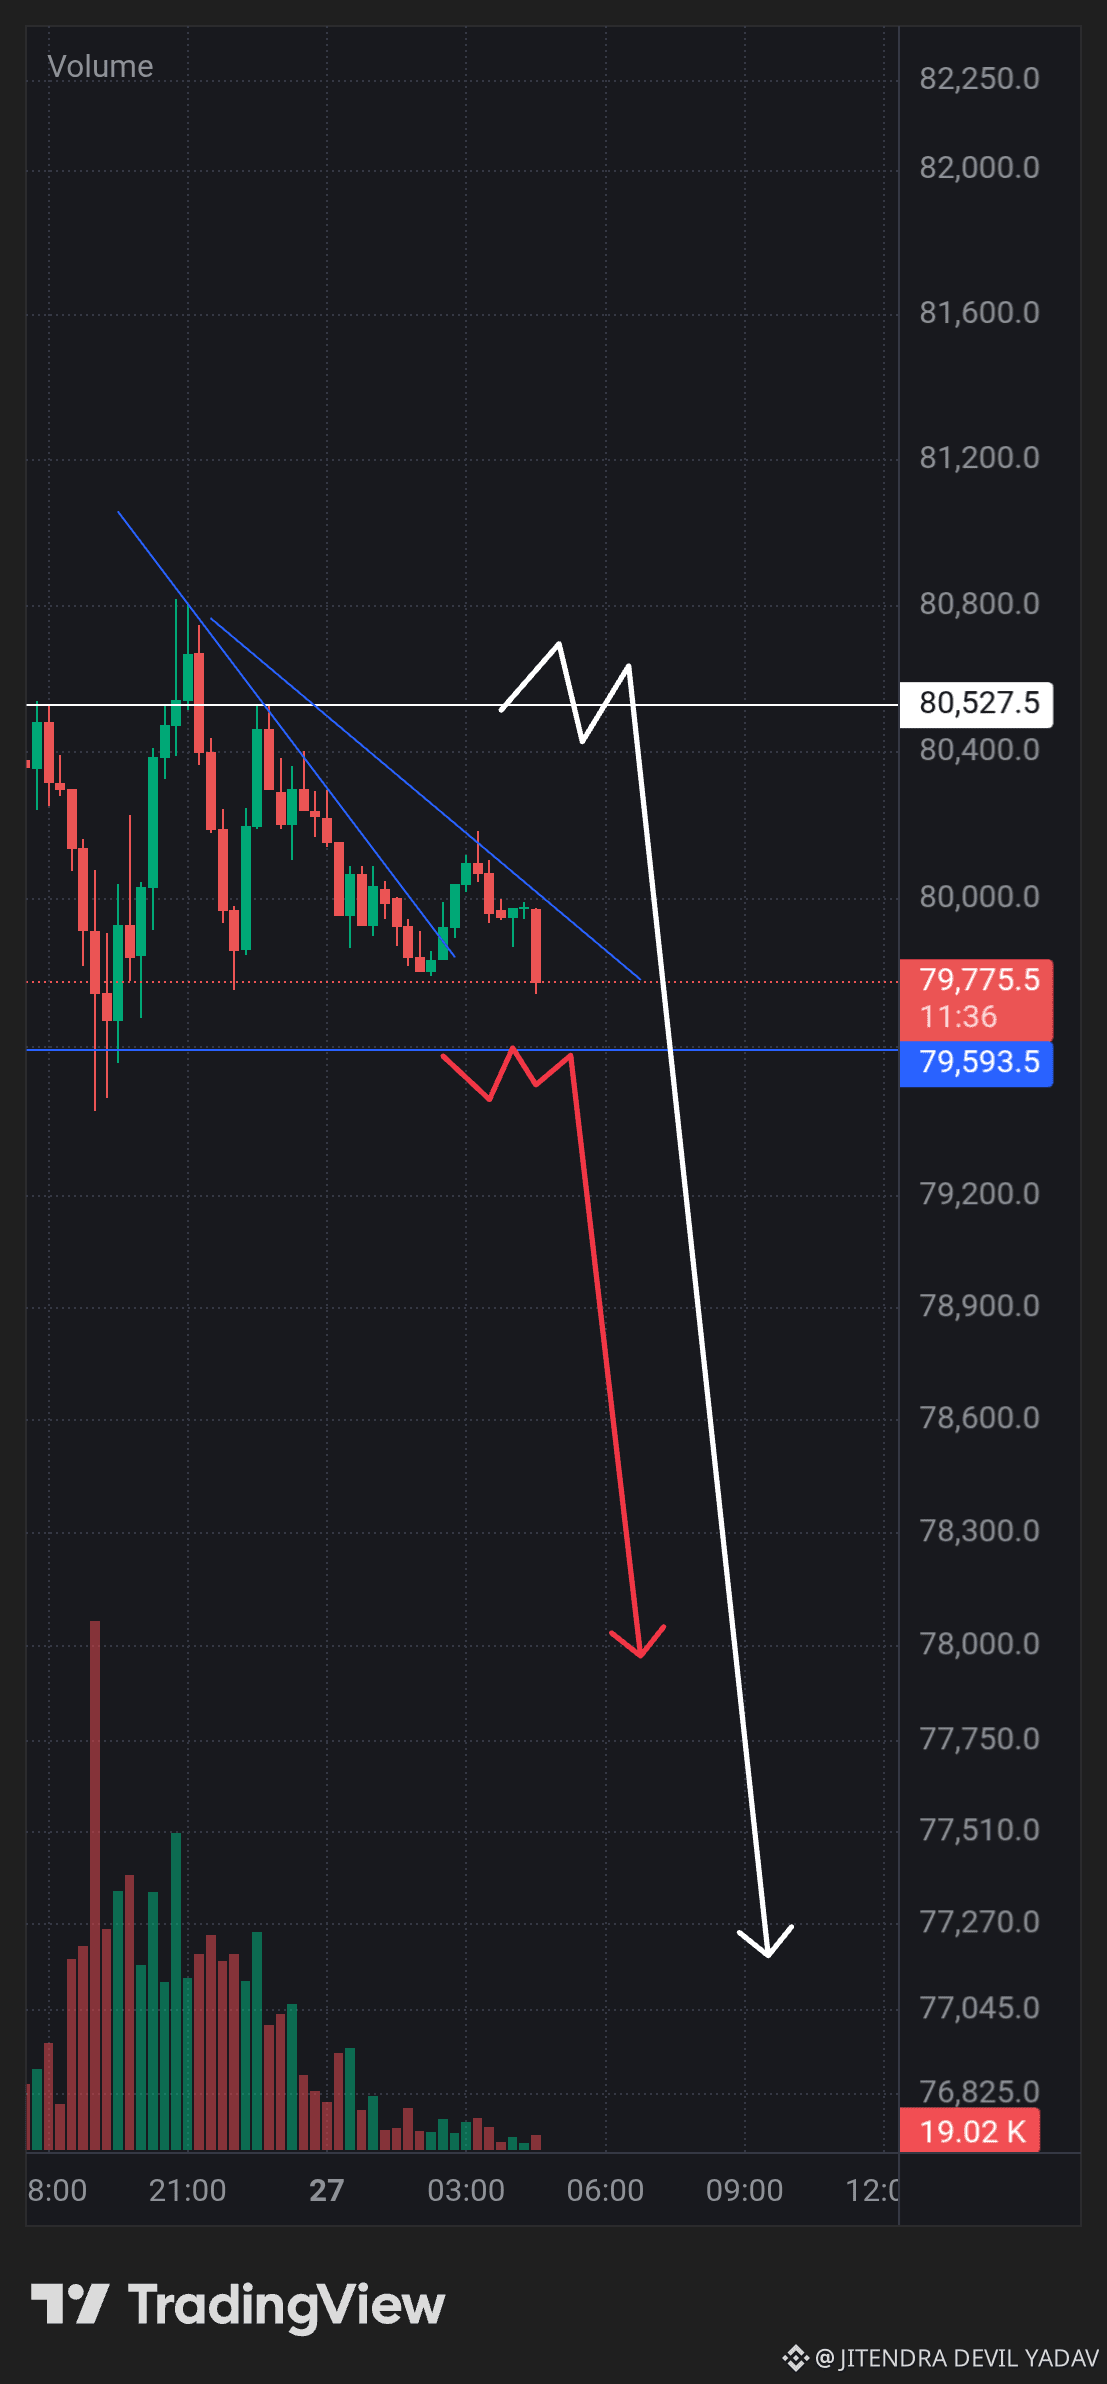
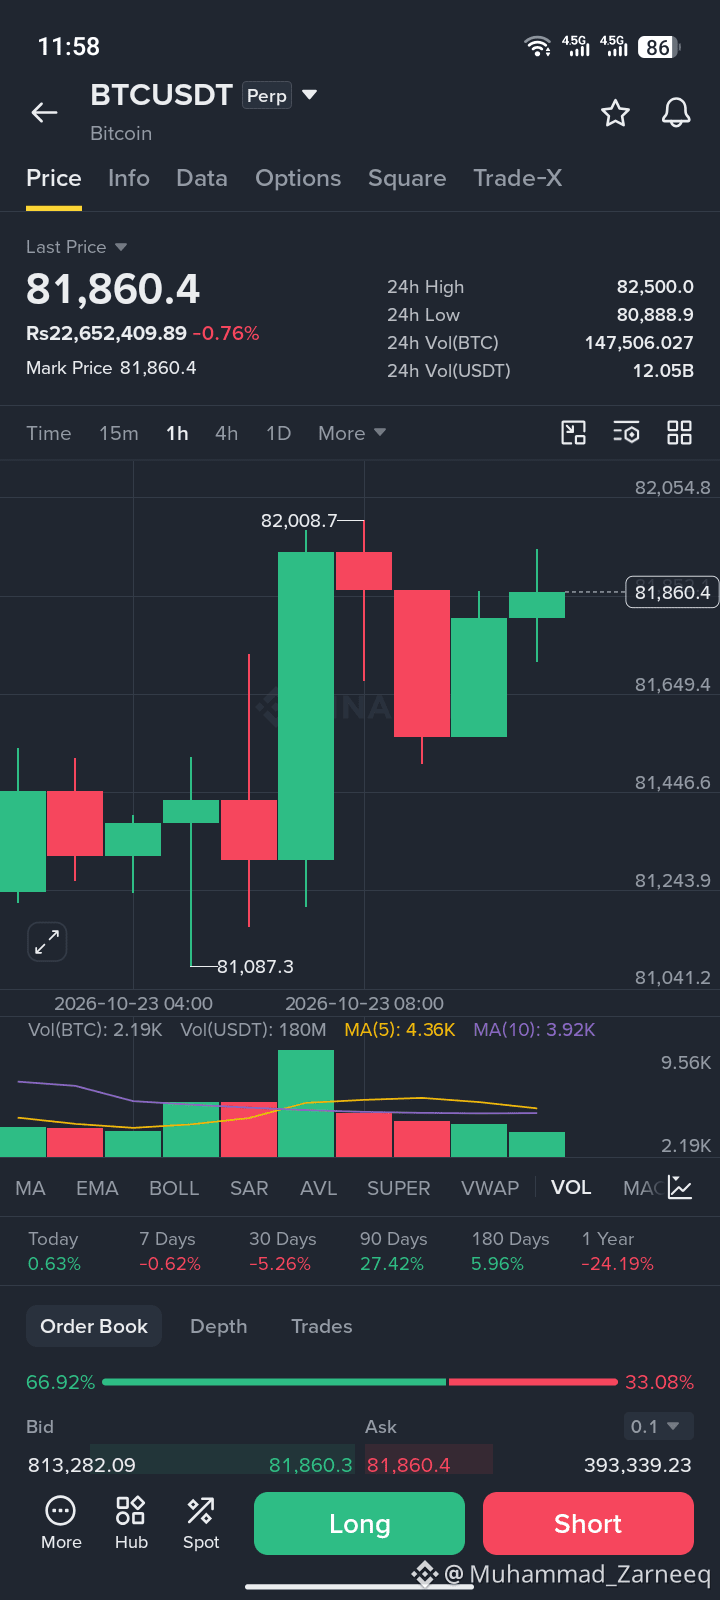
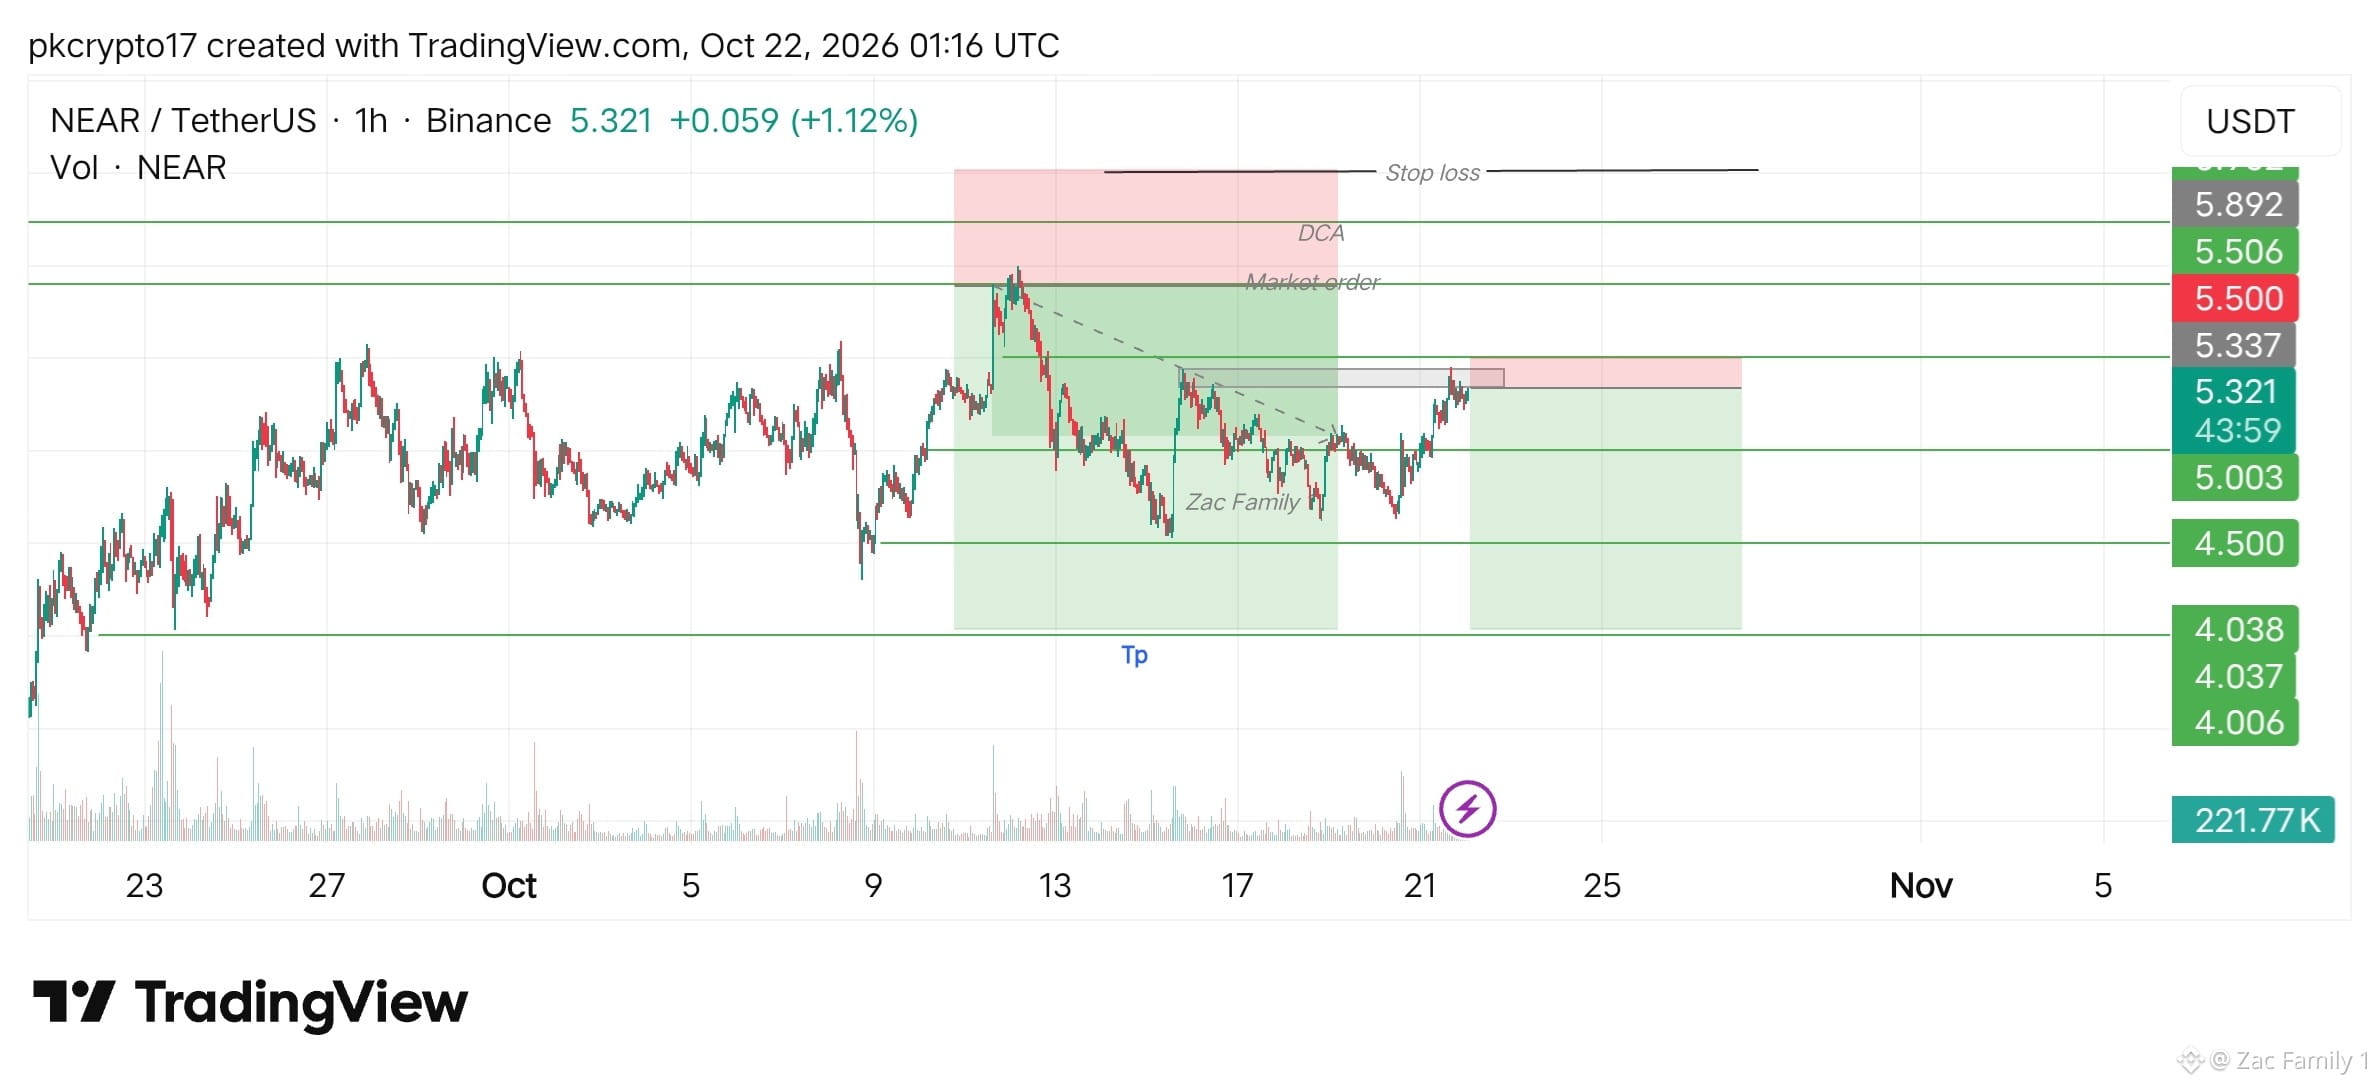
1-Hour Crypto Pulse Check! ⏱️
Where are BTC and the market heading in the next 60 minutes? Cast your vote now! Let's see who gets it right! 👇$BTC $USDT #BTC #Bitcoin❗ #CryptoPoll #bullish #berish
1-Hour Crypto Pulse Check! ⏱️
Where are BTC and the market heading in the next 60 minutes? Cast your vote now! Let's see who gets it right! 👇$BTC $USDT #BTC #Bitcoin❗ #CryptoPoll #bullish #berish
Where are BTC and the market heading in the next 60 minutes? Cast your vote now! Let's see who gets it right! 👇$BTC $USDT #BTC #Bitcoin❗ #CryptoPoll #bullish #berish
82






·
--
Bearish
⚡ Bitcoin Short Setup – 4H Chart Breakdown
Pair: BTC/USDT (Perpetual)
Timeframe: 4-Hour
Current Price: ~112,800 USDT
---
🔥 Why This Setup Stands Out
Bitcoin has printed a massive bearish candle on the 4-hour chart, slicing through key support around 114,500.
Moving Averages: Price is trading well below both the 9 & 21 EMAs, showing strong downside momentum.
Volume Spike: Notice the sharp increase in sell volume, confirming heavy selling pressure.
Structure: Clean breakdown from a tight consolidation, opening room for a quick move lower.
---
🎯 Trade Plan (Example)
(Adjust to your risk profile and live market conditions)
Item Level
Entry Zone 112,700 – 113,000 USDT (minor pullback / retest)
Stop-Loss Above 114,500 – 115,000 USDT
Targets TP1: 110,900 USDT • TP2: 109,000 USDT
---
⚡ Key Notes
Wait for Retest: A small bounce into the entry zone provides a safer short.
Manage Risk: Crypto volatility is high—use proper position sizing.
Trail Stops: Once TP1 is reached, consider moving stop to break-even.
---
💡 This is an educational market idea, not financial advice. Always do your own analysis before taking a trade. #BTC #berish #bitcoin
⚡ Bitcoin Short Setup – 4H Chart Breakdown
Pair: BTC/USDT (Perpetual)
Timeframe: 4-Hour
Current Price: ~112,800 USDT
---
🔥 Why This Setup Stands Out
Bitcoin has printed a massive bearish candle on the 4-hour chart, slicing through key support around 114,500.
Moving Averages: Price is trading well below both the 9 & 21 EMAs, showing strong downside momentum.
Volume Spike: Notice the sharp increase in sell volume, confirming heavy selling pressure.
Structure: Clean breakdown from a tight consolidation, opening room for a quick move lower.
---
🎯 Trade Plan (Example)
(Adjust to your risk profile and live market conditions)
Item Level
Entry Zone 112,700 – 113,000 USDT (minor pullback / retest)
Stop-Loss Above 114,500 – 115,000 USDT
Targets TP1: 110,900 USDT • TP2: 109,000 USDT
---
⚡ Key Notes
Wait for Retest: A small bounce into the entry zone provides a safer short.
Manage Risk: Crypto volatility is high—use proper position sizing.
Trail Stops: Once TP1 is reached, consider moving stop to break-even.
---
💡 This is an educational market idea, not financial advice. Always do your own analysis before taking a trade. #BTC #berish #bitcoin
Pair: BTC/USDT (Perpetual)
Timeframe: 4-Hour
Current Price: ~112,800 USDT
---
🔥 Why This Setup Stands Out
Bitcoin has printed a massive bearish candle on the 4-hour chart, slicing through key support around 114,500.
Moving Averages: Price is trading well below both the 9 & 21 EMAs, showing strong downside momentum.
Volume Spike: Notice the sharp increase in sell volume, confirming heavy selling pressure.
Structure: Clean breakdown from a tight consolidation, opening room for a quick move lower.
---
🎯 Trade Plan (Example)
(Adjust to your risk profile and live market conditions)
Item Level
Entry Zone 112,700 – 113,000 USDT (minor pullback / retest)
Stop-Loss Above 114,500 – 115,000 USDT
Targets TP1: 110,900 USDT • TP2: 109,000 USDT
---
⚡ Key Notes
Wait for Retest: A small bounce into the entry zone provides a safer short.
Manage Risk: Crypto volatility is high—use proper position sizing.
Trail Stops: Once TP1 is reached, consider moving stop to break-even.
---
💡 This is an educational market idea, not financial advice. Always do your own analysis before taking a trade. #BTC #berish #bitcoin
7
33
Log in to explore more content
Join global crypto users on Binance Square
⚡️ Get latest and useful information about crypto.
💬 Trusted by the world’s largest crypto exchange.
👍 Discover real insights from verified creators.
Email / Phone number
Trending Topics
1
#NvidiaInvestigatesAfterHuang’sAffairApology
221,049 views
1,792 Discussing
2
#CPITestsDecemberRateOutlook
671,922 views
2,863 Discussing
3
#AnthropicRejectsIPODelayValuationinQuestion
45,381 views
450 Discussing
4
#BitcoinFiveWeeklyLosses
247,346 views
2,218 Discussing
5
#AIChipSlumpNasdaq
136,337 views
1,367 Discussing
6
#CryptoLiquidationsReach$1.16BIn24Hours
16,398 views
53 Discussing
7
#SharpLinkHolds895117ETHAsOfNovember2
0 views
2 Discussing
8
#AnthropicPreparesIPOAsSoonAsNextWeek
0 views
0 Discussing
9
#StrategyBuys1037BTCLastWeek
149 views
16 Discussing
10
#BlackRockIBITTakesInOver$5BOfHoldersBitcoin
20 views
2 Discussing