
#picycle
picycle
25,627 views
9 Discussing
Hot
Latest

·
--
Why Has Bitcoin's Pi Cycle Bottom Fired Four Times but Its Top Twin Only Once?$BTC | Bitcoin's Pi Cycle Bottom has fired four times on AUD data since 2014, but its sibling Pi Cycle Top indicator has only completed once, in December 2017. The asymmetry is structural. Bear markets grind slowly enough for a 150 day average to catch up with a 471 day one, while bull tops move too fast to let the same crossover finish.
## What Is the Asymmetry Actually Showing?
On the desk the first thing I check after a signal fires is whether the sample actually supports confidence, not just whether a line crossed. SatoshiMacro's Pi Cycle Bottom page puts the ratio at 1.138 as of 19 November 2026, inside the Bottom signal forming band that runs 0.96 to 1.43. That is the fourth AUD firing in the indicator's history, with the 150 day average crossing back above the adjusted 471 day line on 1 September 2026 at A$108,493. The Pi Cycle Top, built the mirror way around (111 day average against 350 day times two), has only completed once on AUD prices, back in December 2017. Four firings against one is not a small gap.
## Why Did the 2021 Top Never Confirm?
The gap is not a fluke. In April 2021 the AUD ratio peaked near 0.976 and never crossed 1.0, so the crossover that caught the 2013 and 2017 tops on USD data simply did not fire on AUD through the biggest bull run in the dataset. My read is that a short, violent blow-off top does not give two slow moving averages time to converge the way a multi-month bear grind does. Every bottom in this model's history sits in the bottom 10 percent of the ratio's 4,601-reading distribution since April 2014, each one landing roughly four to six months after the actual price low. The only confirmed top had months of distribution behind it before its crossover triggered. Tops are fast. Bottoms are slow.
## Does That Make the Bottom Signal More Trustworthy?
Not automatically. Four firings is still a small sample, and SatoshiMacro's own page flags the 0.745 multiplier and the 471 day window as empirically fitted rather than theory driven. The 471 figure is roughly 150 multiplied by pi, which is a tidy piece of arithmetic and nothing more; it was chosen because it worked on past bottoms, not because it describes any mechanism in how Bitcoin trades. The signal also missed entirely through the March 2020 COVID crash, because that was a liquidity shock, not a cycle bottom, and a trailing moving average crossover has no way to tell the two apart in real time. Each of the three completed bottom firings, July 2015, May 2019 and March 2023, was followed by a new cycle high within that cycle. That is three data points, not a law of markets.
## Why Won't the Page Just Call It a Buy Signal?
Because it does not know how to, and it says so. The page declines to turn a firing into a buy call and instead points to a short cross-check list: Mayer Multiple under 0.6, an MVRV Z-Score proxy under 0.08, and the Fear and Greed Index under 25. None of those three thresholds is automatically true just because the Pi Cycle Bottom ratio has crossed 1.0. A trailing crossover and a valuation ratio can disagree, and when they do the honest answer is that the picture is mixed, not that one overrides the other.
## What Would I Actually Do With This?
I treat the asymmetry as a reminder that trailing crossovers are built for grinding reversals, not sharp ones, and I size around that rather than trading the cross itself. SatoshiMacro's own model carries this indicator at 25 percent of its Valuation tier precisely because no single crossover should carry a position on its own. For AU holders sitting on this signal, the practical layer is still the 12 month CGT discount clock. If a bottom reading pushes you to add to a position, the date of that purchase decides whether a profitable exit in the next cycle gets taxed on the full gain or on half of it. That timing decision matters more than the signal itself.
## The Limitation Worth Repeating
Both averages are trailing by design, so every one of these four firings confirmed a low that had already happened months earlier, typically four to six months after the fact on the page's own record. This is a position classifier working off history, not a forecaster calling the next one. The gap between four bottom firings and one top firing says something real about how markets move at extremes, bleeding out slowly and topping fast, but it is not a guarantee the pattern holds a fifth time. Treat the count as context, not as a trade.
https://satoshimacro.com/tools/crypto/cycle-indicators/bitcoin-pi-cycle-bottom-indicator/?utm_source=binance_square&utm_medium=social&utm_campaign=autopilot_article
#SatoshiMacro #PiCycle #BitcoinCycle #Bitcoin
Why Has Bitcoin's Pi Cycle Bottom Fired Four Times but Its Top Twin Only Once?
$BTC | Bitcoin's Pi Cycle Bottom has fired four times on AUD data since 2014, but its sibling Pi Cycle Top indicator has only completed once, in December 2017. The asymmetry is structural. Bear markets grind slowly enough for a 150 day average to catch up with a 471 day one, while bull tops move too fast to let the same crossover finish.
## What Is the Asymmetry Actually Showing?
On the desk the first thing I check after a signal fires is whether the sample actually supports confidence, not just whether a line crossed. SatoshiMacro's Pi Cycle Bottom page puts the ratio at 1.138 as of 19 November 2026, inside the Bottom signal forming band that runs 0.96 to 1.43. That is the fourth AUD firing in the indicator's history, with the 150 day average crossing back above the adjusted 471 day line on 1 September 2026 at A$108,493. The Pi Cycle Top, built the mirror way around (111 day average against 350 day times two), has only completed once on AUD prices, back in December 2017. Four firings against one is not a small gap.
## Why Did the 2021 Top Never Confirm?
The gap is not a fluke. In April 2021 the AUD ratio peaked near 0.976 and never crossed 1.0, so the crossover that caught the 2013 and 2017 tops on USD data simply did not fire on AUD through the biggest bull run in the dataset. My read is that a short, violent blow-off top does not give two slow moving averages time to converge the way a multi-month bear grind does. Every bottom in this model's history sits in the bottom 10 percent of the ratio's 4,601-reading distribution since April 2014, each one landing roughly four to six months after the actual price low. The only confirmed top had months of distribution behind it before its crossover triggered. Tops are fast. Bottoms are slow.
## Does That Make the Bottom Signal More Trustworthy?
Not automatically. Four firings is still a small sample, and SatoshiMacro's own page flags the 0.745 multiplier and the 471 day window as empirically fitted rather than theory driven. The 471 figure is roughly 150 multiplied by pi, which is a tidy piece of arithmetic and nothing more; it was chosen because it worked on past bottoms, not because it describes any mechanism in how Bitcoin trades. The signal also missed entirely through the March 2020 COVID crash, because that was a liquidity shock, not a cycle bottom, and a trailing moving average crossover has no way to tell the two apart in real time. Each of the three completed bottom firings, July 2015, May 2019 and March 2023, was followed by a new cycle high within that cycle. That is three data points, not a law of markets.
## Why Won't the Page Just Call It a Buy Signal?
Because it does not know how to, and it says so. The page declines to turn a firing into a buy call and instead points to a short cross-check list: Mayer Multiple under 0.6, an MVRV Z-Score proxy under 0.08, and the Fear and Greed Index under 25. None of those three thresholds is automatically true just because the Pi Cycle Bottom ratio has crossed 1.0. A trailing crossover and a valuation ratio can disagree, and when they do the honest answer is that the picture is mixed, not that one overrides the other.
## What Would I Actually Do With This?
I treat the asymmetry as a reminder that trailing crossovers are built for grinding reversals, not sharp ones, and I size around that rather than trading the cross itself. SatoshiMacro's own model carries this indicator at 25 percent of its Valuation tier precisely because no single crossover should carry a position on its own. For AU holders sitting on this signal, the practical layer is still the 12 month CGT discount clock. If a bottom reading pushes you to add to a position, the date of that purchase decides whether a profitable exit in the next cycle gets taxed on the full gain or on half of it. That timing decision matters more than the signal itself.
## The Limitation Worth Repeating
Both averages are trailing by design, so every one of these four firings confirmed a low that had already happened months earlier, typically four to six months after the fact on the page's own record. This is a position classifier working off history, not a forecaster calling the next one. The gap between four bottom firings and one top firing says something real about how markets move at extremes, bleeding out slowly and topping fast, but it is not a guarantee the pattern holds a fifth time. Treat the count as context, not as a trade.
https://satoshimacro.com/tools/crypto/cycle-indicators/bitcoin-pi-cycle-bottom-indicator/?utm_source=binance_square&utm_medium=social&utm_campaign=autopilot_article
#SatoshiMacro #PiCycle #BitcoinCycle #Bitcoin
## What Is the Asymmetry Actually Showing?
On the desk the first thing I check after a signal fires is whether the sample actually supports confidence, not just whether a line crossed. SatoshiMacro's Pi Cycle Bottom page puts the ratio at 1.138 as of 19 November 2026, inside the Bottom signal forming band that runs 0.96 to 1.43. That is the fourth AUD firing in the indicator's history, with the 150 day average crossing back above the adjusted 471 day line on 1 September 2026 at A$108,493. The Pi Cycle Top, built the mirror way around (111 day average against 350 day times two), has only completed once on AUD prices, back in December 2017. Four firings against one is not a small gap.
## Why Did the 2021 Top Never Confirm?
The gap is not a fluke. In April 2021 the AUD ratio peaked near 0.976 and never crossed 1.0, so the crossover that caught the 2013 and 2017 tops on USD data simply did not fire on AUD through the biggest bull run in the dataset. My read is that a short, violent blow-off top does not give two slow moving averages time to converge the way a multi-month bear grind does. Every bottom in this model's history sits in the bottom 10 percent of the ratio's 4,601-reading distribution since April 2014, each one landing roughly four to six months after the actual price low. The only confirmed top had months of distribution behind it before its crossover triggered. Tops are fast. Bottoms are slow.
## Does That Make the Bottom Signal More Trustworthy?
Not automatically. Four firings is still a small sample, and SatoshiMacro's own page flags the 0.745 multiplier and the 471 day window as empirically fitted rather than theory driven. The 471 figure is roughly 150 multiplied by pi, which is a tidy piece of arithmetic and nothing more; it was chosen because it worked on past bottoms, not because it describes any mechanism in how Bitcoin trades. The signal also missed entirely through the March 2020 COVID crash, because that was a liquidity shock, not a cycle bottom, and a trailing moving average crossover has no way to tell the two apart in real time. Each of the three completed bottom firings, July 2015, May 2019 and March 2023, was followed by a new cycle high within that cycle. That is three data points, not a law of markets.
## Why Won't the Page Just Call It a Buy Signal?
Because it does not know how to, and it says so. The page declines to turn a firing into a buy call and instead points to a short cross-check list: Mayer Multiple under 0.6, an MVRV Z-Score proxy under 0.08, and the Fear and Greed Index under 25. None of those three thresholds is automatically true just because the Pi Cycle Bottom ratio has crossed 1.0. A trailing crossover and a valuation ratio can disagree, and when they do the honest answer is that the picture is mixed, not that one overrides the other.
## What Would I Actually Do With This?
I treat the asymmetry as a reminder that trailing crossovers are built for grinding reversals, not sharp ones, and I size around that rather than trading the cross itself. SatoshiMacro's own model carries this indicator at 25 percent of its Valuation tier precisely because no single crossover should carry a position on its own. For AU holders sitting on this signal, the practical layer is still the 12 month CGT discount clock. If a bottom reading pushes you to add to a position, the date of that purchase decides whether a profitable exit in the next cycle gets taxed on the full gain or on half of it. That timing decision matters more than the signal itself.
## The Limitation Worth Repeating
Both averages are trailing by design, so every one of these four firings confirmed a low that had already happened months earlier, typically four to six months after the fact on the page's own record. This is a position classifier working off history, not a forecaster calling the next one. The gap between four bottom firings and one top firing says something real about how markets move at extremes, bleeding out slowly and topping fast, but it is not a guarantee the pattern holds a fifth time. Treat the count as context, not as a trade.
https://satoshimacro.com/tools/crypto/cycle-indicators/bitcoin-pi-cycle-bottom-indicator/?utm_source=binance_square&utm_medium=social&utm_campaign=autopilot_article
#SatoshiMacro #PiCycle #BitcoinCycle #Bitcoin
89

·
--
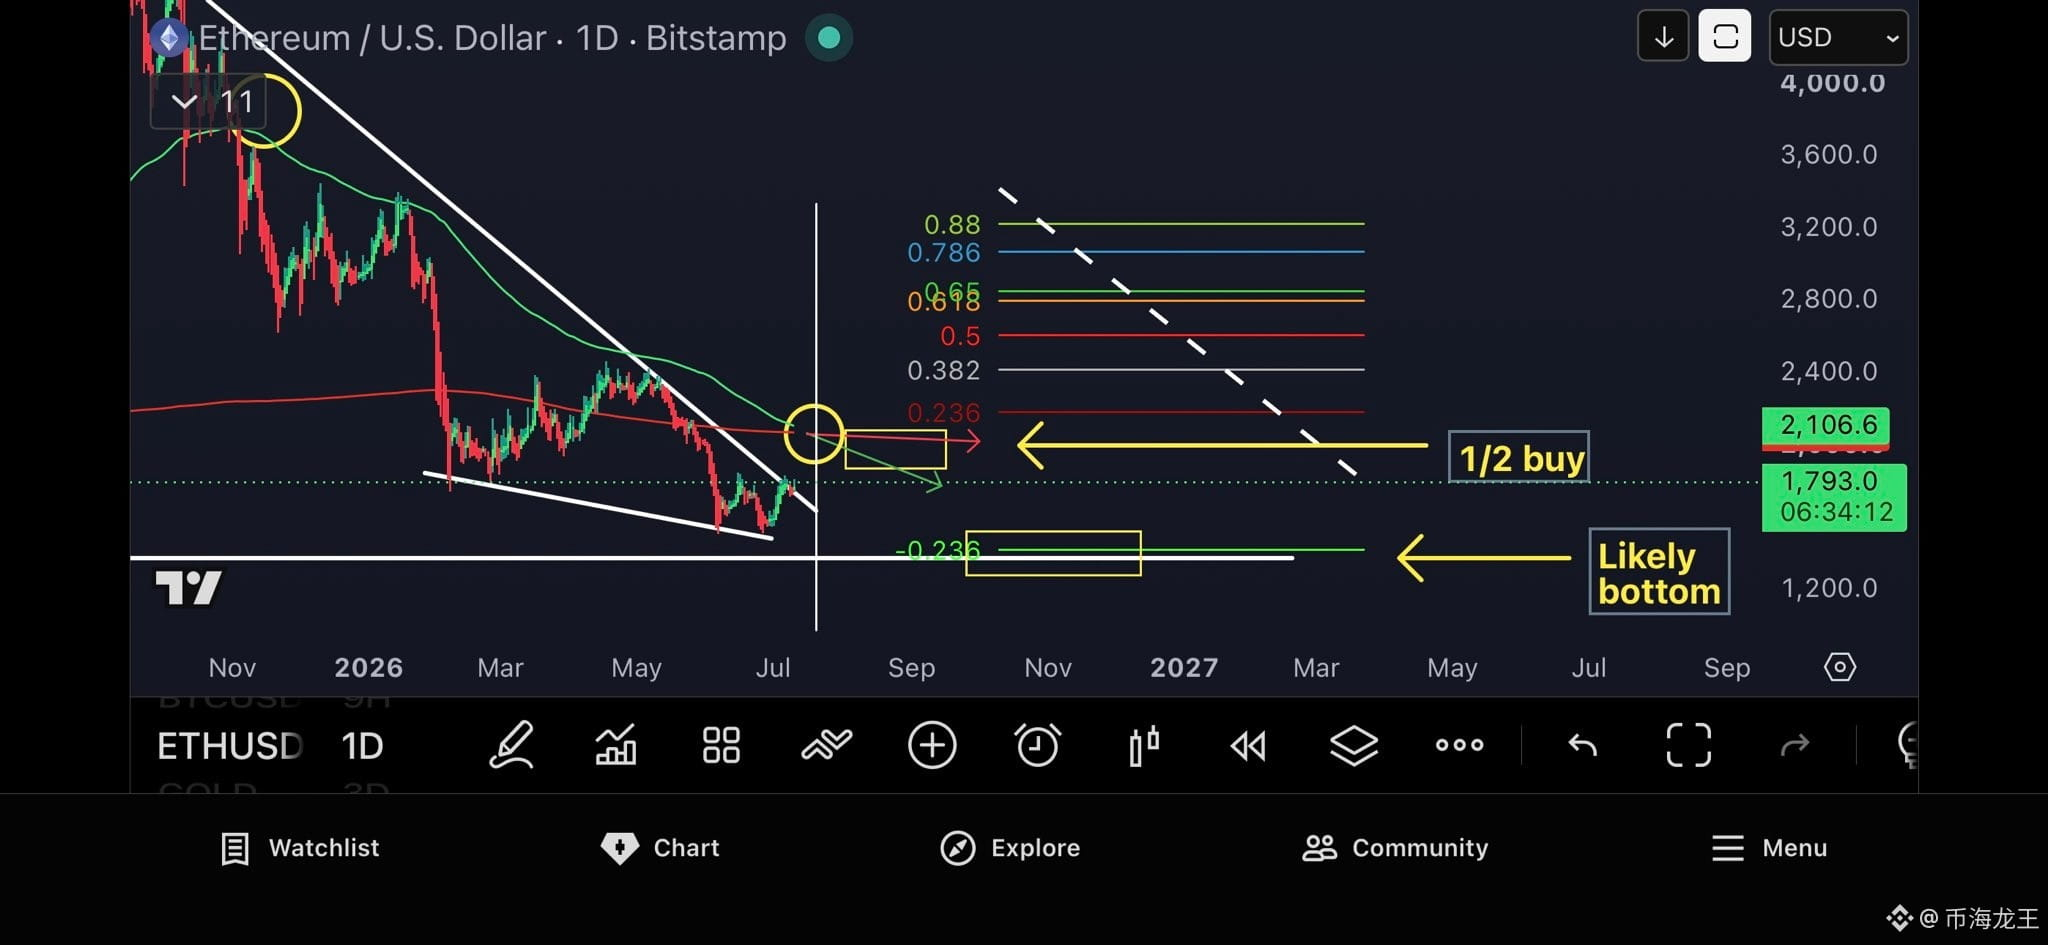
🚨🛑 停!ETH Pi Cycle Bottom 指标即将发出关键底部信号!
📉 $ETH 正接近 Pi Cycle Bottom Indicator 的下穿信号,这可能意味着本轮调整已进入最后阶段。
历史数据显示,该指标在接近交叉时,ETH 往往距离阶段性底部已经不远。
📊 市场观察
🔻 Pi Cycle Bottom 即将形成交叉。
📅 若历史规律再次上演,阶段性底部可能出现在 7 月底附近。
📉 根据过往周期,价格低点通常出现在交叉前后约 10% 的波动范围内。
🐢 投资策略
🟢 当前可考虑开始 分批建仓(Turtle Accumulation),而不是一次性重仓买入。
📈 若后续 3 日周期再次形成看涨交叉(Bullish Cross),将进一步确认趋势反转,届时可考虑增加仓位。
🎯 长期目标
若市场成功完成筑底并进入新一轮上涨周期,
🚀 3,400 美元将成为值得关注的中长期目标区域。
⚠️ 提醒:
Pi Cycle Bottom 是一种参考工具,并非百分之百准确。任何交易决策都应结合价格走势、成交量和风险管理综合判断。
以上内容仅为市场分析与学习交流,不构成任何投资建议。
#ETH #Ethereum #Crypto #Trading #PiCycle #TechnicalAnalysis #Accumulation #Bullish #CryptoMarket #加密货币 #以太坊
{future}(ETHUSDT)
🚨🛑 停!ETH Pi Cycle Bottom 指标即将发出关键底部信号!
📉 $ETH 正接近 Pi Cycle Bottom Indicator 的下穿信号,这可能意味着本轮调整已进入最后阶段。
历史数据显示,该指标在接近交叉时,ETH 往往距离阶段性底部已经不远。
📊 市场观察
🔻 Pi Cycle Bottom 即将形成交叉。
📅 若历史规律再次上演,阶段性底部可能出现在 7 月底附近。
📉 根据过往周期,价格低点通常出现在交叉前后约 10% 的波动范围内。
🐢 投资策略
🟢 当前可考虑开始 分批建仓(Turtle Accumulation),而不是一次性重仓买入。
📈 若后续 3 日周期再次形成看涨交叉(Bullish Cross),将进一步确认趋势反转,届时可考虑增加仓位。
🎯 长期目标
若市场成功完成筑底并进入新一轮上涨周期,
🚀 3,400 美元将成为值得关注的中长期目标区域。
⚠️ 提醒:
Pi Cycle Bottom 是一种参考工具,并非百分之百准确。任何交易决策都应结合价格走势、成交量和风险管理综合判断。
以上内容仅为市场分析与学习交流,不构成任何投资建议。
#ETH #Ethereum #Crypto #Trading #PiCycle #TechnicalAnalysis #Accumulation #Bullish #CryptoMarket #加密货币 #以太坊
📉 $ETH 正接近 Pi Cycle Bottom Indicator 的下穿信号,这可能意味着本轮调整已进入最后阶段。
历史数据显示,该指标在接近交叉时,ETH 往往距离阶段性底部已经不远。
📊 市场观察
🔻 Pi Cycle Bottom 即将形成交叉。
📅 若历史规律再次上演,阶段性底部可能出现在 7 月底附近。
📉 根据过往周期,价格低点通常出现在交叉前后约 10% 的波动范围内。
🐢 投资策略
🟢 当前可考虑开始 分批建仓(Turtle Accumulation),而不是一次性重仓买入。
📈 若后续 3 日周期再次形成看涨交叉(Bullish Cross),将进一步确认趋势反转,届时可考虑增加仓位。
🎯 长期目标
若市场成功完成筑底并进入新一轮上涨周期,
🚀 3,400 美元将成为值得关注的中长期目标区域。
⚠️ 提醒:
Pi Cycle Bottom 是一种参考工具,并非百分之百准确。任何交易决策都应结合价格走势、成交量和风险管理综合判断。
以上内容仅为市场分析与学习交流,不构成任何投资建议。
#ETH #Ethereum #Crypto #Trading #PiCycle #TechnicalAnalysis #Accumulation #Bullish #CryptoMarket #加密货币 #以太坊
70

·
--
Bullish
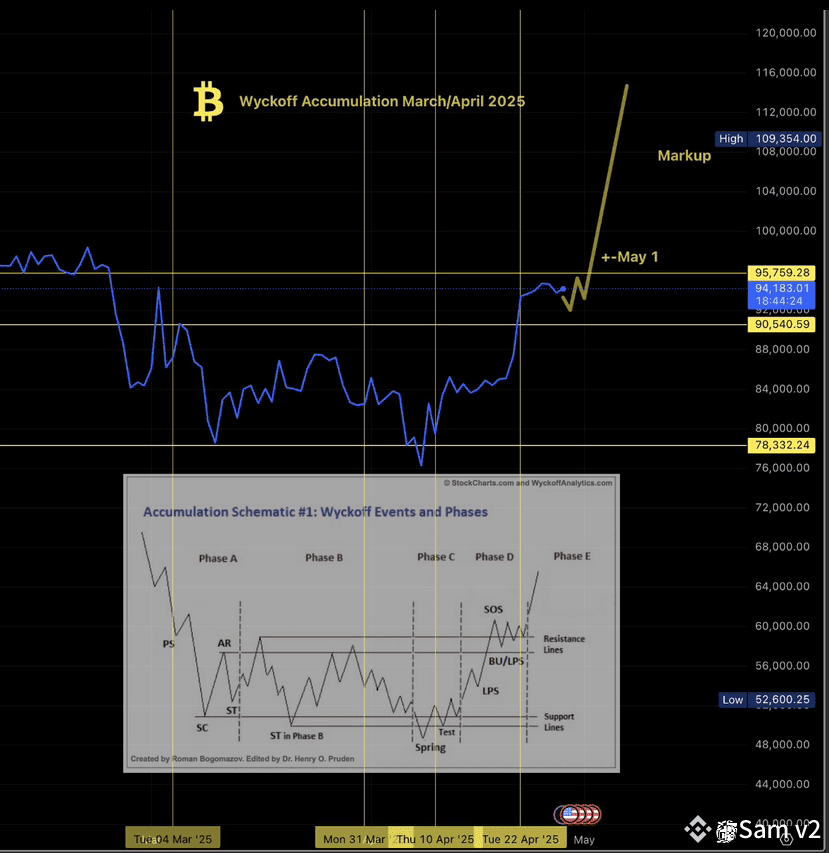
🟢To is a Crucial day for the entire CRYPTO market, let’s see how market responds.🟢
1)Pi Cycle
The next #Bitcoin $BTC top could reach $155,400 based on the Pi Cycle Top indicator. The only condition is that prices must stay above $91,400.
2)The New Whales 🐳
Welcome 100 new whales holding over 1,000 #BTC since late January.
3)ETFS
US SPOT ETFS BOUGHT 33,500 BITCOIN THIS WEEK WHILE ONLY 3,150 WERE MINED ON AVERAGE
SUPPLY SKYHIGH!
4)Massive inflows continue.
U.S. ETF flows last week (Apr 21–25)
Bitcoin spot ETFs added 33,500 $BTC ($3B)
Ethereum spot ETFs added 89,200 $ETH ($157M)
5)CZ BNB Tweets
I hope you bought the dip. 😆🤷♂️
CONCLUSION : The mega 🐂 is preparing 🚀
Comment your thought 💭
$XRP
#SaylorBTCPurchase #xrpetf #bitcoin #cz #picycle
🟢To is a Crucial day for the entire CRYPTO market, let’s see how market responds.🟢
1)Pi Cycle
The next #Bitcoin $BTC top could reach $155,400 based on the Pi Cycle Top indicator. The only condition is that prices must stay above $91,400.
2)The New Whales 🐳
Welcome 100 new whales holding over 1,000 #BTC since late January.
3)ETFS
US SPOT ETFS BOUGHT 33,500 BITCOIN THIS WEEK WHILE ONLY 3,150 WERE MINED ON AVERAGE
SUPPLY SKYHIGH!
4)Massive inflows continue.
U.S. ETF flows last week (Apr 21–25)
Bitcoin spot ETFs added 33,500 $BTC ($3B)
Ethereum spot ETFs added 89,200 $ETH ($157M)
5)CZ BNB Tweets
I hope you bought the dip. 😆🤷♂️
CONCLUSION : The mega 🐂 is preparing 🚀
Comment your thought 💭
$XRP
#SaylorBTCPurchase #xrpetf #bitcoin #cz #picycle
1)Pi Cycle
The next #Bitcoin $BTC top could reach $155,400 based on the Pi Cycle Top indicator. The only condition is that prices must stay above $91,400.
2)The New Whales 🐳
Welcome 100 new whales holding over 1,000 #BTC since late January.
3)ETFS
US SPOT ETFS BOUGHT 33,500 BITCOIN THIS WEEK WHILE ONLY 3,150 WERE MINED ON AVERAGE
SUPPLY SKYHIGH!
4)Massive inflows continue.
U.S. ETF flows last week (Apr 21–25)
Bitcoin spot ETFs added 33,500 $BTC ($3B)
Ethereum spot ETFs added 89,200 $ETH ($157M)
5)CZ BNB Tweets
I hope you bought the dip. 😆🤷♂️
CONCLUSION : The mega 🐂 is preparing 🚀
Comment your thought 💭
$XRP
#SaylorBTCPurchase #xrpetf #bitcoin #cz #picycle


2
674
Log in to explore more content
Join global crypto users on Binance Square
⚡️ Get latest and useful information about crypto.
💬 Trusted by the world’s largest crypto exchange.
👍 Discover real insights from verified creators.
Email / Phone number
Trending Topics
1
#CanBTCReboundAfterFallingBelow60K?
133,121 views
538 Discussing
2
#GlobalStocksFaceLongestLosingStreakSince2023
56,489 views
518 Discussing
3
#AnthropicPlungesTowardIPOPriceonDay2
19,979 views
215 Discussing
4
#BNBDropsBelow540USDTWith8.46%DailyDecline
0 views
5 Discussing
5
#MorganStanleyEndsAnthropicStockSupportAfterOneDay
0 views
1 Discussing
6
#CryptoBilisAttackerMoves25000ETHToTornadoCash
0 views
3 Discussing
7
#GaoTengBitcoinETFListsOnHKEX
38,582 views
392 Discussing
8
#TradFiForBeginners
1M views
5,845 Discussing
9
#NvidiaBoardReportedlySplitOverHuang’sReturn
407,525 views
2,585 Discussing
10
#TetherBurns8BillionUSDTInPast20Days
48,091 views
164 Discussing