
#pepe_expert
pepe_expert
11.3M views
5,000 Discussing
Hot
Latest

·
--
Partly True
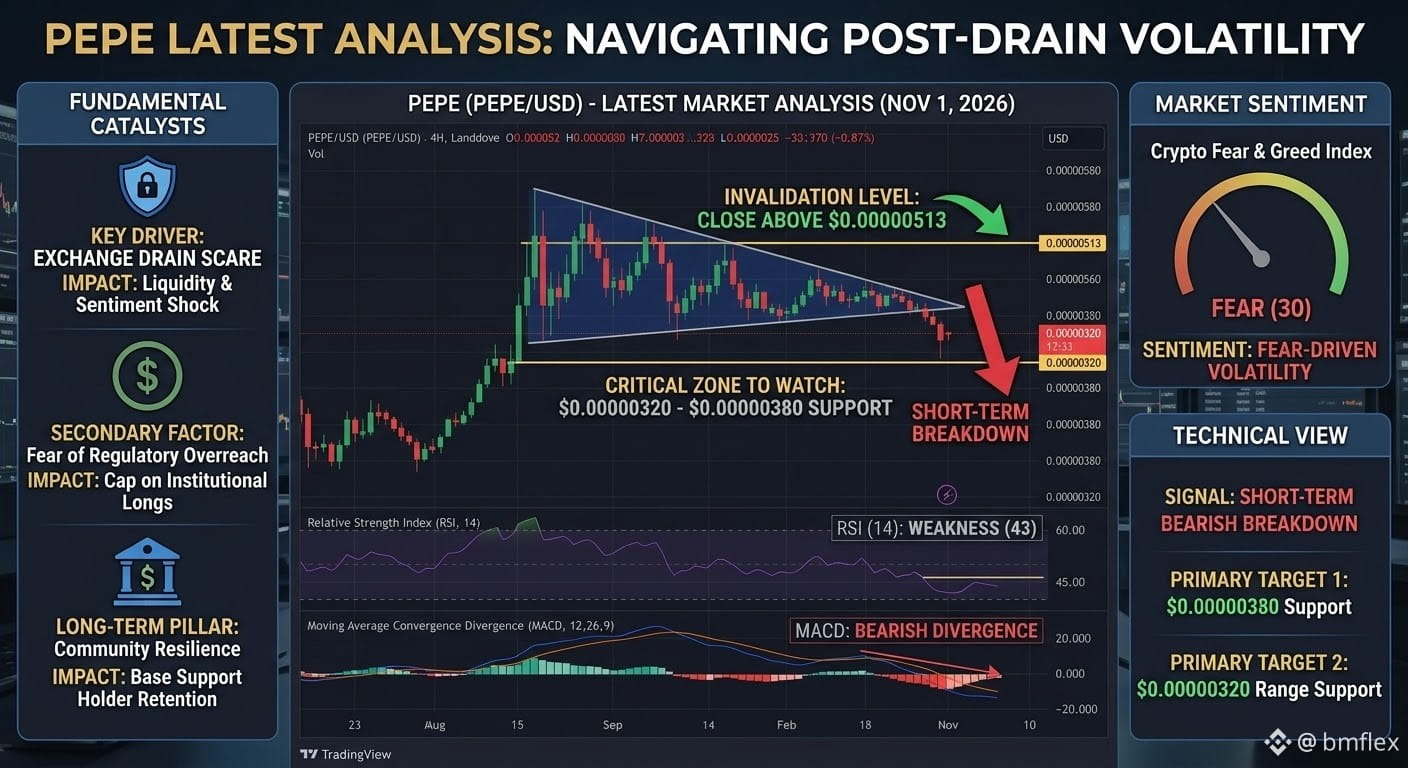
$PEPE 📈 *Market Trend: BULLISH / Volatile Recovery*
PEPE (PEPE/USD) rebounding after Binance hacker dump. Hackers sold 7.77 Trillion PEPE (∼$31M) on Oct 29-30, but whales bought dip. Still one of the strongest meme coins this week.
{spot}(PEPEUSDT)
#pepe⚡ #PEPE_EXPERT #PEPE市值超越LTC #PEPE✈ #PEPE市值超越LTC
- *Current price:* Around $0.00000486 - $0.00000501 (approx.)
- *🔴 Resistance:* $0.00000523 - $0.00000568 - $0.00000617
- *🟢 Support:* $0.00000481 (swing low) / $0.00000455 - $0.00000466
- *📉 Outlook:* Short-term mixed. Trading above 50 & 200-day EMA (Golden Cross). RSI ∼62-68 near overbought.
- *📈 Bullish scenario:* Daily close above $0.00000536 confirms continuation to $0.000006 - $0.000007
- *🎯 Trading Bias:* BUY on dip near $0.0000046-$0.0000048; breakdown below $0.00000455 risks $0.00000387
$PEPE 📈 *Market Trend: BULLISH / Volatile Recovery*
PEPE (PEPE/USD) rebounding after Binance hacker dump. Hackers sold 7.77 Trillion PEPE (∼$31M) on Oct 29-30, but whales bought dip. Still one of the strongest meme coins this week.
#pepe⚡ #PEPE_EXPERT #PEPE市值超越LTC #PEPE✈ #PEPE市值超越LTC
- *Current price:* Around $0.00000486 - $0.00000501 (approx.)
- *🔴 Resistance:* $0.00000523 - $0.00000568 - $0.00000617
- *🟢 Support:* $0.00000481 (swing low) / $0.00000455 - $0.00000466
- *📉 Outlook:* Short-term mixed. Trading above 50 & 200-day EMA (Golden Cross). RSI ∼62-68 near overbought.
- *📈 Bullish scenario:* Daily close above $0.00000536 confirms continuation to $0.000006 - $0.000007
- *🎯 Trading Bias:* BUY on dip near $0.0000046-$0.0000048; breakdown below $0.00000455 risks $0.00000387
PEPE (PEPE/USD) rebounding after Binance hacker dump. Hackers sold 7.77 Trillion PEPE (∼$31M) on Oct 29-30, but whales bought dip. Still one of the strongest meme coins this week.
#pepe⚡ #PEPE_EXPERT #PEPE市值超越LTC #PEPE✈ #PEPE市值超越LTC
- *Current price:* Around $0.00000486 - $0.00000501 (approx.)
- *🔴 Resistance:* $0.00000523 - $0.00000568 - $0.00000617
- *🟢 Support:* $0.00000481 (swing low) / $0.00000455 - $0.00000466
- *📉 Outlook:* Short-term mixed. Trading above 50 & 200-day EMA (Golden Cross). RSI ∼62-68 near overbought.
- *📈 Bullish scenario:* Daily close above $0.00000536 confirms continuation to $0.000006 - $0.000007
- *🎯 Trading Bias:* BUY on dip near $0.0000046-$0.0000048; breakdown below $0.00000455 risks $0.00000387
2
634

·
--
#pepe⚡ PEPE to USD live price, market cap, and chart](https://images.openai.com/static-rsc-4/u9RiKk3AX44AcnxvrQ5RZAFnWF35Qj4sH5KiUoQc2kwqq_ikFcSZw22RgXqhoVNeAw4u-BWQo2aSqjdCmhct3etS2SBZO7OCT3K4dJDjOU-vFjgxELP5xnn89nG-haXG9aAtz34jT7OuJCmDUPH6MR9Go9zHFKLUvaR64HjVRL3eFKCraThJZP9Z9jTSGjX6?purpose=fullsize)
Pepe (PEPE)
Market overview · 1 November 2026
PEPE is a high-risk meme coin whose price is strongly influenced by market sentiment, trading volume, social media trends, and Bitcoin's direction.
### Technical outlook
* Trend: Recent daily technical indicators suggest a bullish short-term trend, while the overall signal remains mixed. CoinLore
* Momentum: The daily RSI is around 61, suggesting positive momentum, but the market could experience a pullback.
* Key levels: Recent technical analysis identifies support near $0.0000048 and $0.0000046, with resistance around $0.0000051–$0.0000052. These levels can change quickly. CoinLore
* Main risk: PEPE has no traditional cash-flow valuation, and sharp price swings can cause substantial losses.
My view: PEPE's short-term setup looks cautiously bullish, but confirmation above resistance and sustained trading volume would strengthen the case. A break below support would weaken it. This is a speculative trade, not a reliable long-term investment.
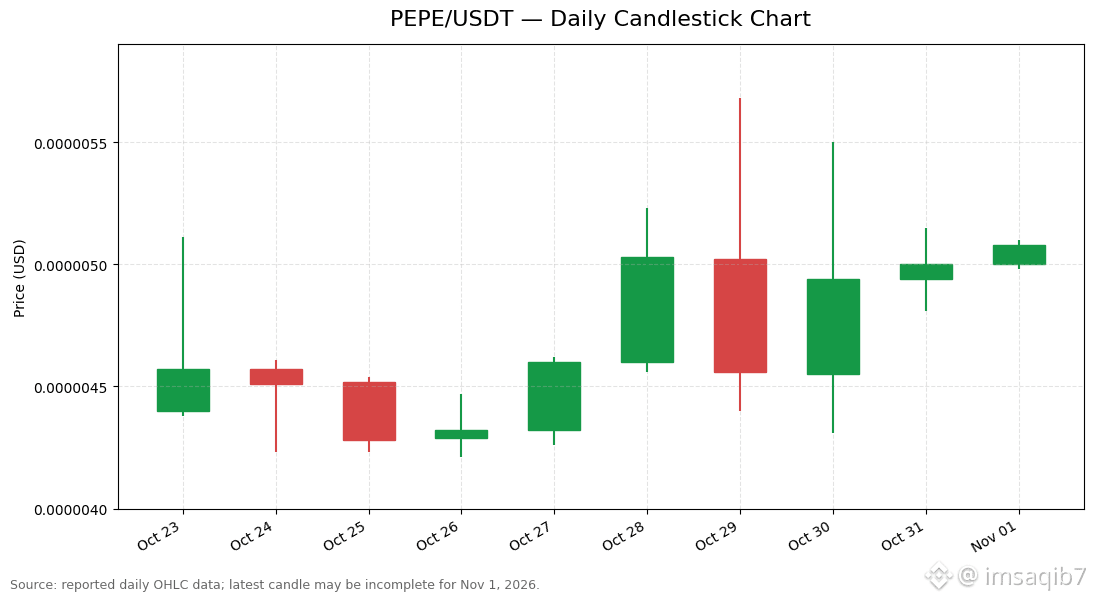
### PEPE daily candlestick chart
Daily candles · 23 October–1 November 2026 · USD
View or download the PEPE candlestick chart
Source: reported historical OHLC data. The 1 November candle may be incomplete. Market Capitalize +1
How to read it
* Green candle: closing price was higher than opening price.
* Red candle: closing price was lower than opening price.
* Wicks show the day's high and low.
* Recent candles show recovery toward $0.0000051, but a sustained breakout is not yet confirmed.
For live prices and an interactive chart, see [PEPE on CoinGecko](https://www.coingecko.com/en/coins/pepe?utm_source=chatgpt.com).
This is educational market analysis, not financial advice.
#PEPE_EXPERT $PEPE
{spot}(PEPEUSDT)
#pepe⚡ PEPE to USD live price, market cap, and chart](https://images.openai.com/static-rsc-4/u9RiKk3AX44AcnxvrQ5RZAFnWF35Qj4sH5KiUoQc2kwqq_ikFcSZw22RgXqhoVNeAw4u-BWQo2aSqjdCmhct3etS2SBZO7OCT3K4dJDjOU-vFjgxELP5xnn89nG-haXG9aAtz34jT7OuJCmDUPH6MR9Go9zHFKLUvaR64HjVRL3eFKCraThJZP9Z9jTSGjX6?purpose=fullsize)
Pepe (PEPE)
Market overview · 1 November 2026
PEPE is a high-risk meme coin whose price is strongly influenced by market sentiment, trading volume, social media trends, and Bitcoin's direction.
### Technical outlook
* Trend: Recent daily technical indicators suggest a bullish short-term trend, while the overall signal remains mixed. CoinLore
* Momentum: The daily RSI is around 61, suggesting positive momentum, but the market could experience a pullback.
* Key levels: Recent technical analysis identifies support near $0.0000048 and $0.0000046, with resistance around $0.0000051–$0.0000052. These levels can change quickly. CoinLore
* Main risk: PEPE has no traditional cash-flow valuation, and sharp price swings can cause substantial losses.
My view: PEPE's short-term setup looks cautiously bullish, but confirmation above resistance and sustained trading volume would strengthen the case. A break below support would weaken it. This is a speculative trade, not a reliable long-term investment.
### PEPE daily candlestick chart
Daily candles · 23 October–1 November 2026 · USD
View or download the PEPE candlestick chart
Source: reported historical OHLC data. The 1 November candle may be incomplete. Market Capitalize +1
How to read it
* Green candle: closing price was higher than opening price.
* Red candle: closing price was lower than opening price.
* Wicks show the day's high and low.
* Recent candles show recovery toward $0.0000051, but a sustained breakout is not yet confirmed.
For live prices and an interactive chart, see [PEPE on CoinGecko](https://www.coingecko.com/en/coins/pepe?utm_source=chatgpt.com).
This is educational market analysis, not financial advice.
#PEPE_EXPERT $PEPE
Pepe (PEPE)
Market overview · 1 November 2026
PEPE is a high-risk meme coin whose price is strongly influenced by market sentiment, trading volume, social media trends, and Bitcoin's direction.
### Technical outlook
* Trend: Recent daily technical indicators suggest a bullish short-term trend, while the overall signal remains mixed. CoinLore
* Momentum: The daily RSI is around 61, suggesting positive momentum, but the market could experience a pullback.
* Key levels: Recent technical analysis identifies support near $0.0000048 and $0.0000046, with resistance around $0.0000051–$0.0000052. These levels can change quickly. CoinLore
* Main risk: PEPE has no traditional cash-flow valuation, and sharp price swings can cause substantial losses.
My view: PEPE's short-term setup looks cautiously bullish, but confirmation above resistance and sustained trading volume would strengthen the case. A break below support would weaken it. This is a speculative trade, not a reliable long-term investment.
### PEPE daily candlestick chart
Daily candles · 23 October–1 November 2026 · USD
View or download the PEPE candlestick chart
Source: reported historical OHLC data. The 1 November candle may be incomplete. Market Capitalize +1
How to read it
* Green candle: closing price was higher than opening price.
* Red candle: closing price was lower than opening price.
* Wicks show the day's high and low.
* Recent candles show recovery toward $0.0000051, but a sustained breakout is not yet confirmed.
For live prices and an interactive chart, see [PEPE on CoinGecko](https://www.coingecko.com/en/coins/pepe?utm_source=chatgpt.com).
This is educational market analysis, not financial advice.
#PEPE_EXPERT $PEPE
147

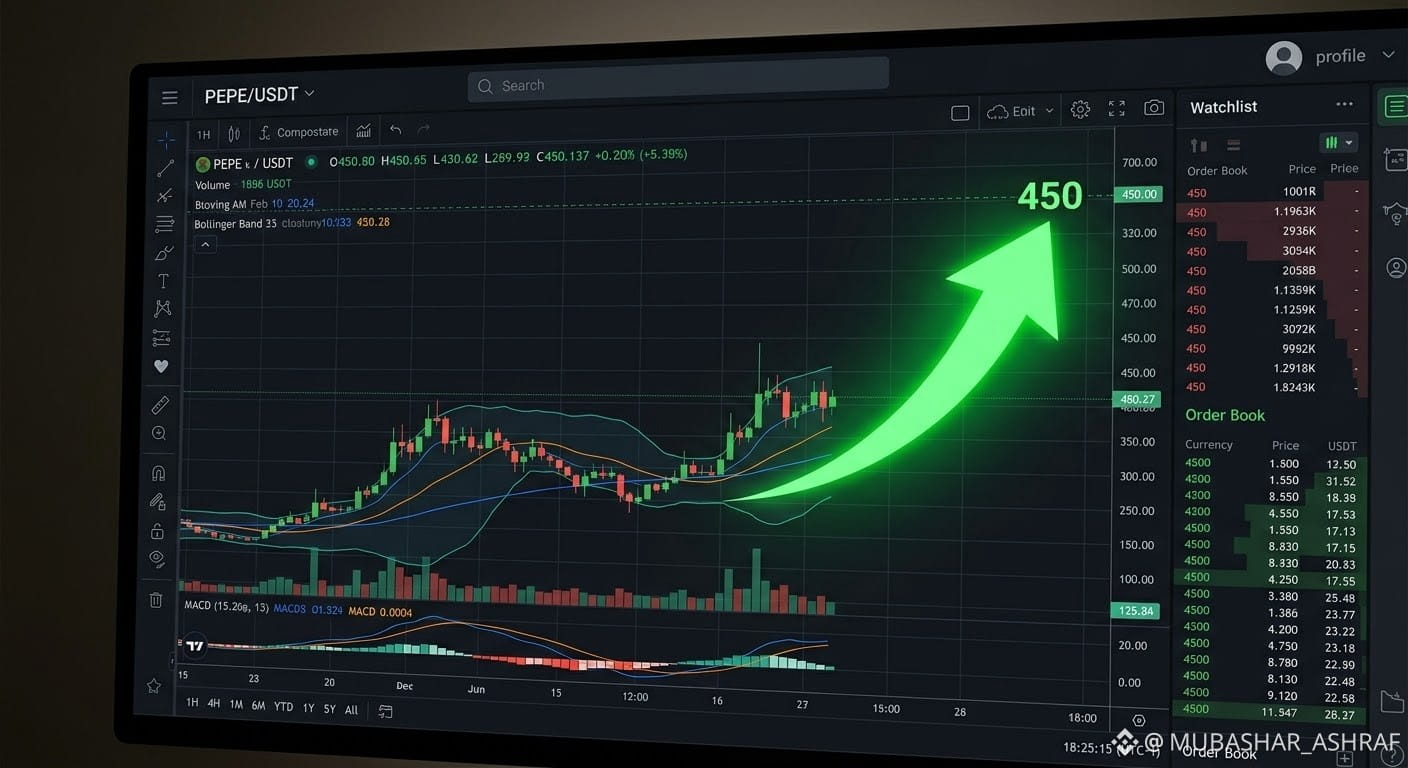
🚀 $PEPE Next Stop: 450+ Target! 📈
PEPE currently holding strong around 400. With the current bullish momentum, we are aiming for 450+ next!
Market ups and downs are normal, but patience pays off. Holding $200 strong! 💪🔥
Are you holding or trading $PEPE? Drop your targets below! 👇
#PEPE_EXPERT #crypto #BinanceSquareFamily #cryptosignals #Memecoins🤑🤑
🚀 $PEPE Next Stop: 450+ Target! 📈
PEPE currently holding strong around 400. With the current bullish momentum, we are aiming for 450+ next!
Market ups and downs are normal, but patience pays off. Holding $200 strong! 💪🔥
Are you holding or trading $PEPE? Drop your targets below! 👇
#PEPE_EXPERT #crypto #BinanceSquareFamily #cryptosignals #Memecoins🤑🤑
PEPE currently holding strong around 400. With the current bullish momentum, we are aiming for 450+ next!
Market ups and downs are normal, but patience pays off. Holding $200 strong! 💪🔥
Are you holding or trading $PEPE? Drop your targets below! 👇
#PEPE_EXPERT #crypto #BinanceSquareFamily #cryptosignals #Memecoins🤑🤑
1
498

·
--
Bullish
Verified
Here is the latest news and market overview for Pepe ($PEPE):
🐸 Pepe ($PEPE) Market Overview & Latest News
Pepe ($PEPE) remains one of the top meme-based cryptocurrencies by market capitalization, following in the footsteps of Shiba Inu and Dogecoin.
📊 Market & Price Snapshot
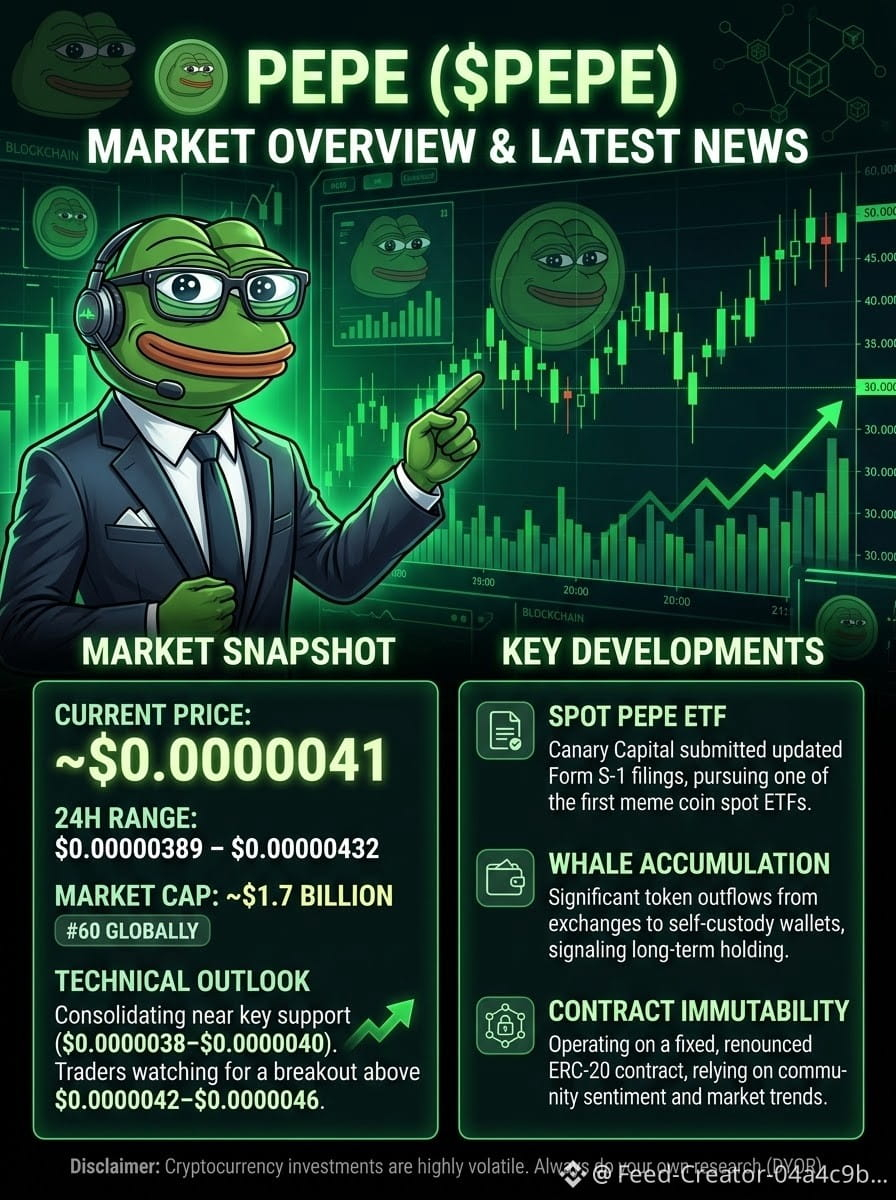
Current Price: Floating around $0.0000041.
24-Hour Range: $0.00000389 – $0.00000432.
Market Rank & Cap: Ranked around #60 globally with a market capitalization near $1.7 Billion.
Technical Outlook: PEPE is currently consolidating around key support levels ($0.0000038–$0.0000040) following earlier market-wide pullbacks. Traders are watching for a potential breakout above the $0.0000042–$0.0000046 resistance zone to confirm a sustained bullish momentum.
📰 Key Developments & Headlines
Spot PEPE ETF Progress
Canary Capital submitted updated filings (Form S-1) for a proposed Spot PEPE ETF. If approved by the SEC, this would mark one of the first spot meme coin ETFs, potentially opening doors for institutional investment and mainstream liquidity.
Whale Accumulation & Exchange Outflows
On-chain analytics show significant net outflows of PEPE tokens from centralized exchanges to self-custody wallets. Large non-exchange wallets have steadily increased their holdings, signaling long-term accumulation by major holders.
Contract Immutability
Unlike utility-focused altcoins that deploy frequent contract updates, PEPE operates on a fixed, renounced ERC-20 smart contract. Its price momentum relies entirely on community sentiment, exchange liquidity, and broader crypto market trends (particularly Bitcoin’s price movement).
Disclaimer: Cryptocurrency investments are highly volatile. Always do your own research (DYOR) before making financial decisions.
#BitcoinOptionsVolatilityHitsFiveYearLow
#pepe⚡ #PEPE市值超越LTC #PEPE_EXPERT $1000PEPE
Here is the latest news and market overview for Pepe ($PEPE):
🐸 Pepe ($PEPE) Market Overview & Latest News
Pepe ($PEPE) remains one of the top meme-based cryptocurrencies by market capitalization, following in the footsteps of Shiba Inu and Dogecoin.
📊 Market & Price Snapshot
Current Price: Floating around $0.0000041.
24-Hour Range: $0.00000389 – $0.00000432.
Market Rank & Cap: Ranked around #60 globally with a market capitalization near $1.7 Billion.
Technical Outlook: PEPE is currently consolidating around key support levels ($0.0000038–$0.0000040) following earlier market-wide pullbacks. Traders are watching for a potential breakout above the $0.0000042–$0.0000046 resistance zone to confirm a sustained bullish momentum.
📰 Key Developments & Headlines
Spot PEPE ETF Progress
Canary Capital submitted updated filings (Form S-1) for a proposed Spot PEPE ETF. If approved by the SEC, this would mark one of the first spot meme coin ETFs, potentially opening doors for institutional investment and mainstream liquidity.
Whale Accumulation & Exchange Outflows
On-chain analytics show significant net outflows of PEPE tokens from centralized exchanges to self-custody wallets. Large non-exchange wallets have steadily increased their holdings, signaling long-term accumulation by major holders.
Contract Immutability
Unlike utility-focused altcoins that deploy frequent contract updates, PEPE operates on a fixed, renounced ERC-20 smart contract. Its price momentum relies entirely on community sentiment, exchange liquidity, and broader crypto market trends (particularly Bitcoin’s price movement).
Disclaimer: Cryptocurrency investments are highly volatile. Always do your own research (DYOR) before making financial decisions.
#BitcoinOptionsVolatilityHitsFiveYearLow
#pepe⚡ #PEPE市值超越LTC #PEPE_EXPERT $1000PEPE
🐸 Pepe ($PEPE) Market Overview & Latest News
Pepe ($PEPE) remains one of the top meme-based cryptocurrencies by market capitalization, following in the footsteps of Shiba Inu and Dogecoin.
📊 Market & Price Snapshot
Current Price: Floating around $0.0000041.
24-Hour Range: $0.00000389 – $0.00000432.
Market Rank & Cap: Ranked around #60 globally with a market capitalization near $1.7 Billion.
Technical Outlook: PEPE is currently consolidating around key support levels ($0.0000038–$0.0000040) following earlier market-wide pullbacks. Traders are watching for a potential breakout above the $0.0000042–$0.0000046 resistance zone to confirm a sustained bullish momentum.
📰 Key Developments & Headlines
Spot PEPE ETF Progress
Canary Capital submitted updated filings (Form S-1) for a proposed Spot PEPE ETF. If approved by the SEC, this would mark one of the first spot meme coin ETFs, potentially opening doors for institutional investment and mainstream liquidity.
Whale Accumulation & Exchange Outflows
On-chain analytics show significant net outflows of PEPE tokens from centralized exchanges to self-custody wallets. Large non-exchange wallets have steadily increased their holdings, signaling long-term accumulation by major holders.
Contract Immutability
Unlike utility-focused altcoins that deploy frequent contract updates, PEPE operates on a fixed, renounced ERC-20 smart contract. Its price momentum relies entirely on community sentiment, exchange liquidity, and broader crypto market trends (particularly Bitcoin’s price movement).
Disclaimer: Cryptocurrency investments are highly volatile. Always do your own research (DYOR) before making financial decisions.
#BitcoinOptionsVolatilityHitsFiveYearLow
#pepe⚡ #PEPE市值超越LTC #PEPE_EXPERT $1000PEPE
6
987

Market Snapshot $PEPE
Current Price: ~$0.00000286
Market Capitalization: ~$1.20 Billion (Ranking #59 among all cryptocurrencies)
24-Hour Trading Volume: ~$101.89 Million
Circulating Supply: 420.69 Trillion $PEPE
Technical Analysis & Key Price Levels
PEPE is currently experiencing a period of tightening volatility, with traders waiting for a decisive move in either direction.
Chart Patterns: $PEPE is currently trading near the apex of an ascending triangle on the daily chart and a symmetrical triangle on the four-hour chart. This tightening momentum typically precedes a breakout or breakdown.
Key Resistance ($0.00000300 - $0.00000310): The price has been oscillating within a tight range. A decisive, high-volume breakout above the $0.000003 level is required to shift the momentum into a bullish trend.
Key Support ($0.00000260 - $0.00000280): The token is holding firmly above its critical support zones. If broader market conditions worsen, the next major historical support sits lower at $0.00000223.
Momentum Indicators: The 14-day Relative Strength Index (RSI) is sitting around 36.9, which suggests the asset is leaning toward the "oversold" territory, reflecting recent bearish pressure and a lack of immediate buying demand.#PEPE创历史新高
#PEPE_EXPERT #ADPJobsSurge
#PrivacyCoinSurge
{spot}(PEPEUSDT)
Market Snapshot $PEPE
Current Price: ~$0.00000286
Market Capitalization: ~$1.20 Billion (Ranking #59 among all cryptocurrencies)
24-Hour Trading Volume: ~$101.89 Million
Circulating Supply: 420.69 Trillion $PEPE
Technical Analysis & Key Price Levels
PEPE is currently experiencing a period of tightening volatility, with traders waiting for a decisive move in either direction.
Chart Patterns: $PEPE is currently trading near the apex of an ascending triangle on the daily chart and a symmetrical triangle on the four-hour chart. This tightening momentum typically precedes a breakout or breakdown.
Key Resistance ($0.00000300 - $0.00000310): The price has been oscillating within a tight range. A decisive, high-volume breakout above the $0.000003 level is required to shift the momentum into a bullish trend.
Key Support ($0.00000260 - $0.00000280): The token is holding firmly above its critical support zones. If broader market conditions worsen, the next major historical support sits lower at $0.00000223.
Momentum Indicators: The 14-day Relative Strength Index (RSI) is sitting around 36.9, which suggests the asset is leaning toward the "oversold" territory, reflecting recent bearish pressure and a lack of immediate buying demand.#PEPE创历史新高
#PEPE_EXPERT #ADPJobsSurge
#PrivacyCoinSurge
Current Price: ~$0.00000286
Market Capitalization: ~$1.20 Billion (Ranking #59 among all cryptocurrencies)
24-Hour Trading Volume: ~$101.89 Million
Circulating Supply: 420.69 Trillion $PEPE
Technical Analysis & Key Price Levels
PEPE is currently experiencing a period of tightening volatility, with traders waiting for a decisive move in either direction.
Chart Patterns: $PEPE is currently trading near the apex of an ascending triangle on the daily chart and a symmetrical triangle on the four-hour chart. This tightening momentum typically precedes a breakout or breakdown.
Key Resistance ($0.00000300 - $0.00000310): The price has been oscillating within a tight range. A decisive, high-volume breakout above the $0.000003 level is required to shift the momentum into a bullish trend.
Key Support ($0.00000260 - $0.00000280): The token is holding firmly above its critical support zones. If broader market conditions worsen, the next major historical support sits lower at $0.00000223.
Momentum Indicators: The 14-day Relative Strength Index (RSI) is sitting around 36.9, which suggests the asset is leaning toward the "oversold" territory, reflecting recent bearish pressure and a lack of immediate buying demand.#PEPE创历史新高
#PEPE_EXPERT #ADPJobsSurge
#PrivacyCoinSurge

143
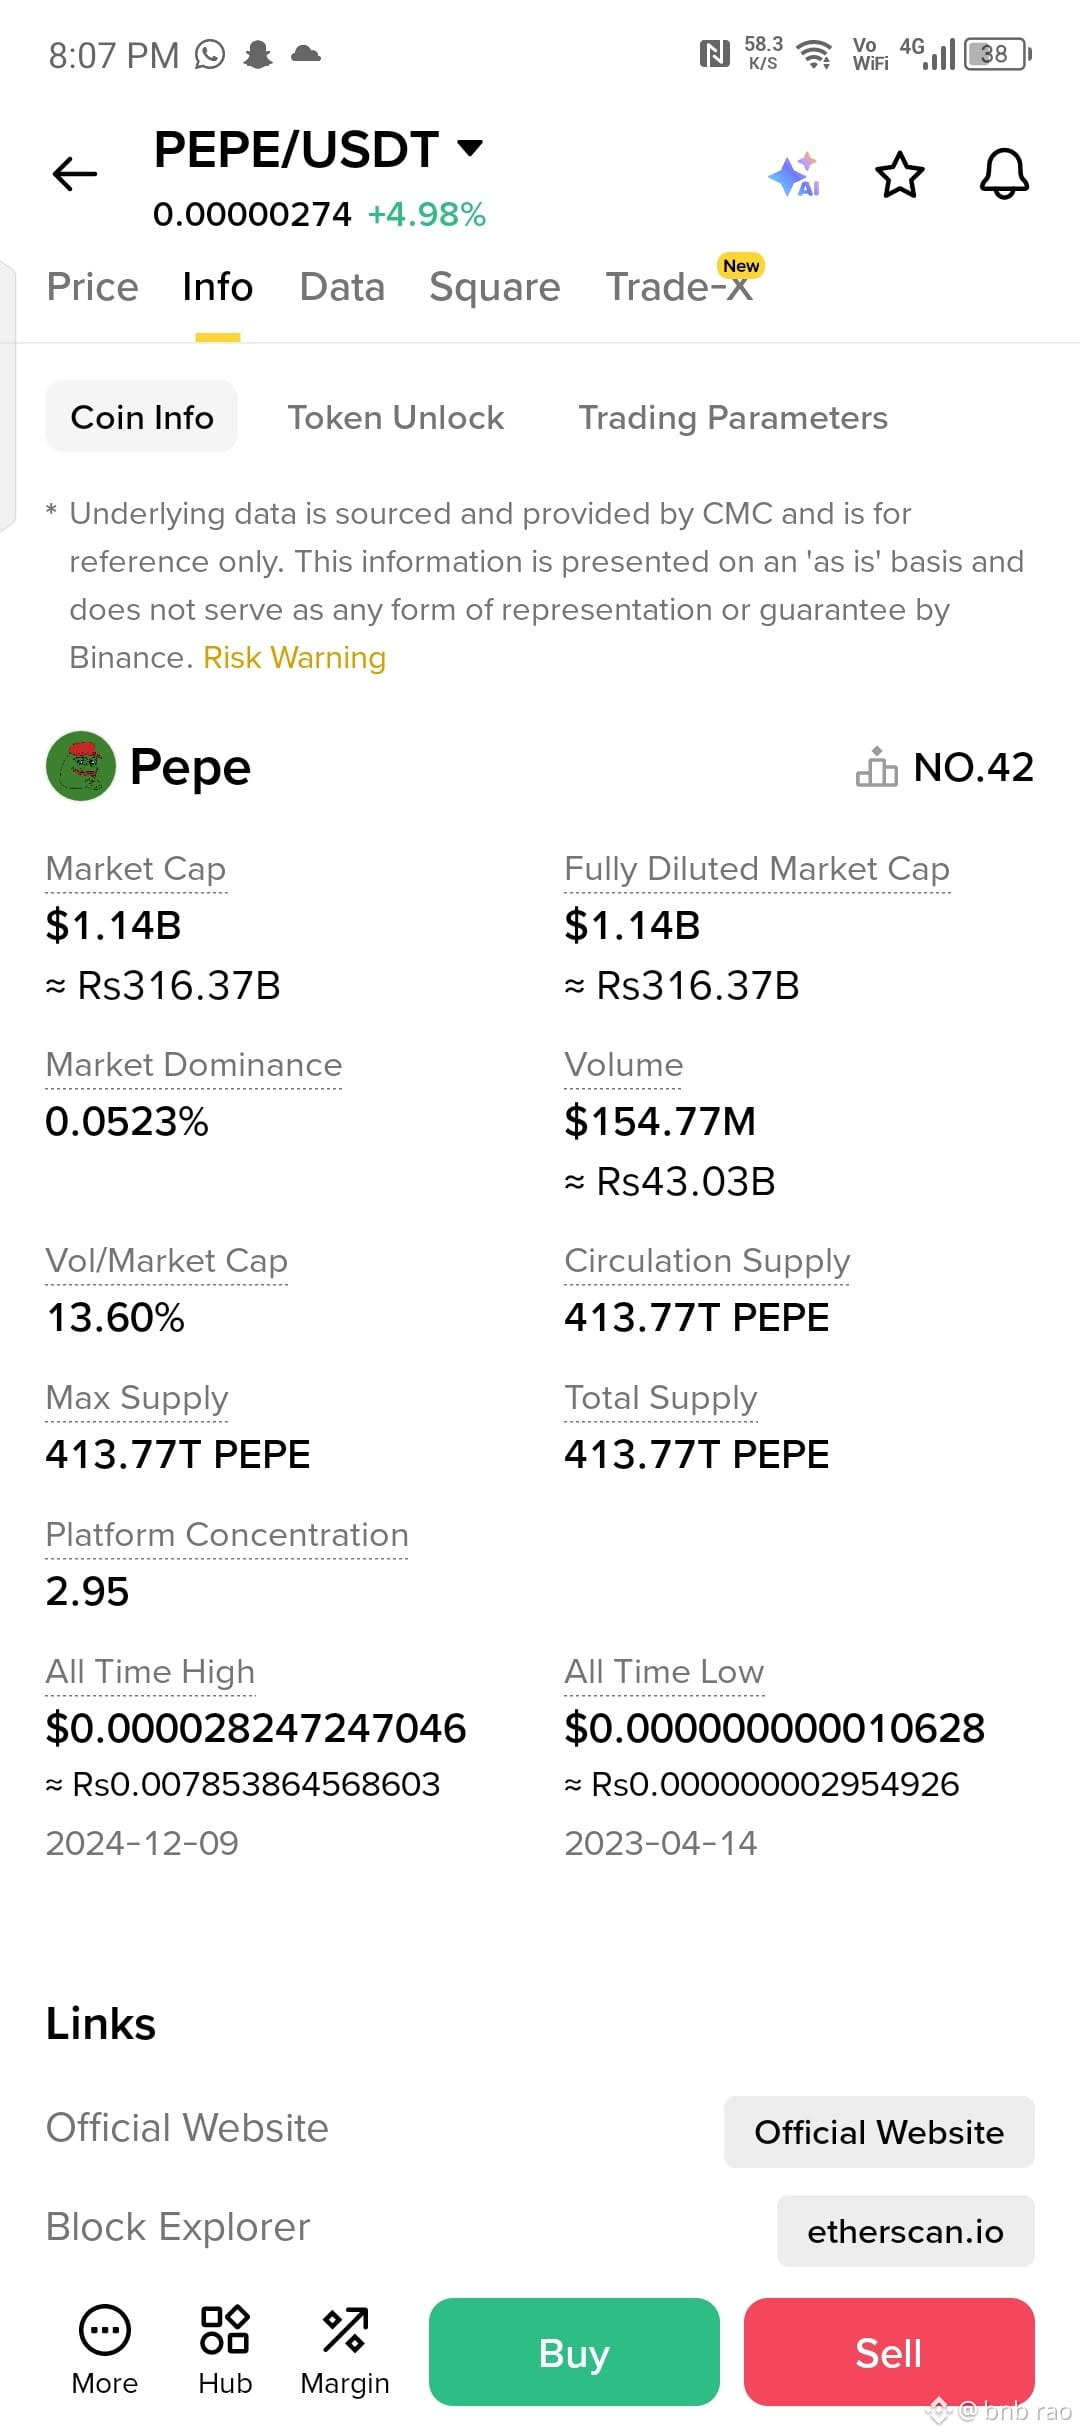
The mainstream analysts are completely wrong about $PEPE and a massive squeeze is unfolding.
{spot}(PEPEUSDT)
I am aggressively building up my position right here at 0.00000274 because the underlying metrics are flashing an insane supply absorption. Look at the data across the board: PEPE’s market cap has consolidated securely at $1.14B, with a massive 24-hour trading volume of $154.77M pouring into the asset. This has fueled a sharp +4.98% daily surge, completely outperforming the broader market. With market dominance at 0.0523% and the total supply capped flat with circulating supply at 413.77T PEPE, there is no dilution risk here. I’m scaling in heavily before this massive volume forces a sudden, vertical price adjustment that catches everyone off guard.#PEPE_EXPERT
The mainstream analysts are completely wrong about $PEPE and a massive squeeze is unfolding.
I am aggressively building up my position right here at 0.00000274 because the underlying metrics are flashing an insane supply absorption. Look at the data across the board: PEPE’s market cap has consolidated securely at $1.14B, with a massive 24-hour trading volume of $154.77M pouring into the asset. This has fueled a sharp +4.98% daily surge, completely outperforming the broader market. With market dominance at 0.0523% and the total supply capped flat with circulating supply at 413.77T PEPE, there is no dilution risk here. I’m scaling in heavily before this massive volume forces a sudden, vertical price adjustment that catches everyone off guard.#PEPE_EXPERT
I am aggressively building up my position right here at 0.00000274 because the underlying metrics are flashing an insane supply absorption. Look at the data across the board: PEPE’s market cap has consolidated securely at $1.14B, with a massive 24-hour trading volume of $154.77M pouring into the asset. This has fueled a sharp +4.98% daily surge, completely outperforming the broader market. With market dominance at 0.0523% and the total supply capped flat with circulating supply at 413.77T PEPE, there is no dilution risk here. I’m scaling in heavily before this massive volume forces a sudden, vertical price adjustment that catches everyone off guard.#PEPE_EXPERT
121

·
--
Pepe Coin (PEPE) de forma activa en la plataforma de Binance Spot.El token cotiza actualmente a un precio promedio de $0.0000032 USD, habiendo experimentado una presión a la baja del -3.37% en las últimas 24 horas dentro de un mercado cripto con movimientos mixtos.
Hoy, 03 de junio de 2026, puedes operar con Pepe Coin (PEPE) de forma activa en la plataforma de Binance Spot.
Ejecutar la operación paso a paso
Si deseas comprar o vender PEPE en este momento, debes realizar la secuencia mecánica estándar en la plataforma:
Paso 1: Inicia sesión en tu cuenta de Binance y dirígete al menú superior. Selecciona "Trade" (Operar) y luego "Spot".Paso 2: Utiliza el cuadro de búsqueda en el panel derecho e ingresa el par de tu preferencia; el más líquido el día de hoy es PEPE/USDT.
Paso 3: Desplázate hacia el panel inferior de órdenes y selecciona tu estrategia de entrada:Orden de Mercado (Market): Ejecuta la transacción de forma inmediata al precio actual de mercado de ~$0.0000032 USD.Orden Límite (Limit): Define un precio específico (por ejemplo, buscando un soporte en $0.0000031 USD) para que la orden se complete automáticamente si el precio cae a ese nivel.
Paso 4: Introduce la cantidad de USDT que deseas invertir o el monto exacto de PEPE que planeas vender.
Paso 5: Haz clic en el botón verde "Comprar PEPE" o en el botón rojo "Vender PEPE" para finalizar la orden.
Monitorear los indicadores técnicos de hoy.
Antes de abrir una posición en largo (compra) o en corto (venta), los datos en tiempo real de Binance muestran las siguientes condiciones técnicas para PEPE:
Gestionar los riesgos y puntos ciegos de la jornada
Al operar hoy con PEPE, debes tener en cuenta que las meme coins no se mueven por fundamentales corporativos, sino por factores de mercado muy específicos:
Monitoreo de Ballenas: Los movimientos del precio de hoy están altamente correlacionados con las entradas y salidas de capital de carteras masivas (ballenas cripto). Monitorea los flujos entrantes de Binance Square.
Sentimiento de Redes Sociales: Cualquier fluctuación o ruptura de volumen suele estar precedida por tendencias virales en plataformas como X.
Efecto Bitcoin: BTC cotiza hoy a la baja en la zona de los $66,800 USD. Si Bitcoin continúa perdiendo terreno, PEPE podría romper su soporte actual hacia los $0.0000031 USD rápidamente. Usa siempre órdenes Stop-Loss para proteger tu capital de la volatilidad extrema.
$PEPE
{spot}(PEPEUSDT)
{alpha}(CT_195TMacq4TDUw5q8NFBwmbY4RLXvzvG5JTkvi)
#PEPE #pepecoin #PEPE_EXPERT #PEPEPricePredictions.
Sígueme y dale me gusta. Gracias.
Pepe Coin (PEPE) de forma activa en la plataforma de Binance Spot.
El token cotiza actualmente a un precio promedio de $0.0000032 USD, habiendo experimentado una presión a la baja del -3.37% en las últimas 24 horas dentro de un mercado cripto con movimientos mixtos.
Hoy, 03 de junio de 2026, puedes operar con Pepe Coin (PEPE) de forma activa en la plataforma de Binance Spot.
Ejecutar la operación paso a paso
Si deseas comprar o vender PEPE en este momento, debes realizar la secuencia mecánica estándar en la plataforma:
Paso 1: Inicia sesión en tu cuenta de Binance y dirígete al menú superior. Selecciona "Trade" (Operar) y luego "Spot".Paso 2: Utiliza el cuadro de búsqueda en el panel derecho e ingresa el par de tu preferencia; el más líquido el día de hoy es PEPE/USDT.
Paso 3: Desplázate hacia el panel inferior de órdenes y selecciona tu estrategia de entrada:Orden de Mercado (Market): Ejecuta la transacción de forma inmediata al precio actual de mercado de ~$0.0000032 USD.Orden Límite (Limit): Define un precio específico (por ejemplo, buscando un soporte en $0.0000031 USD) para que la orden se complete automáticamente si el precio cae a ese nivel.
Paso 4: Introduce la cantidad de USDT que deseas invertir o el monto exacto de PEPE que planeas vender.
Paso 5: Haz clic en el botón verde "Comprar PEPE" o en el botón rojo "Vender PEPE" para finalizar la orden.
Monitorear los indicadores técnicos de hoy.
Antes de abrir una posición en largo (compra) o en corto (venta), los datos en tiempo real de Binance muestran las siguientes condiciones técnicas para PEPE:
Gestionar los riesgos y puntos ciegos de la jornada
Al operar hoy con PEPE, debes tener en cuenta que las meme coins no se mueven por fundamentales corporativos, sino por factores de mercado muy específicos:
Monitoreo de Ballenas: Los movimientos del precio de hoy están altamente correlacionados con las entradas y salidas de capital de carteras masivas (ballenas cripto). Monitorea los flujos entrantes de Binance Square.
Sentimiento de Redes Sociales: Cualquier fluctuación o ruptura de volumen suele estar precedida por tendencias virales en plataformas como X.
Efecto Bitcoin: BTC cotiza hoy a la baja en la zona de los $66,800 USD. Si Bitcoin continúa perdiendo terreno, PEPE podría romper su soporte actual hacia los $0.0000031 USD rápidamente. Usa siempre órdenes Stop-Loss para proteger tu capital de la volatilidad extrema.
$PEPE
#PEPE #pepecoin #PEPE_EXPERT #PEPEPricePredictions.
Sígueme y dale me gusta. Gracias.
Hoy, 03 de junio de 2026, puedes operar con Pepe Coin (PEPE) de forma activa en la plataforma de Binance Spot.
Ejecutar la operación paso a paso
Si deseas comprar o vender PEPE en este momento, debes realizar la secuencia mecánica estándar en la plataforma:
Paso 1: Inicia sesión en tu cuenta de Binance y dirígete al menú superior. Selecciona "Trade" (Operar) y luego "Spot".Paso 2: Utiliza el cuadro de búsqueda en el panel derecho e ingresa el par de tu preferencia; el más líquido el día de hoy es PEPE/USDT.
Paso 3: Desplázate hacia el panel inferior de órdenes y selecciona tu estrategia de entrada:Orden de Mercado (Market): Ejecuta la transacción de forma inmediata al precio actual de mercado de ~$0.0000032 USD.Orden Límite (Limit): Define un precio específico (por ejemplo, buscando un soporte en $0.0000031 USD) para que la orden se complete automáticamente si el precio cae a ese nivel.
Paso 4: Introduce la cantidad de USDT que deseas invertir o el monto exacto de PEPE que planeas vender.
Paso 5: Haz clic en el botón verde "Comprar PEPE" o en el botón rojo "Vender PEPE" para finalizar la orden.
Monitorear los indicadores técnicos de hoy.
Antes de abrir una posición en largo (compra) o en corto (venta), los datos en tiempo real de Binance muestran las siguientes condiciones técnicas para PEPE:
Gestionar los riesgos y puntos ciegos de la jornada
Al operar hoy con PEPE, debes tener en cuenta que las meme coins no se mueven por fundamentales corporativos, sino por factores de mercado muy específicos:
Monitoreo de Ballenas: Los movimientos del precio de hoy están altamente correlacionados con las entradas y salidas de capital de carteras masivas (ballenas cripto). Monitorea los flujos entrantes de Binance Square.
Sentimiento de Redes Sociales: Cualquier fluctuación o ruptura de volumen suele estar precedida por tendencias virales en plataformas como X.
Efecto Bitcoin: BTC cotiza hoy a la baja en la zona de los $66,800 USD. Si Bitcoin continúa perdiendo terreno, PEPE podría romper su soporte actual hacia los $0.0000031 USD rápidamente. Usa siempre órdenes Stop-Loss para proteger tu capital de la volatilidad extrema.
$PEPE
#PEPE #pepecoin #PEPE_EXPERT #PEPEPricePredictions.
Sígueme y dale me gusta. Gracias.
1
1
488

·
--
🐸 $PEPE WHALE ACTIVITY ALERT — MARKET WATCHERS GETTING CAUTIOUS 📉
$PEPE
{spot}(PEPEUSDT)
Recent on-chain movement shows a well-known large $PEPE holder sending big amounts of tokens to Bitget exchange after staying inactive for weeks. First transfer was around 532.3B PEPE (/$1.96M), followed quickly by another 79.8B PEPE (/$293K). Such repeated exchange deposits often signal possible selling pressure, which makes traders more alert in short-term price action.
In the past, this wallet held nearly 13.1T PEPE with strong profits when the market was trending up. But now the situation looks weaker, as current price structure is under pressure and overall sentiment is cooling. If selling continues, market may stay volatile and move sharply in both directions.
📌 Key Support Zones:
• Strong support: $0.00000810
• Major demand zone: $0.00000740
📌 Resistance Levels:
• Immediate resistance: $0.00000920
• Breakout level: $0.00001050
📈 Entry Strategy:
Best safer entry is near support zones with confirmation candles. Aggressive traders can wait for breakout above resistance with strong volume before entering long positions.
🛑 Stop Loss:
Below $0.00000700 for safe risk control.
🎯 Short-Term Targets:
$0.00000920 → $0.00001050
🚀 Long-Term Outlook:
If market stabilizes and buying pressure returns, PEPE can recover momentum, but traders should stay careful as whale selling can create sudden volatility.
⚡ Trading Insight:
This is a liquidity-driven market right now. Whale transfers do not always mean crash, but they often increase fear and volatility. Smart traders wait for confirmation instead of reacting emotionally.
#pepe⚡ #PEPEATH #pepepumping #PEPE_EXPERT #write2earn🌐💹
🐸 $PEPE WHALE ACTIVITY ALERT — MARKET WATCHERS GETTING CAUTIOUS 📉
$PEPE
Recent on-chain movement shows a well-known large $PEPE holder sending big amounts of tokens to Bitget exchange after staying inactive for weeks. First transfer was around 532.3B PEPE (/$1.96M), followed quickly by another 79.8B PEPE (/$293K). Such repeated exchange deposits often signal possible selling pressure, which makes traders more alert in short-term price action.
In the past, this wallet held nearly 13.1T PEPE with strong profits when the market was trending up. But now the situation looks weaker, as current price structure is under pressure and overall sentiment is cooling. If selling continues, market may stay volatile and move sharply in both directions.
📌 Key Support Zones:
• Strong support: $0.00000810
• Major demand zone: $0.00000740
📌 Resistance Levels:
• Immediate resistance: $0.00000920
• Breakout level: $0.00001050
📈 Entry Strategy:
Best safer entry is near support zones with confirmation candles. Aggressive traders can wait for breakout above resistance with strong volume before entering long positions.
🛑 Stop Loss:
Below $0.00000700 for safe risk control.
🎯 Short-Term Targets:
$0.00000920 → $0.00001050
🚀 Long-Term Outlook:
If market stabilizes and buying pressure returns, PEPE can recover momentum, but traders should stay careful as whale selling can create sudden volatility.
⚡ Trading Insight:
This is a liquidity-driven market right now. Whale transfers do not always mean crash, but they often increase fear and volatility. Smart traders wait for confirmation instead of reacting emotionally.
#pepe⚡ #PEPEATH #pepepumping #PEPE_EXPERT #write2earn🌐💹
$PEPE
Recent on-chain movement shows a well-known large $PEPE holder sending big amounts of tokens to Bitget exchange after staying inactive for weeks. First transfer was around 532.3B PEPE (/$1.96M), followed quickly by another 79.8B PEPE (/$293K). Such repeated exchange deposits often signal possible selling pressure, which makes traders more alert in short-term price action.
In the past, this wallet held nearly 13.1T PEPE with strong profits when the market was trending up. But now the situation looks weaker, as current price structure is under pressure and overall sentiment is cooling. If selling continues, market may stay volatile and move sharply in both directions.
📌 Key Support Zones:
• Strong support: $0.00000810
• Major demand zone: $0.00000740
📌 Resistance Levels:
• Immediate resistance: $0.00000920
• Breakout level: $0.00001050
📈 Entry Strategy:
Best safer entry is near support zones with confirmation candles. Aggressive traders can wait for breakout above resistance with strong volume before entering long positions.
🛑 Stop Loss:
Below $0.00000700 for safe risk control.
🎯 Short-Term Targets:
$0.00000920 → $0.00001050
🚀 Long-Term Outlook:
If market stabilizes and buying pressure returns, PEPE can recover momentum, but traders should stay careful as whale selling can create sudden volatility.
⚡ Trading Insight:
This is a liquidity-driven market right now. Whale transfers do not always mean crash, but they often increase fear and volatility. Smart traders wait for confirmation instead of reacting emotionally.
#pepe⚡ #PEPEATH #pepepumping #PEPE_EXPERT #write2earn🌐💹
1
1
499

$PEPE Technical Analysis
{spot}(PEPEUSDT)
PEPE/USDT continues to attract strong speculative interest, maintaining a bullish market structure despite periods of elevated volatility. The pair is currently trading above key short-term support levels, indicating that buyers remain in control of the broader trend. Recent price action shows consolidation near resistance, often a sign of accumulation before the next directional move.
Technical indicators suggest mixed but constructive momentum. The Relative Strength Index (RSI) remains in a neutral-to-bullish zone, leaving room for further upside without signaling extreme overbought conditions. Meanwhile, moving averages continue to support the bullish outlook, with price holding above major trend-defining levels. Trading volume has also remained healthy, reflecting sustained market participation.
On the upside, a decisive breakout above the immediate resistance zone could trigger renewed buying pressure and open the door to higher targets. Conversely, failure to maintain current support may lead to a corrective pullback toward lower demand areas before buyers attempt another advance.
Overall, PEPE/USDT maintains a cautiously bullish bias. Traders should monitor volume confirmation and key support-resistance levels closely, as meme coins are highly sensitive to market sentiment and can experience sharp price swings. Risk management remains essential in the current market environment.#PEPE #pepepumping #PEPE_EXPERT
$PEPE Technical Analysis
PEPE/USDT continues to attract strong speculative interest, maintaining a bullish market structure despite periods of elevated volatility. The pair is currently trading above key short-term support levels, indicating that buyers remain in control of the broader trend. Recent price action shows consolidation near resistance, often a sign of accumulation before the next directional move.
Technical indicators suggest mixed but constructive momentum. The Relative Strength Index (RSI) remains in a neutral-to-bullish zone, leaving room for further upside without signaling extreme overbought conditions. Meanwhile, moving averages continue to support the bullish outlook, with price holding above major trend-defining levels. Trading volume has also remained healthy, reflecting sustained market participation.
On the upside, a decisive breakout above the immediate resistance zone could trigger renewed buying pressure and open the door to higher targets. Conversely, failure to maintain current support may lead to a corrective pullback toward lower demand areas before buyers attempt another advance.
Overall, PEPE/USDT maintains a cautiously bullish bias. Traders should monitor volume confirmation and key support-resistance levels closely, as meme coins are highly sensitive to market sentiment and can experience sharp price swings. Risk management remains essential in the current market environment.#PEPE #pepepumping #PEPE_EXPERT
PEPE/USDT continues to attract strong speculative interest, maintaining a bullish market structure despite periods of elevated volatility. The pair is currently trading above key short-term support levels, indicating that buyers remain in control of the broader trend. Recent price action shows consolidation near resistance, often a sign of accumulation before the next directional move.
Technical indicators suggest mixed but constructive momentum. The Relative Strength Index (RSI) remains in a neutral-to-bullish zone, leaving room for further upside without signaling extreme overbought conditions. Meanwhile, moving averages continue to support the bullish outlook, with price holding above major trend-defining levels. Trading volume has also remained healthy, reflecting sustained market participation.
On the upside, a decisive breakout above the immediate resistance zone could trigger renewed buying pressure and open the door to higher targets. Conversely, failure to maintain current support may lead to a corrective pullback toward lower demand areas before buyers attempt another advance.
Overall, PEPE/USDT maintains a cautiously bullish bias. Traders should monitor volume confirmation and key support-resistance levels closely, as meme coins are highly sensitive to market sentiment and can experience sharp price swings. Risk management remains essential in the current market environment.#PEPE #pepepumping #PEPE_EXPERT
204

·
--
#pepe⚡
Terminamos el día con una señal que muchos estaban esperando: después de varias horas de presión vendedora, PEPE ha mostrado una recuperación interesante y vuelve a demostrar que sigue teniendo compradores defendiendo niveles clave. 🐸📈 Lo que más me llama la atención no es solo el rebote, sino que continúa moviendo más de 200 millones de dólares en volumen diario, algo que muy pocas meme coins pueden presumir. Cuando una moneda mantiene tanta actividad incluso lejos de sus máximos históricos, significa que el mercado todavía la está observando de cerca. Hoy algunos vendieron por miedo, otros acumularon con paciencia. El tiempo dirá quién tomó la mejor decisión. ¿Ustedes cómo cierran el día: comprando, manteniendo o esperando? 🚀🔥 #PEPE_EXPERT #pepe⚡ #PEPE
{spot}(PEPEUSDT)
#pepe⚡
Terminamos el día con una señal que muchos estaban esperando: después de varias horas de presión vendedora, PEPE ha mostrado una recuperación interesante y vuelve a demostrar que sigue teniendo compradores defendiendo niveles clave. 🐸📈 Lo que más me llama la atención no es solo el rebote, sino que continúa moviendo más de 200 millones de dólares en volumen diario, algo que muy pocas meme coins pueden presumir. Cuando una moneda mantiene tanta actividad incluso lejos de sus máximos históricos, significa que el mercado todavía la está observando de cerca. Hoy algunos vendieron por miedo, otros acumularon con paciencia. El tiempo dirá quién tomó la mejor decisión. ¿Ustedes cómo cierran el día: comprando, manteniendo o esperando? 🚀🔥 #PEPE_EXPERT #pepe⚡ #PEPE
Terminamos el día con una señal que muchos estaban esperando: después de varias horas de presión vendedora, PEPE ha mostrado una recuperación interesante y vuelve a demostrar que sigue teniendo compradores defendiendo niveles clave. 🐸📈 Lo que más me llama la atención no es solo el rebote, sino que continúa moviendo más de 200 millones de dólares en volumen diario, algo que muy pocas meme coins pueden presumir. Cuando una moneda mantiene tanta actividad incluso lejos de sus máximos históricos, significa que el mercado todavía la está observando de cerca. Hoy algunos vendieron por miedo, otros acumularon con paciencia. El tiempo dirá quién tomó la mejor decisión. ¿Ustedes cómo cierran el día: comprando, manteniendo o esperando? 🚀🔥 #PEPE_EXPERT #pepe⚡ #PEPE
2
2.4k
·
--
Bullish
🐸 $PEPE TRADING VIEW REPORT — PROFESSIONAL MARKET OUTLOOK
{spot}(PEPEUSDT)
$PEPE is currently trading inside a very important price range where both buyers and sellers are fighting for control. The recent chart movement shows strong recovery behavior after every correction, which means demand is still active in the market. This type of structure usually appears before a high-volatility move. Traders should carefully watch breakout confirmations because meme coins can move extremely fast once momentum enters the market.
From a technical perspective, the support region remains very strong and continues attracting fresh buyers on dips. Resistance levels above current price may create temporary rejection, but a clean breakout with strong volume can open the door for another bullish expansion. Short-term traders can focus on quick momentum trades near support and resistance zones, while long-term holders may continue building positions gradually during market pullbacks. Proper stop-loss placement is very important because high-volatility assets can create sudden fake moves before continuing trend direction.
Overall, $PEPE still remains one of the most watched meme assets in the crypto market. Market sentiment, liquidity inflow, and community attention are keeping the project highly active. Professional traders normally avoid chasing pumps and instead wait for healthy pullbacks and confirmation signals before entering trades. Patience, discipline, and correct risk management will always provide better results than emotional trading decisions. 📊🚀
#pepe⚡ #PEPEATH #pepepumping #PEPE_EXPERT #Write2Earn!
🐸 $PEPE TRADING VIEW REPORT — PROFESSIONAL MARKET OUTLOOK
$PEPE is currently trading inside a very important price range where both buyers and sellers are fighting for control. The recent chart movement shows strong recovery behavior after every correction, which means demand is still active in the market. This type of structure usually appears before a high-volatility move. Traders should carefully watch breakout confirmations because meme coins can move extremely fast once momentum enters the market.
From a technical perspective, the support region remains very strong and continues attracting fresh buyers on dips. Resistance levels above current price may create temporary rejection, but a clean breakout with strong volume can open the door for another bullish expansion. Short-term traders can focus on quick momentum trades near support and resistance zones, while long-term holders may continue building positions gradually during market pullbacks. Proper stop-loss placement is very important because high-volatility assets can create sudden fake moves before continuing trend direction.
Overall, $PEPE still remains one of the most watched meme assets in the crypto market. Market sentiment, liquidity inflow, and community attention are keeping the project highly active. Professional traders normally avoid chasing pumps and instead wait for healthy pullbacks and confirmation signals before entering trades. Patience, discipline, and correct risk management will always provide better results than emotional trading decisions. 📊🚀
#pepe⚡ #PEPEATH #pepepumping #PEPE_EXPERT #Write2Earn!
$PEPE is currently trading inside a very important price range where both buyers and sellers are fighting for control. The recent chart movement shows strong recovery behavior after every correction, which means demand is still active in the market. This type of structure usually appears before a high-volatility move. Traders should carefully watch breakout confirmations because meme coins can move extremely fast once momentum enters the market.
From a technical perspective, the support region remains very strong and continues attracting fresh buyers on dips. Resistance levels above current price may create temporary rejection, but a clean breakout with strong volume can open the door for another bullish expansion. Short-term traders can focus on quick momentum trades near support and resistance zones, while long-term holders may continue building positions gradually during market pullbacks. Proper stop-loss placement is very important because high-volatility assets can create sudden fake moves before continuing trend direction.
Overall, $PEPE still remains one of the most watched meme assets in the crypto market. Market sentiment, liquidity inflow, and community attention are keeping the project highly active. Professional traders normally avoid chasing pumps and instead wait for healthy pullbacks and confirmation signals before entering trades. Patience, discipline, and correct risk management will always provide better results than emotional trading decisions. 📊🚀
#pepe⚡ #PEPEATH #pepepumping #PEPE_EXPERT #Write2Earn!
1
238

·
--
🐸 $PEPE
{spot}(PEPEUSDT)
UPDATE 🚀
Everyone has a different $PEPE target, but the truth is simple:
💸 Hype moves price
🐋 Whales create volatility
🔥 Community drives momentum
$PEPE can make huge moves, but no prediction is guaranteed.
I'm watching volume and market sentiment — the rest is just noise. 👀🚀
#PEPE_EXPERT #Memecoin #CryptocurrencyWealth
🐸 $PEPE
UPDATE 🚀
Everyone has a different $PEPE target, but the truth is simple:
💸 Hype moves price
🐋 Whales create volatility
🔥 Community drives momentum
$PEPE can make huge moves, but no prediction is guaranteed.
I'm watching volume and market sentiment — the rest is just noise. 👀🚀
#PEPE_EXPERT #Memecoin #CryptocurrencyWealth
UPDATE 🚀
Everyone has a different $PEPE target, but the truth is simple:
💸 Hype moves price
🐋 Whales create volatility
🔥 Community drives momentum
$PEPE can make huge moves, but no prediction is guaranteed.
I'm watching volume and market sentiment — the rest is just noise. 👀🚀
#PEPE_EXPERT #Memecoin #CryptocurrencyWealth

1
508

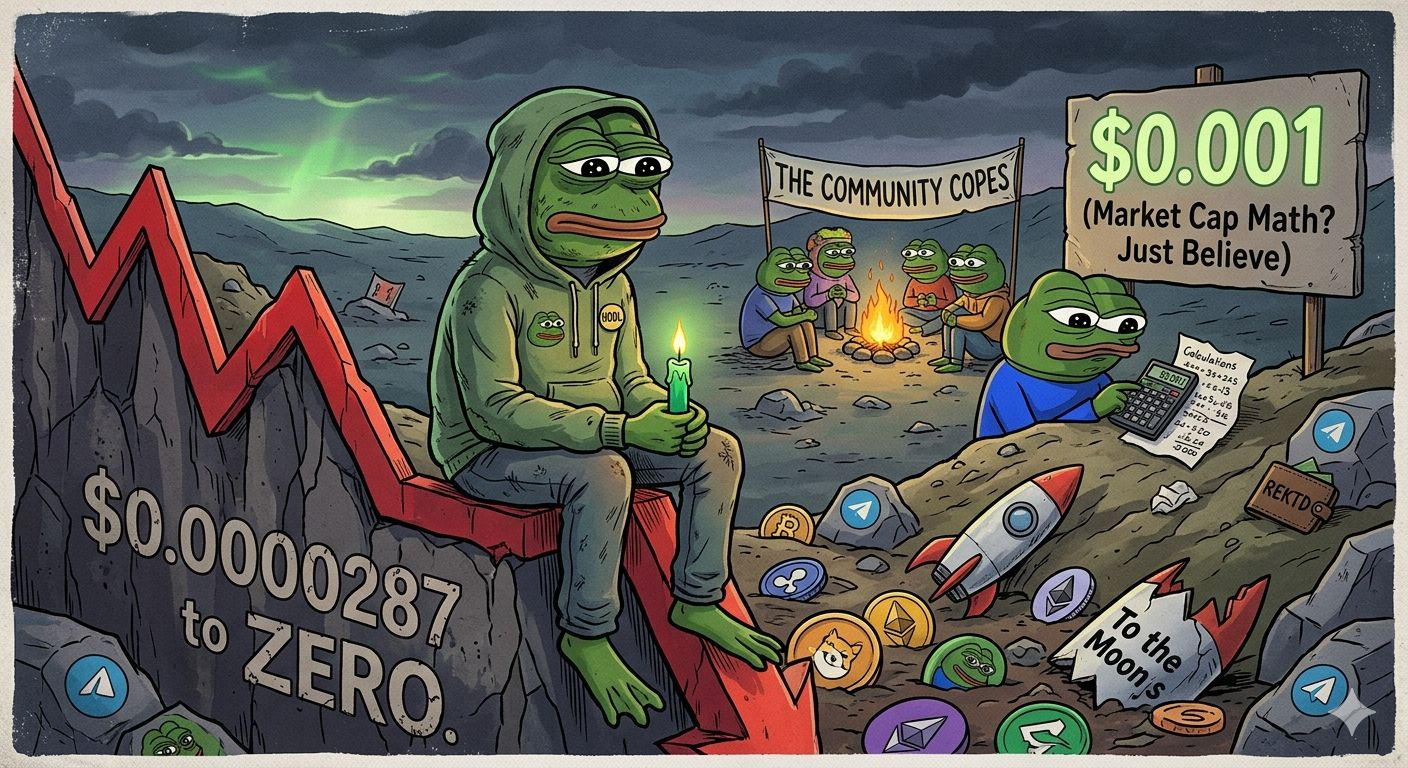
So it's time for all of you to look at this legendary $PePe 🐸 “crash from $0.0000287 to zero”… or at least emotionally to zero, which in meme coin culture is the same thing.
But, the funny thing about crypto, is that survival is somehow bullish analysis. 👀
It's still here after a few years.
Still trading.
They're not going to disappear altogether like thousands of other “next big things” that are lost in forgotten wallets and forgotten Telegram groups.
I suppose being around for all the market cycles is enough to get people to start saying, “What if this isn't over?” — and nothing breeds hope like a candle still on a chart, anyway.
The casual mention of $PePe hitting $0.001 again now, with $0.001 being a minor inconvenience in the background trying not to crack a joke about market cap math. In crypto, however, “sounds impossible” is more of a statement of fact than a warning, and is generally regarded as a form of free marketing.
So that the story lives on:
The frog lives.
The community copes.
And, somewhere out there, somebody is still figuring out how to achieve generational wealth with $12.And, somewhere out there, someone is still working out that this is “mathematically possible” to achieve with $12.$PEPE
{spot}(PEPEUSDT)
#PEPE #pepe #PEPE创历史新高 #pepe⚡ #PEPE_EXPERT
So it's time for all of you to look at this legendary $PePe 🐸 “crash from $0.0000287 to zero”… or at least emotionally to zero, which in meme coin culture is the same thing.
But, the funny thing about crypto, is that survival is somehow bullish analysis. 👀
It's still here after a few years.
Still trading.
They're not going to disappear altogether like thousands of other “next big things” that are lost in forgotten wallets and forgotten Telegram groups.
I suppose being around for all the market cycles is enough to get people to start saying, “What if this isn't over?” — and nothing breeds hope like a candle still on a chart, anyway.
The casual mention of $PePe hitting $0.001 again now, with $0.001 being a minor inconvenience in the background trying not to crack a joke about market cap math. In crypto, however, “sounds impossible” is more of a statement of fact than a warning, and is generally regarded as a form of free marketing.
So that the story lives on:
The frog lives.
The community copes.
And, somewhere out there, somebody is still figuring out how to achieve generational wealth with $12.And, somewhere out there, someone is still working out that this is “mathematically possible” to achieve with $12.$PEPE
#PEPE #pepe #PEPE创历史新高 #pepe⚡ #PEPE_EXPERT
But, the funny thing about crypto, is that survival is somehow bullish analysis. 👀
It's still here after a few years.
Still trading.
They're not going to disappear altogether like thousands of other “next big things” that are lost in forgotten wallets and forgotten Telegram groups.
I suppose being around for all the market cycles is enough to get people to start saying, “What if this isn't over?” — and nothing breeds hope like a candle still on a chart, anyway.
The casual mention of $PePe hitting $0.001 again now, with $0.001 being a minor inconvenience in the background trying not to crack a joke about market cap math. In crypto, however, “sounds impossible” is more of a statement of fact than a warning, and is generally regarded as a form of free marketing.
So that the story lives on:
The frog lives.
The community copes.
And, somewhere out there, somebody is still figuring out how to achieve generational wealth with $12.And, somewhere out there, someone is still working out that this is “mathematically possible” to achieve with $12.$PEPE
#PEPE #pepe #PEPE创历史新高 #pepe⚡ #PEPE_EXPERT
2
3
1.3k

·
--
#PEPE O melhor momento para investir em PEPE normalmente não é depois de uma alta explosiva, e sim quando há correção, consolidação e entrada com plano.
Uma forma mais prudente de pensar:
Evite entrar no pico do hype quando todo mundo está falando e o preço já disparou, o risco de correção aumenta.
Prefira entradas parciais em vez de colocar tudo de uma vez, dividir a compra em partes reduz o risco de timing ruim.
Espere confirmação um bom cenário costuma ser:
queda + estabilização,
volume saudável,
preço parando de fazer mínimas tão agressivas.
Defina saída antes de entrar em memecoin isso é essencial:
quanto você aceita perder,
onde pretende realizar lucro,
qual percentual do portfólio vai expor.
Para PEPE especificamente:
faz mais sentido como posição especulativa pequena
não é ideal para quem busca segurança
o “melhor momento” costuma ser após resfriamento do mercado, não no auge da euforia
Estratégia simples e mais segura:
colocar só uma pequena parte do capital;
comprar em parcelas;
não perseguir candle forte de alta;
manter a maior parte em ativos mais sólidos como BTC/ETH, se seu perfil for mais conservador.
#PEPE市值超越LTC #pepe⚡ #PEPE_EXPERT
#PEPE O melhor momento para investir em PEPE normalmente não é depois de uma alta explosiva, e sim quando há correção, consolidação e entrada com plano.
Uma forma mais prudente de pensar:
Evite entrar no pico do hype quando todo mundo está falando e o preço já disparou, o risco de correção aumenta.
Prefira entradas parciais em vez de colocar tudo de uma vez, dividir a compra em partes reduz o risco de timing ruim.
Espere confirmação um bom cenário costuma ser:
queda + estabilização,
volume saudável,
preço parando de fazer mínimas tão agressivas.
Defina saída antes de entrar em memecoin isso é essencial:
quanto você aceita perder,
onde pretende realizar lucro,
qual percentual do portfólio vai expor.
Para PEPE especificamente:
faz mais sentido como posição especulativa pequena
não é ideal para quem busca segurança
o “melhor momento” costuma ser após resfriamento do mercado, não no auge da euforia
Estratégia simples e mais segura:
colocar só uma pequena parte do capital;
comprar em parcelas;
não perseguir candle forte de alta;
manter a maior parte em ativos mais sólidos como BTC/ETH, se seu perfil for mais conservador.
#PEPE市值超越LTC #pepe⚡ #PEPE_EXPERT
Uma forma mais prudente de pensar:
Evite entrar no pico do hype quando todo mundo está falando e o preço já disparou, o risco de correção aumenta.
Prefira entradas parciais em vez de colocar tudo de uma vez, dividir a compra em partes reduz o risco de timing ruim.
Espere confirmação um bom cenário costuma ser:
queda + estabilização,
volume saudável,
preço parando de fazer mínimas tão agressivas.
Defina saída antes de entrar em memecoin isso é essencial:
quanto você aceita perder,
onde pretende realizar lucro,
qual percentual do portfólio vai expor.
Para PEPE especificamente:
faz mais sentido como posição especulativa pequena
não é ideal para quem busca segurança
o “melhor momento” costuma ser após resfriamento do mercado, não no auge da euforia
Estratégia simples e mais segura:
colocar só uma pequena parte do capital;
comprar em parcelas;
não perseguir candle forte de alta;
manter a maior parte em ativos mais sólidos como BTC/ETH, se seu perfil for mais conservador.
#PEPE市值超越LTC #pepe⚡ #PEPE_EXPERT
1
250

·
--
$PEPE will remain most famous in history.✈️💸💵
{spot}(PEPEUSDT)
#PEPE #PEPE_EXPERT #PEPEUSDTPriceAlert #PEPEUSDT Crypto
$PEPE will remain most famous in history.✈️💸💵
#PEPE #PEPE_EXPERT #PEPEUSDTPriceAlert #PEPEUSDT Crypto
#PEPE #PEPE_EXPERT #PEPEUSDTPriceAlert #PEPEUSDT Crypto
1
54
·
--
Bullish
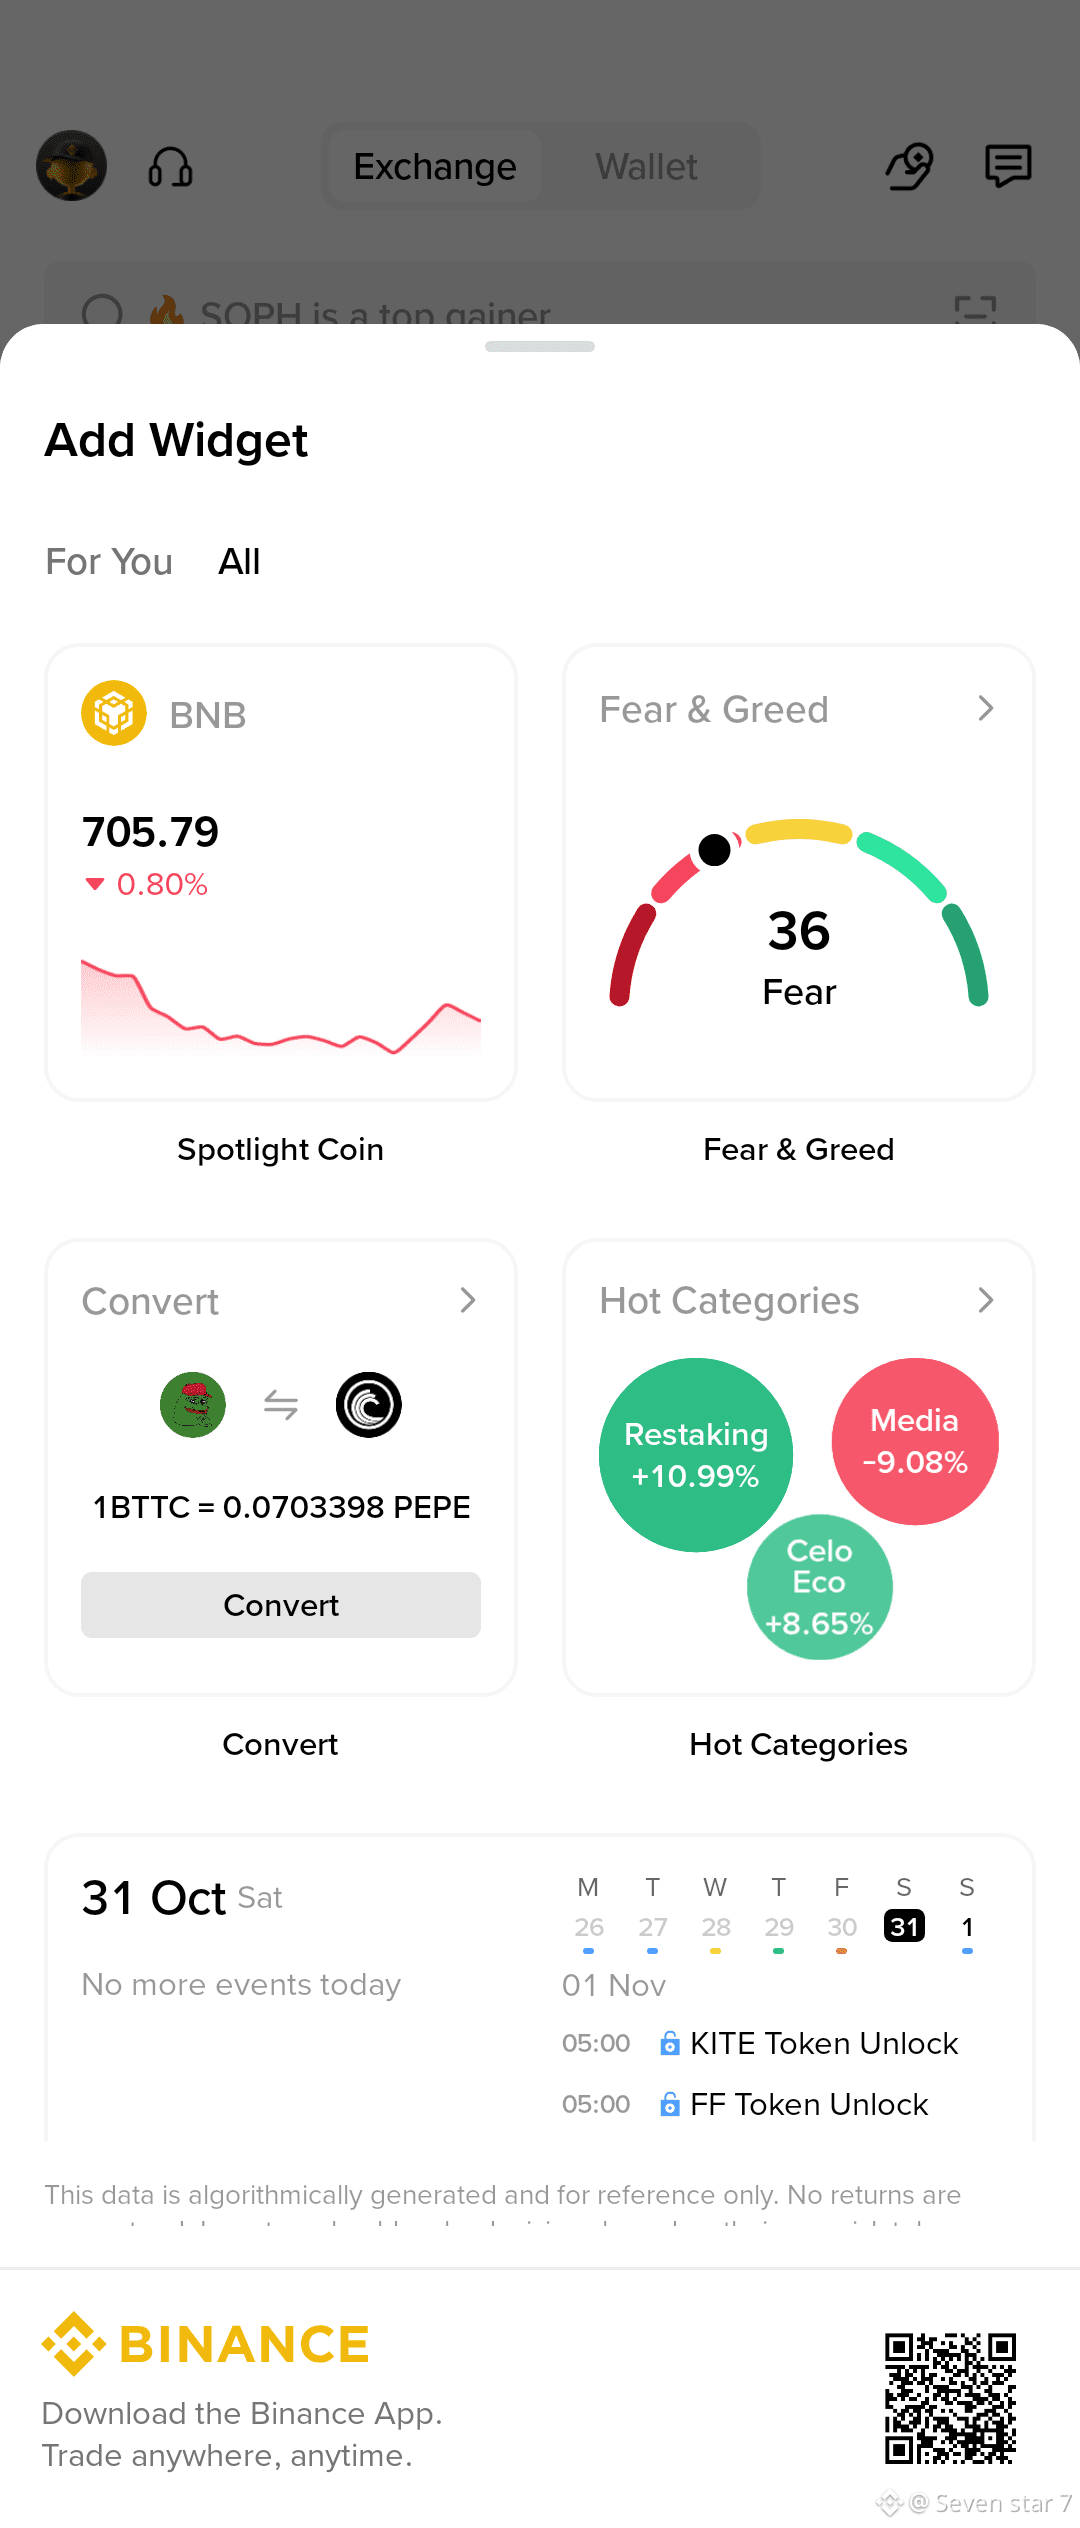
I have a feeling that $PEPE is going to explode soon because it's got awake now and maintaining the bullish movement.What you are thinking about pepe #pepepumping #PEPE_EXPERT
I have a feeling that $PEPE is going to explode soon because it's got awake now and maintaining the bullish movement.What you are thinking about pepe #pepepumping #PEPE_EXPERT
2
481

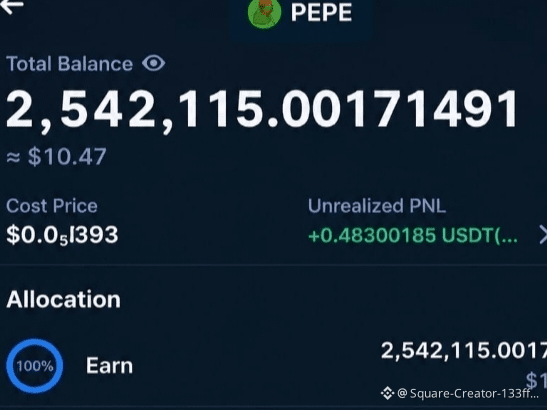
So many years of waiting and now $PEPE is going to explode 💥 buy as much as you can before it's too late ⏰ #PEPE_EXPERT
So many years of waiting and now $PEPE is going to explode 💥 buy as much as you can before it's too late ⏰ #PEPE_EXPERT
49

·
--
Is $PEPE Coin Preparing for Another Big Move? 🐸🚀
PEPE’s market cap is currently above $2 billion, and the price has shown strong movement recently. But what could happen next? 👀📈
Do your own research (DYOR) before making any investment decisions. ⚠️💎
#PEPE #EarningsSeason #PEPE_EXPERT
{spot}(PEPEUSDT)
Is $PEPE Coin Preparing for Another Big Move? 🐸🚀
PEPE’s market cap is currently above $2 billion, and the price has shown strong movement recently. But what could happen next? 👀📈
Do your own research (DYOR) before making any investment decisions. ⚠️💎
#PEPE #EarningsSeason #PEPE_EXPERT
PEPE’s market cap is currently above $2 billion, and the price has shown strong movement recently. But what could happen next? 👀📈
Do your own research (DYOR) before making any investment decisions. ⚠️💎
#PEPE #EarningsSeason #PEPE_EXPERT

1
374

·
--
Bullish
فقط تخيل في يوم من الايام القليلة القادمة يصير سعر هالعملة 1$
رح صير مليونير 😂😂😂😂 مش قادر صدق بس لي امل كبير في عملة
$PEPE
let's Go
#PEPE创历史新高
#PEPE市值超越LTC
#pepe⚡
#PEPE_EXPERT
فقط تخيل في يوم من الايام القليلة القادمة يصير سعر هالعملة 1$
رح صير مليونير 😂😂😂😂 مش قادر صدق بس لي امل كبير في عملة
$PEPE
let's Go
#PEPE创历史新高
#PEPE市值超越LTC
#pepe⚡
#PEPE_EXPERT
رح صير مليونير 😂😂😂😂 مش قادر صدق بس لي امل كبير في عملة
$PEPE
let's Go
#PEPE创历史新高
#PEPE市值超越LTC
#pepe⚡
#PEPE_EXPERT
3
356
Log in to explore more content
Join global crypto users on Binance Square
⚡️ Get latest and useful information about crypto.
💬 Trusted by the world’s largest crypto exchange.
👍 Discover real insights from verified creators.
Email / Phone number
Trending Topics
1
#BinanceWithdrawalScamWarning
8,715 views
342 Discussing
2
#USMidtermElections
556,416 views
2,912 Discussing
3
#USOctoberNFP-AreRateCutsStillPossible
17,573 views
363 Discussing
4
#AppleEarningsAhead-CanStockHitNewHigh
5,527 views
262 Discussing
5
#Verify1to1BinanceReserves
18,018 views
293 Discussing
6
#BinanceRestores28FiatWithdrawals
91,209 views
924 Discussing
7
#StrategyRepurchases$208MSTRCAdds811Bitcoin
1,971 views
12 Discussing
8
#FATFLaunchesReviewOfCryptoHubsMoneyLaunderingControls
429 views
9 Discussing
9
#BinanceProcesses$4.65BWithdrawals
94,834 views
355 Discussing
10
#HKMALaunchesSAGEAgenticFinanceProject
2,449 views
145 Discussing