
#liquidationmap
liquidationmap
407,720 views
1,191 Discussing
Hot
Latest

·
--
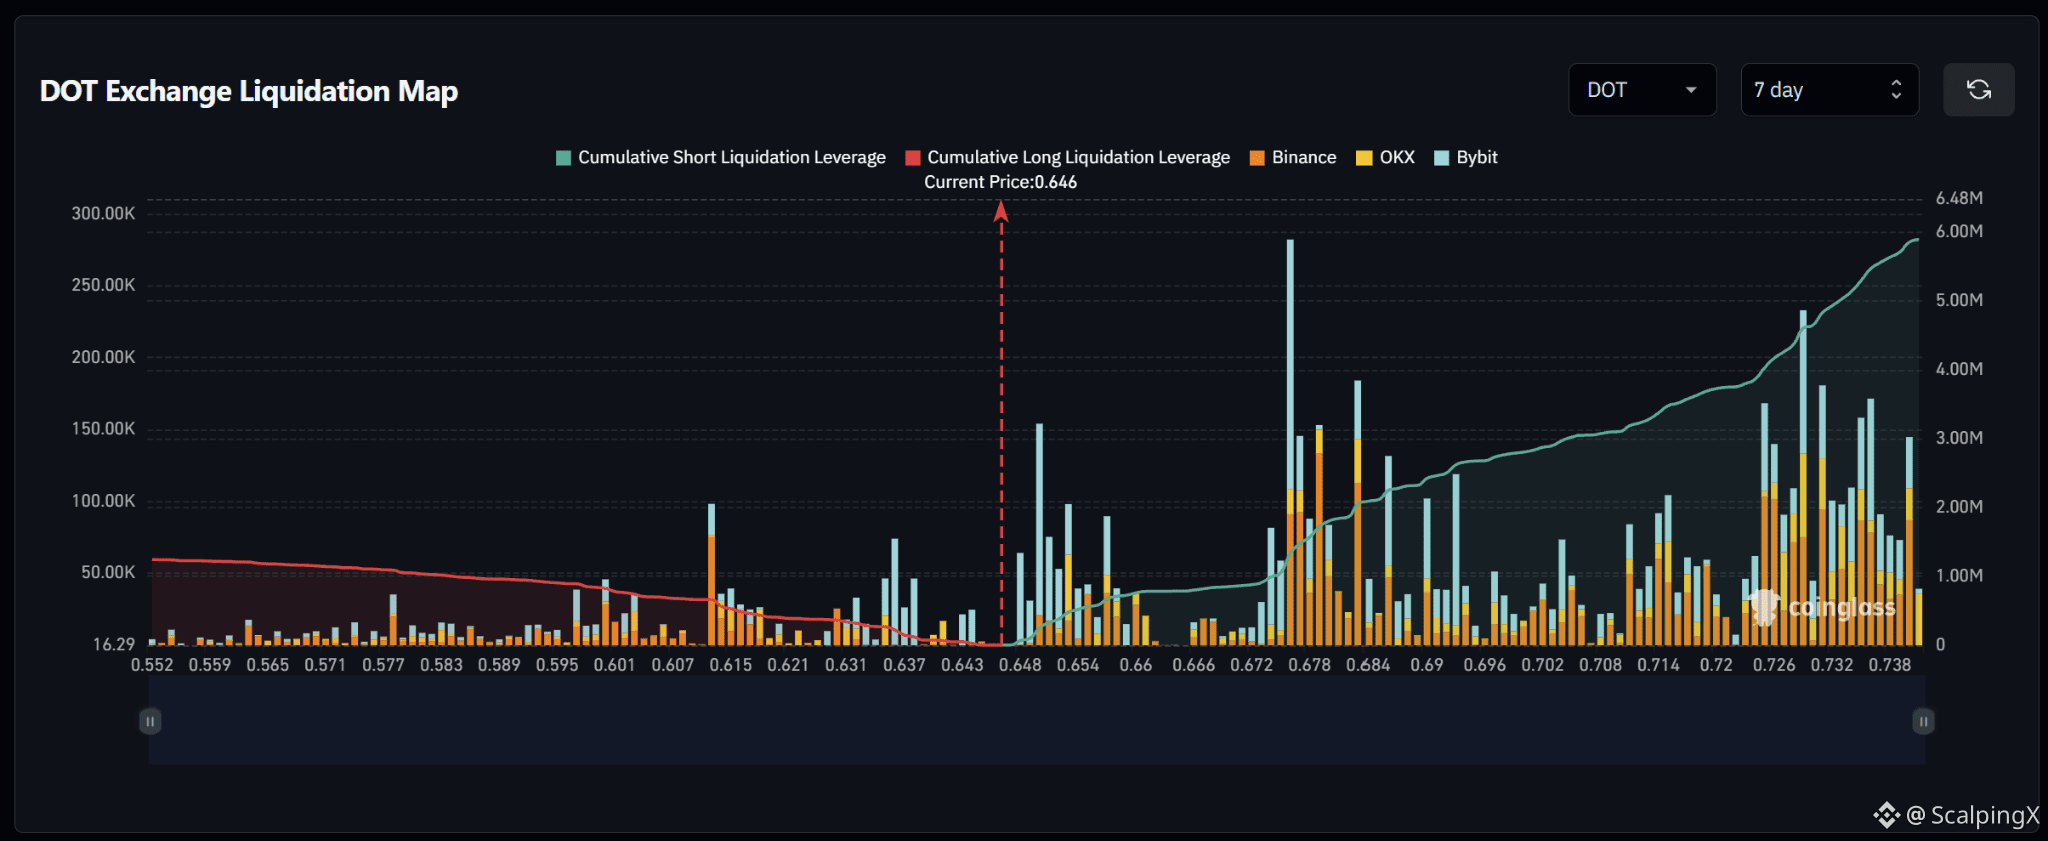
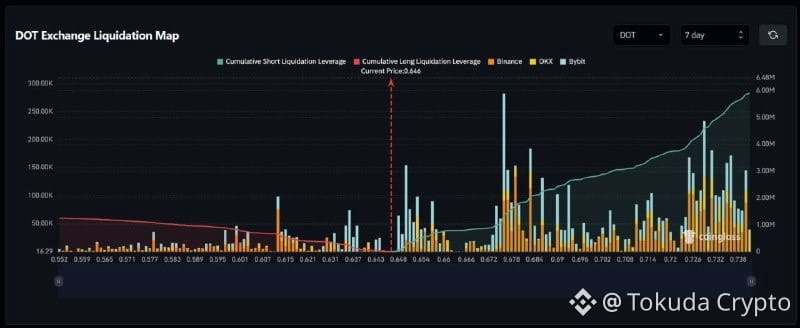
$DOT – Liquidation Map (7 days) – Index ~0.646
🧭 The preferred scenario is a short liquidation sweep at 0.648–0.657. These clusters are close to price and larger than the long clusters immediately below, particularly around 0.650 and 0.653.
🔺 A break and hold above 0.657 would shift focus to 0.674–0.686, with the largest bar near 0.676. The 0.661–0.671 stretch is relatively sparse, while 0.679 and 0.683 mark additional notable clusters above.
🎯 Holding above 0.686 would bring 0.690–0.694 into view. Further out, large clusters build again at 0.726–0.740. A short sweep followed by a drop below 0.646 would weaken upward continuation.
⚖️ Losing 0.646 without reclaiming it would shift priority to a long liquidation sweep at 0.642–0.644, then 0.635–0.639. Below 0.635, clusters are more scattered ahead of 0.612–0.616. Reclaiming 0.646 after a sweep would weaken downward continuation.
#LiquidationMap
$DOT – Liquidation Map (7 days) – Index ~0.646
🧭 The preferred scenario is a short liquidation sweep at 0.648–0.657. These clusters are close to price and larger than the long clusters immediately below, particularly around 0.650 and 0.653.
🔺 A break and hold above 0.657 would shift focus to 0.674–0.686, with the largest bar near 0.676. The 0.661–0.671 stretch is relatively sparse, while 0.679 and 0.683 mark additional notable clusters above.
🎯 Holding above 0.686 would bring 0.690–0.694 into view. Further out, large clusters build again at 0.726–0.740. A short sweep followed by a drop below 0.646 would weaken upward continuation.
⚖️ Losing 0.646 without reclaiming it would shift priority to a long liquidation sweep at 0.642–0.644, then 0.635–0.639. Below 0.635, clusters are more scattered ahead of 0.612–0.616. Reclaiming 0.646 after a sweep would weaken downward continuation.
#LiquidationMap
🧭 The preferred scenario is a short liquidation sweep at 0.648–0.657. These clusters are close to price and larger than the long clusters immediately below, particularly around 0.650 and 0.653.
🔺 A break and hold above 0.657 would shift focus to 0.674–0.686, with the largest bar near 0.676. The 0.661–0.671 stretch is relatively sparse, while 0.679 and 0.683 mark additional notable clusters above.
🎯 Holding above 0.686 would bring 0.690–0.694 into view. Further out, large clusters build again at 0.726–0.740. A short sweep followed by a drop below 0.646 would weaken upward continuation.
⚖️ Losing 0.646 without reclaiming it would shift priority to a long liquidation sweep at 0.642–0.644, then 0.635–0.639. Below 0.635, clusters are more scattered ahead of 0.612–0.616. Reclaiming 0.646 after a sweep would weaken downward continuation.
#LiquidationMap
46
·
--
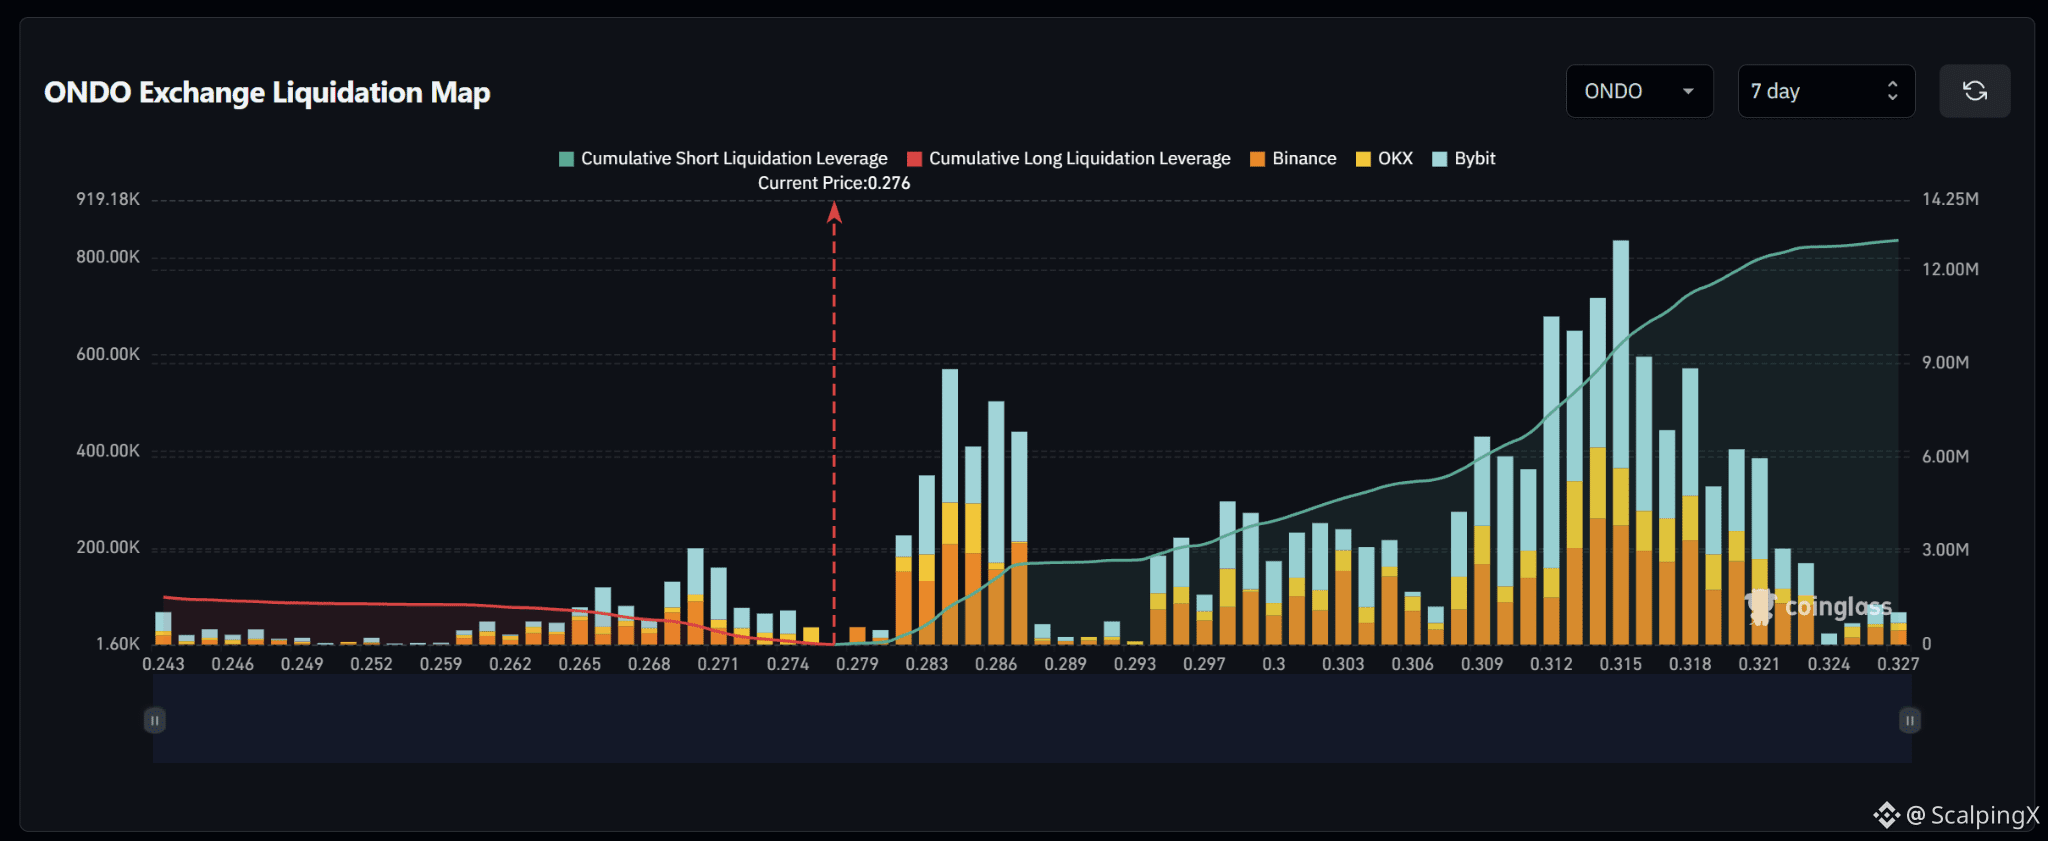
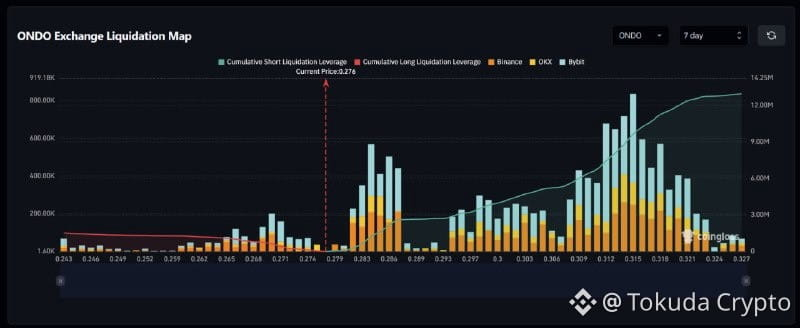
$ONDO – Liquidation Map (7 days) – Index ~0.276
🧭 Favor a short-liquidation sweep at 0.281–0.287. This zone contains several consecutive large bars, particularly around 0.284 and 0.286, while nearby downside long clusters are considerably smaller.
🔺 Breaking and holding above 0.287 would shift focus to 0.294–0.304. The 0.288–0.293 stretch is relatively sparse, while subsequent clusters are moderately sized and more scattered.
🎯 Holding above 0.304 would put 0.309–0.318 in focus, especially 0.312–0.316, with the largest bar around 0.315. Bar sizes decline noticeably above 0.321. A short sweep followed by a drop below 0.276 would weaken upside continuation.
⚖️ Losing 0.276 without reclaiming it would shift preference toward a long-liquidation sweep at 0.270–0.274. Holding below 0.270 would bring 0.265–0.269 into view; lower long clusters are relatively sparse. Reclaiming 0.276 after a sweep would weaken downside continuation.
#LiquidationMap
$ONDO – Liquidation Map (7 days) – Index ~0.276
🧭 Favor a short-liquidation sweep at 0.281–0.287. This zone contains several consecutive large bars, particularly around 0.284 and 0.286, while nearby downside long clusters are considerably smaller.
🔺 Breaking and holding above 0.287 would shift focus to 0.294–0.304. The 0.288–0.293 stretch is relatively sparse, while subsequent clusters are moderately sized and more scattered.
🎯 Holding above 0.304 would put 0.309–0.318 in focus, especially 0.312–0.316, with the largest bar around 0.315. Bar sizes decline noticeably above 0.321. A short sweep followed by a drop below 0.276 would weaken upside continuation.
⚖️ Losing 0.276 without reclaiming it would shift preference toward a long-liquidation sweep at 0.270–0.274. Holding below 0.270 would bring 0.265–0.269 into view; lower long clusters are relatively sparse. Reclaiming 0.276 after a sweep would weaken downside continuation.
#LiquidationMap
🧭 Favor a short-liquidation sweep at 0.281–0.287. This zone contains several consecutive large bars, particularly around 0.284 and 0.286, while nearby downside long clusters are considerably smaller.
🔺 Breaking and holding above 0.287 would shift focus to 0.294–0.304. The 0.288–0.293 stretch is relatively sparse, while subsequent clusters are moderately sized and more scattered.
🎯 Holding above 0.304 would put 0.309–0.318 in focus, especially 0.312–0.316, with the largest bar around 0.315. Bar sizes decline noticeably above 0.321. A short sweep followed by a drop below 0.276 would weaken upside continuation.
⚖️ Losing 0.276 without reclaiming it would shift preference toward a long-liquidation sweep at 0.270–0.274. Holding below 0.270 would bring 0.265–0.269 into view; lower long clusters are relatively sparse. Reclaiming 0.276 after a sweep would weaken downside continuation.
#LiquidationMap
34

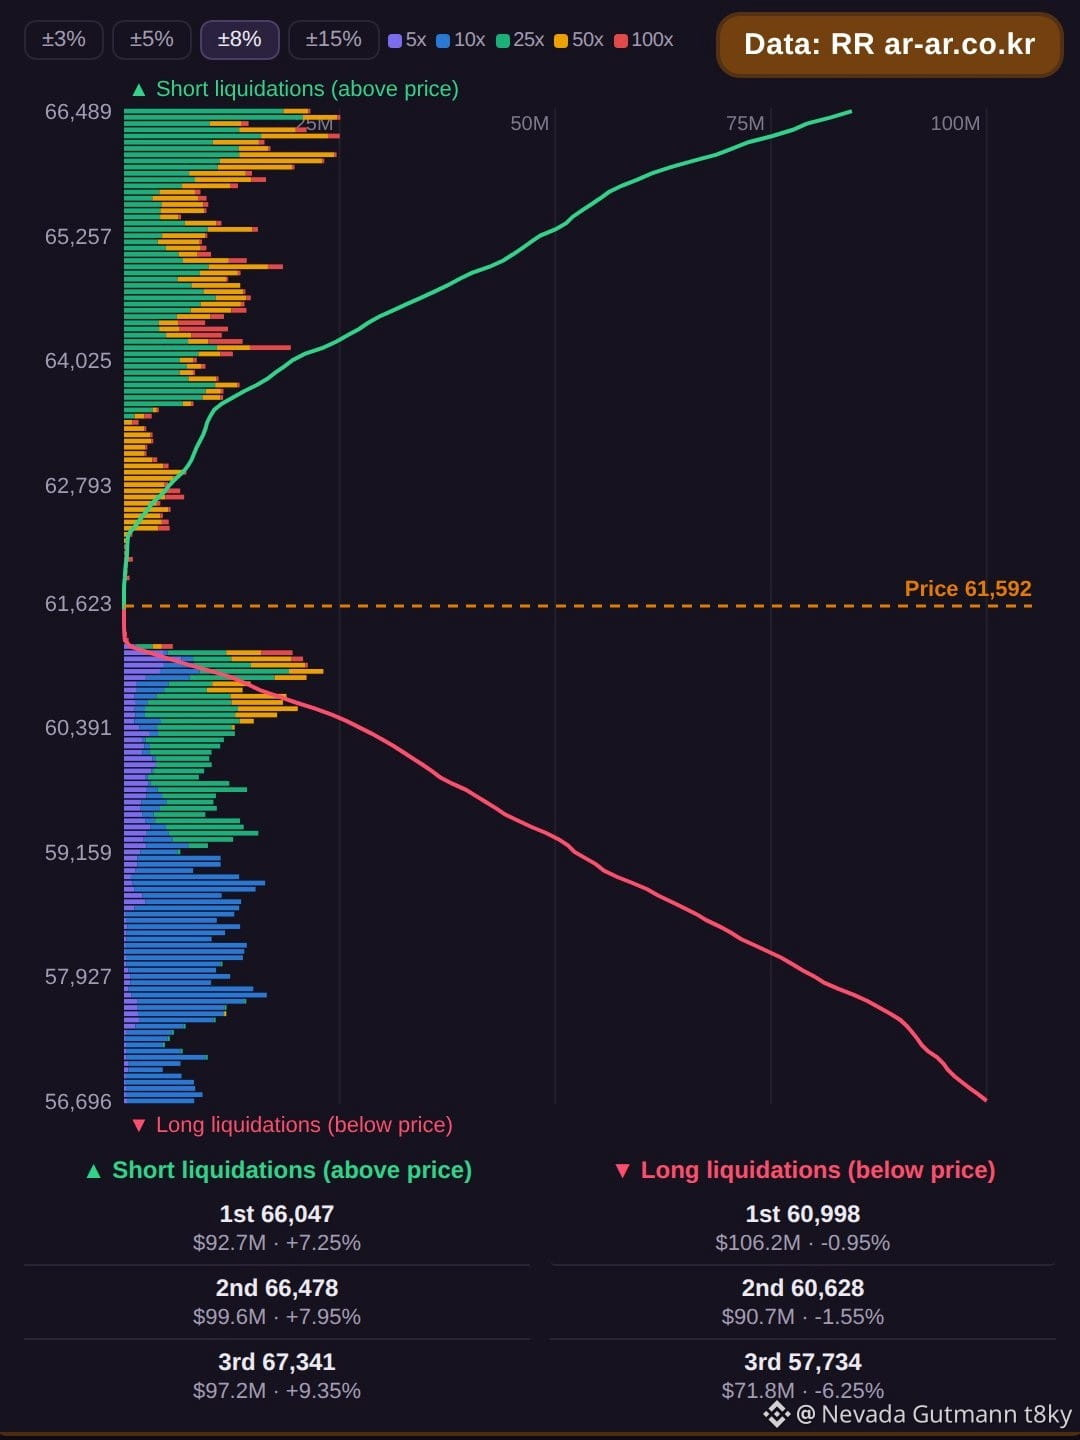
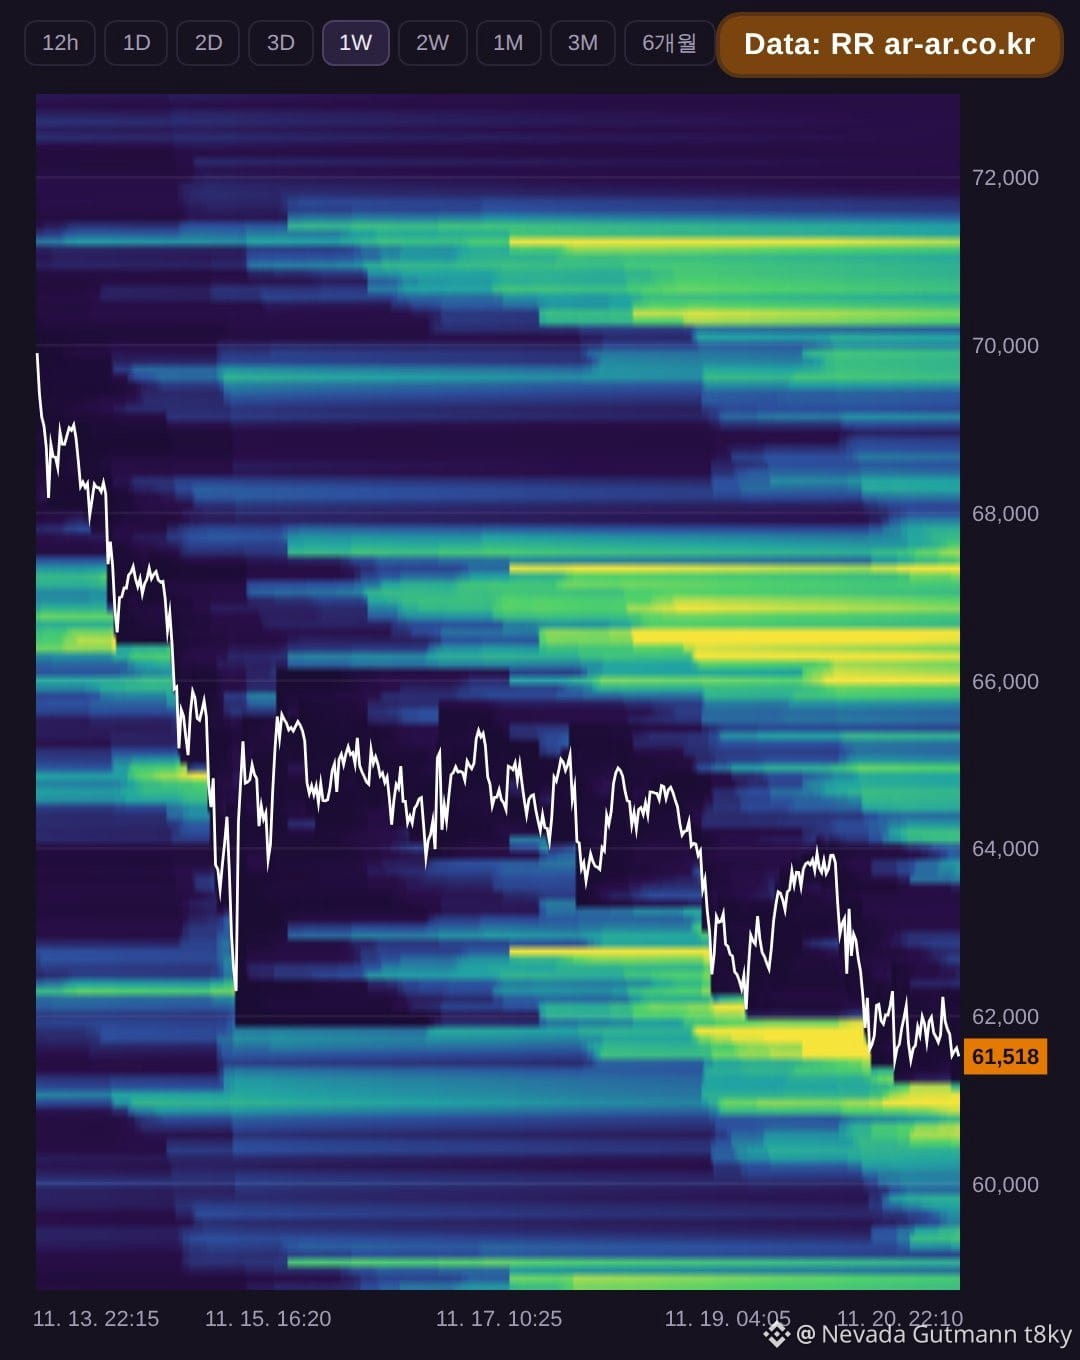
Bitcoin is trading at $61,477 as liquidation clusters form on both sides. Above the current price, short liquidations are stacked at $65,995 with about $91.9M, followed by $66,487 holding roughly $99.6M, and $67,348 showing about $97.3M. The three levels together total $288.8M. Below price, long liquidations sit at $60,954 with about $102.5M, then $60,585 carrying around $91.4M, and $57,757 with about $71.3M. These three sum to $265.3M. Longs are closer to the current price at $60,954, just -0.85% away, while the larger stack is on the short side. Traders may watch whether price action tests the nearby long cluster first or pushes higher toward the heavier short liquidations above.
Data source: RR (ar-ar.co.kr). Estimated from BTCUSDT futures data. Not financial advice.
#BTC #Bitcoin #LiquidationMap #LiquidationHeatmap
Bitcoin is trading at $61,477 as liquidation clusters form on both sides. Above the current price, short liquidations are stacked at $65,995 with about $91.9M, followed by $66,487 holding roughly $99.6M, and $67,348 showing about $97.3M. The three levels together total $288.8M. Below price, long liquidations sit at $60,954 with about $102.5M, then $60,585 carrying around $91.4M, and $57,757 with about $71.3M. These three sum to $265.3M. Longs are closer to the current price at $60,954, just -0.85% away, while the larger stack is on the short side. Traders may watch whether price action tests the nearby long cluster first or pushes higher toward the heavier short liquidations above.
Data source: RR (ar-ar.co.kr). Estimated from BTCUSDT futures data. Not financial advice.
#BTC #Bitcoin #LiquidationMap #LiquidationHeatmap
Data source: RR (ar-ar.co.kr). Estimated from BTCUSDT futures data. Not financial advice.
#BTC #Bitcoin #LiquidationMap #LiquidationHeatmap
64
·
--
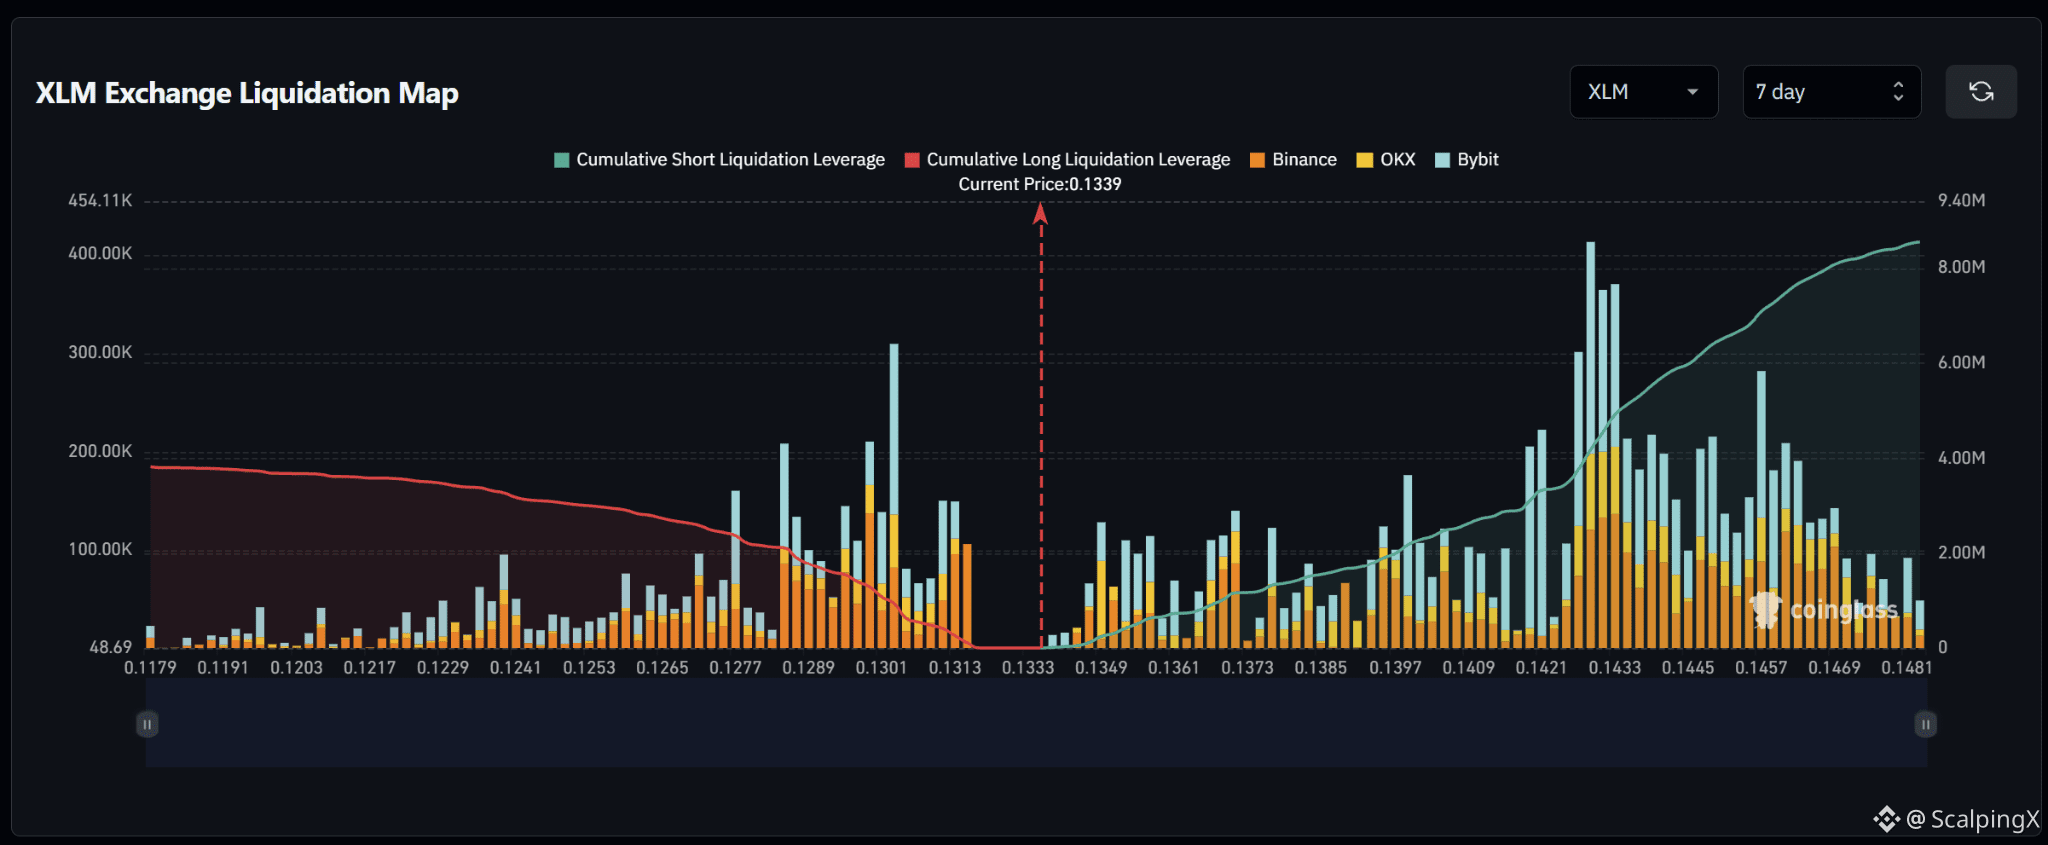
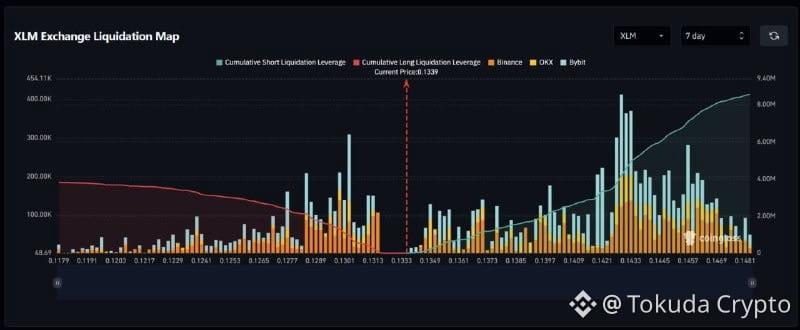
$XLM – Liquidation Map (7 days) – Index ~0.1339
🧭 Favor a short-liquidation sweep at 0.1347–0.1357. Upside bars sit closer to price than the notable long cluster at 0.1311–0.1315, with a relatively sparse stretch immediately below price.
🔺 Breaking and holding above 0.1357 would shift focus to 0.1369–0.1374, then 0.1395–0.1403. These moderately sized clusters precede a larger short zone further up.
🎯 Holding above 0.1403 would put 0.1420–0.1435 in focus, with the largest bar around 0.1429. A sustained move above 0.1435 would extend focus to 0.1440–0.1468. A short sweep followed by a drop below 0.1339 would weaken upside continuation.
⚖️ Losing 0.1333 without reclaiming it would shift preference toward a long-liquidation sweep at 0.1311–0.1315. Holding below 0.1311 would bring 0.1298–0.1305 into view, particularly around 0.1303, followed by 0.1283–0.1293.
#LiquidationMap
$XLM – Liquidation Map (7 days) – Index ~0.1339
🧭 Favor a short-liquidation sweep at 0.1347–0.1357. Upside bars sit closer to price than the notable long cluster at 0.1311–0.1315, with a relatively sparse stretch immediately below price.
🔺 Breaking and holding above 0.1357 would shift focus to 0.1369–0.1374, then 0.1395–0.1403. These moderately sized clusters precede a larger short zone further up.
🎯 Holding above 0.1403 would put 0.1420–0.1435 in focus, with the largest bar around 0.1429. A sustained move above 0.1435 would extend focus to 0.1440–0.1468. A short sweep followed by a drop below 0.1339 would weaken upside continuation.
⚖️ Losing 0.1333 without reclaiming it would shift preference toward a long-liquidation sweep at 0.1311–0.1315. Holding below 0.1311 would bring 0.1298–0.1305 into view, particularly around 0.1303, followed by 0.1283–0.1293.
#LiquidationMap
🧭 Favor a short-liquidation sweep at 0.1347–0.1357. Upside bars sit closer to price than the notable long cluster at 0.1311–0.1315, with a relatively sparse stretch immediately below price.
🔺 Breaking and holding above 0.1357 would shift focus to 0.1369–0.1374, then 0.1395–0.1403. These moderately sized clusters precede a larger short zone further up.
🎯 Holding above 0.1403 would put 0.1420–0.1435 in focus, with the largest bar around 0.1429. A sustained move above 0.1435 would extend focus to 0.1440–0.1468. A short sweep followed by a drop below 0.1339 would weaken upside continuation.
⚖️ Losing 0.1333 without reclaiming it would shift preference toward a long-liquidation sweep at 0.1311–0.1315. Holding below 0.1311 would bring 0.1298–0.1305 into view, particularly around 0.1303, followed by 0.1283–0.1293.
#LiquidationMap
33
·
--
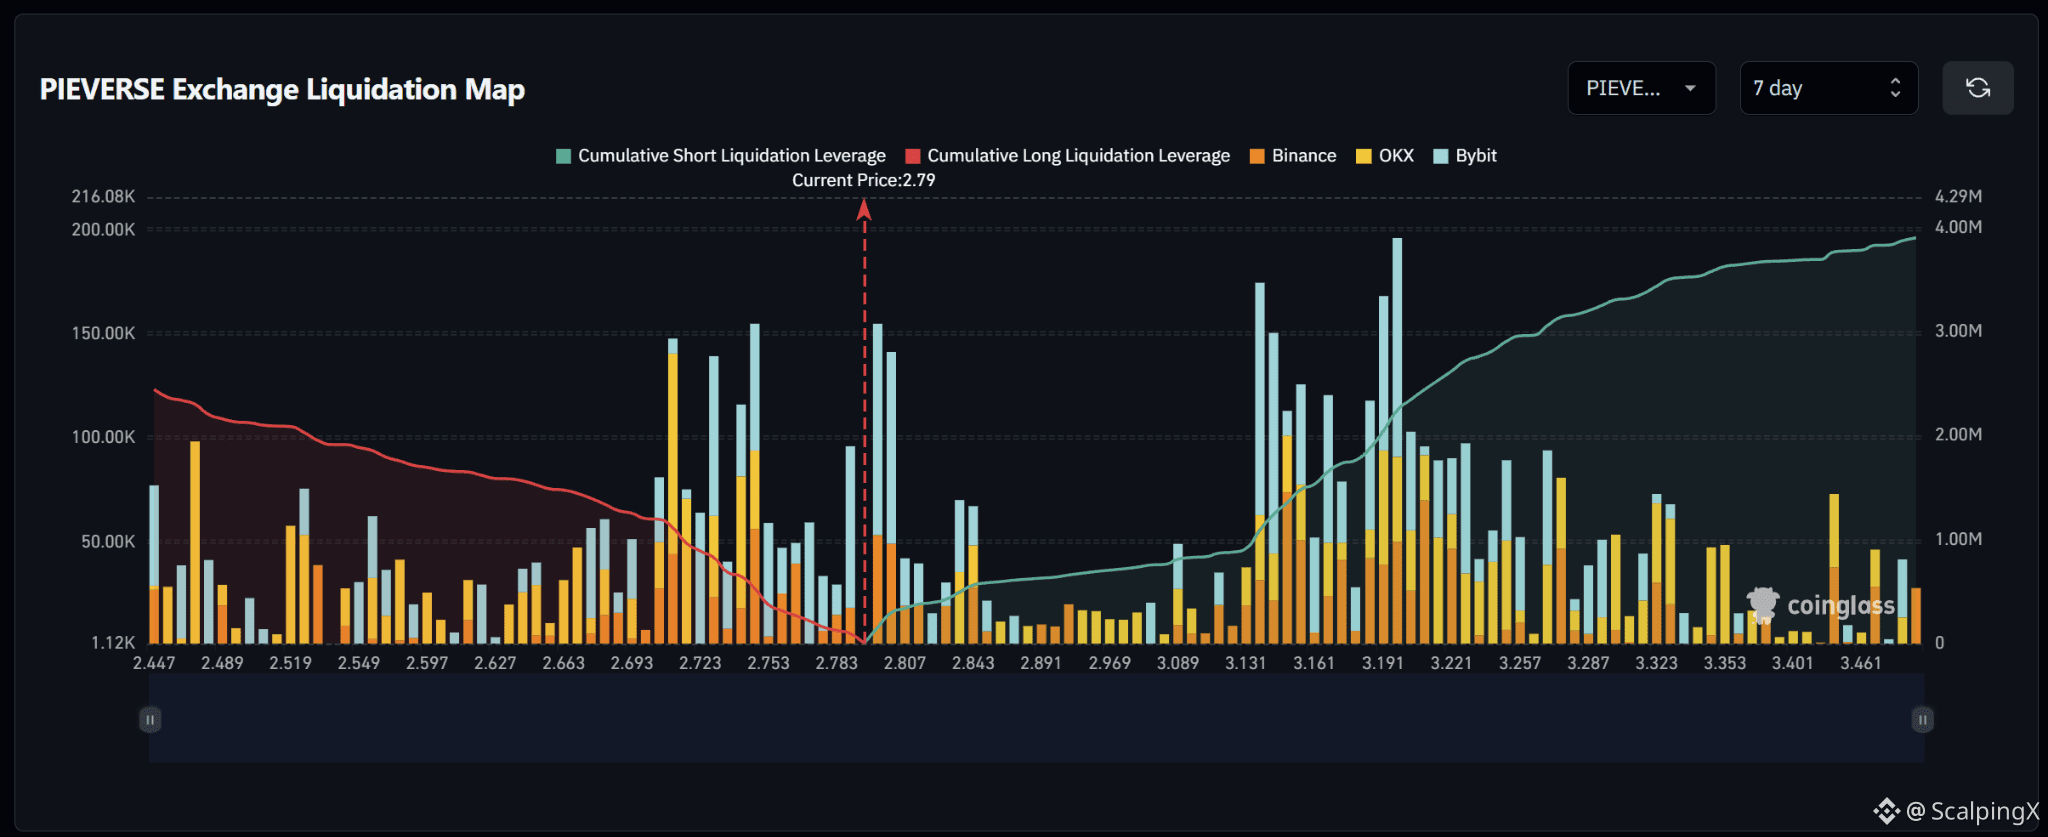
$PIEVERSE – Liquidation Map (7 days) – Index ~2.79
🧭 Favor a short-liquidation sweep at 2.795–2.810. A large bar sits immediately above price, while the nearest opposing long cluster around 2.78–2.79 is smaller.
🔺 Breaking and holding above 2.810 would shift focus to 2.835–2.850. Beyond this zone, liquidation bars decline noticeably and become scattered, without a continuous chain of large clusters.
🎯 The 2.85–3.13 stretch is relatively sparse before the dense short zone at 3.14–3.20, particularly around 3.14 and 3.20. This is a more distant area to watch if price extends higher. Sweeping nearby shorts and falling below 2.79 would weaken upside continuation.
⚖️ Losing 2.783 without reclaiming it would shift preference toward long-liquidation sweeps at 2.750–2.765, then 2.710–2.740. Holding below 2.710 would put 2.675–2.700 in focus; reclaiming 2.79 after a sweep would weaken downside continuation.
#LiquidationMap
$PIEVERSE – Liquidation Map (7 days) – Index ~2.79
🧭 Favor a short-liquidation sweep at 2.795–2.810. A large bar sits immediately above price, while the nearest opposing long cluster around 2.78–2.79 is smaller.
🔺 Breaking and holding above 2.810 would shift focus to 2.835–2.850. Beyond this zone, liquidation bars decline noticeably and become scattered, without a continuous chain of large clusters.
🎯 The 2.85–3.13 stretch is relatively sparse before the dense short zone at 3.14–3.20, particularly around 3.14 and 3.20. This is a more distant area to watch if price extends higher. Sweeping nearby shorts and falling below 2.79 would weaken upside continuation.
⚖️ Losing 2.783 without reclaiming it would shift preference toward long-liquidation sweeps at 2.750–2.765, then 2.710–2.740. Holding below 2.710 would put 2.675–2.700 in focus; reclaiming 2.79 after a sweep would weaken downside continuation.
#LiquidationMap
🧭 Favor a short-liquidation sweep at 2.795–2.810. A large bar sits immediately above price, while the nearest opposing long cluster around 2.78–2.79 is smaller.
🔺 Breaking and holding above 2.810 would shift focus to 2.835–2.850. Beyond this zone, liquidation bars decline noticeably and become scattered, without a continuous chain of large clusters.
🎯 The 2.85–3.13 stretch is relatively sparse before the dense short zone at 3.14–3.20, particularly around 3.14 and 3.20. This is a more distant area to watch if price extends higher. Sweeping nearby shorts and falling below 2.79 would weaken upside continuation.
⚖️ Losing 2.783 without reclaiming it would shift preference toward long-liquidation sweeps at 2.750–2.765, then 2.710–2.740. Holding below 2.710 would put 2.675–2.700 in focus; reclaiming 2.79 after a sweep would weaken downside continuation.
#LiquidationMap
12
·
--
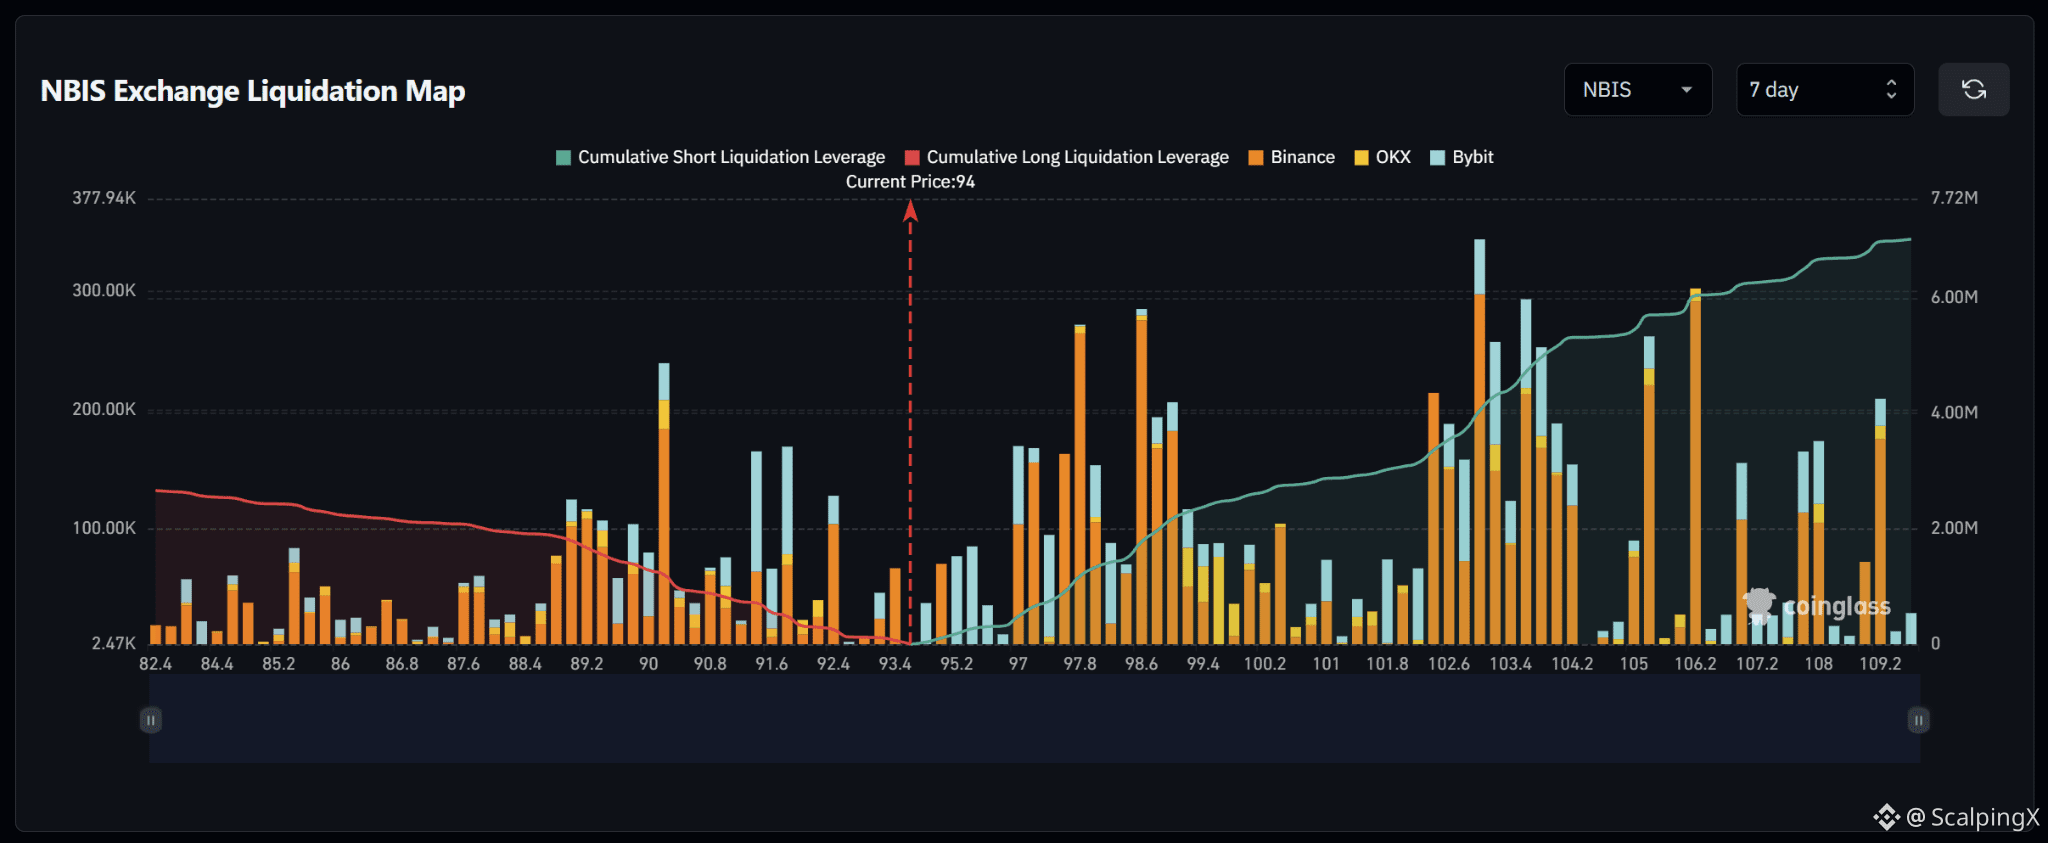
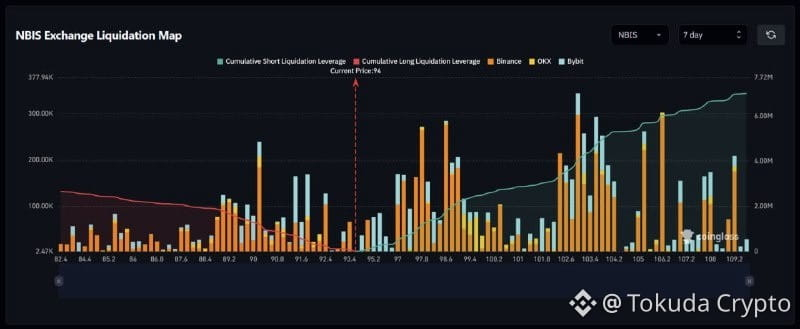
$NBIS – Liquidation Map (7 days) – Index ~94
🧭 Favor a short-liquidation sweep at 94.5–95.4 before an extension toward the larger 97–99 zone. Upside bars gradually increase in size, while longs immediately below price are relatively sparse.
🔺 Breaking and holding above 95.4 would shift focus to 97–99, particularly around 97.8 and 98.6. Holding above 99 would bring smaller clusters at 99.4–100.4 into view.
🎯 The 100.5–102.1 stretch is relatively sparse before the dense short zone at 102.4–104.2, with the largest bar around 103.2. Further clusters sit at 105.2–106.2. A short sweep followed by a drop below 94 would weaken upside continuation.
⚖️ Losing 93.4 without reclaiming it would shift preference toward long-liquidation sweeps at 92.2–92.6, then 91.3–91.9. Holding below 91.3 would put 90.0–90.4 in focus. Reclaiming 94 after a sweep would weaken downside continuation.
#LiquidationMap
$NBIS – Liquidation Map (7 days) – Index ~94
🧭 Favor a short-liquidation sweep at 94.5–95.4 before an extension toward the larger 97–99 zone. Upside bars gradually increase in size, while longs immediately below price are relatively sparse.
🔺 Breaking and holding above 95.4 would shift focus to 97–99, particularly around 97.8 and 98.6. Holding above 99 would bring smaller clusters at 99.4–100.4 into view.
🎯 The 100.5–102.1 stretch is relatively sparse before the dense short zone at 102.4–104.2, with the largest bar around 103.2. Further clusters sit at 105.2–106.2. A short sweep followed by a drop below 94 would weaken upside continuation.
⚖️ Losing 93.4 without reclaiming it would shift preference toward long-liquidation sweeps at 92.2–92.6, then 91.3–91.9. Holding below 91.3 would put 90.0–90.4 in focus. Reclaiming 94 after a sweep would weaken downside continuation.
#LiquidationMap
🧭 Favor a short-liquidation sweep at 94.5–95.4 before an extension toward the larger 97–99 zone. Upside bars gradually increase in size, while longs immediately below price are relatively sparse.
🔺 Breaking and holding above 95.4 would shift focus to 97–99, particularly around 97.8 and 98.6. Holding above 99 would bring smaller clusters at 99.4–100.4 into view.
🎯 The 100.5–102.1 stretch is relatively sparse before the dense short zone at 102.4–104.2, with the largest bar around 103.2. Further clusters sit at 105.2–106.2. A short sweep followed by a drop below 94 would weaken upside continuation.
⚖️ Losing 93.4 without reclaiming it would shift preference toward long-liquidation sweeps at 92.2–92.6, then 91.3–91.9. Holding below 91.3 would put 90.0–90.4 in focus. Reclaiming 94 after a sweep would weaken downside continuation.
#LiquidationMap
7
·
--
Bullish
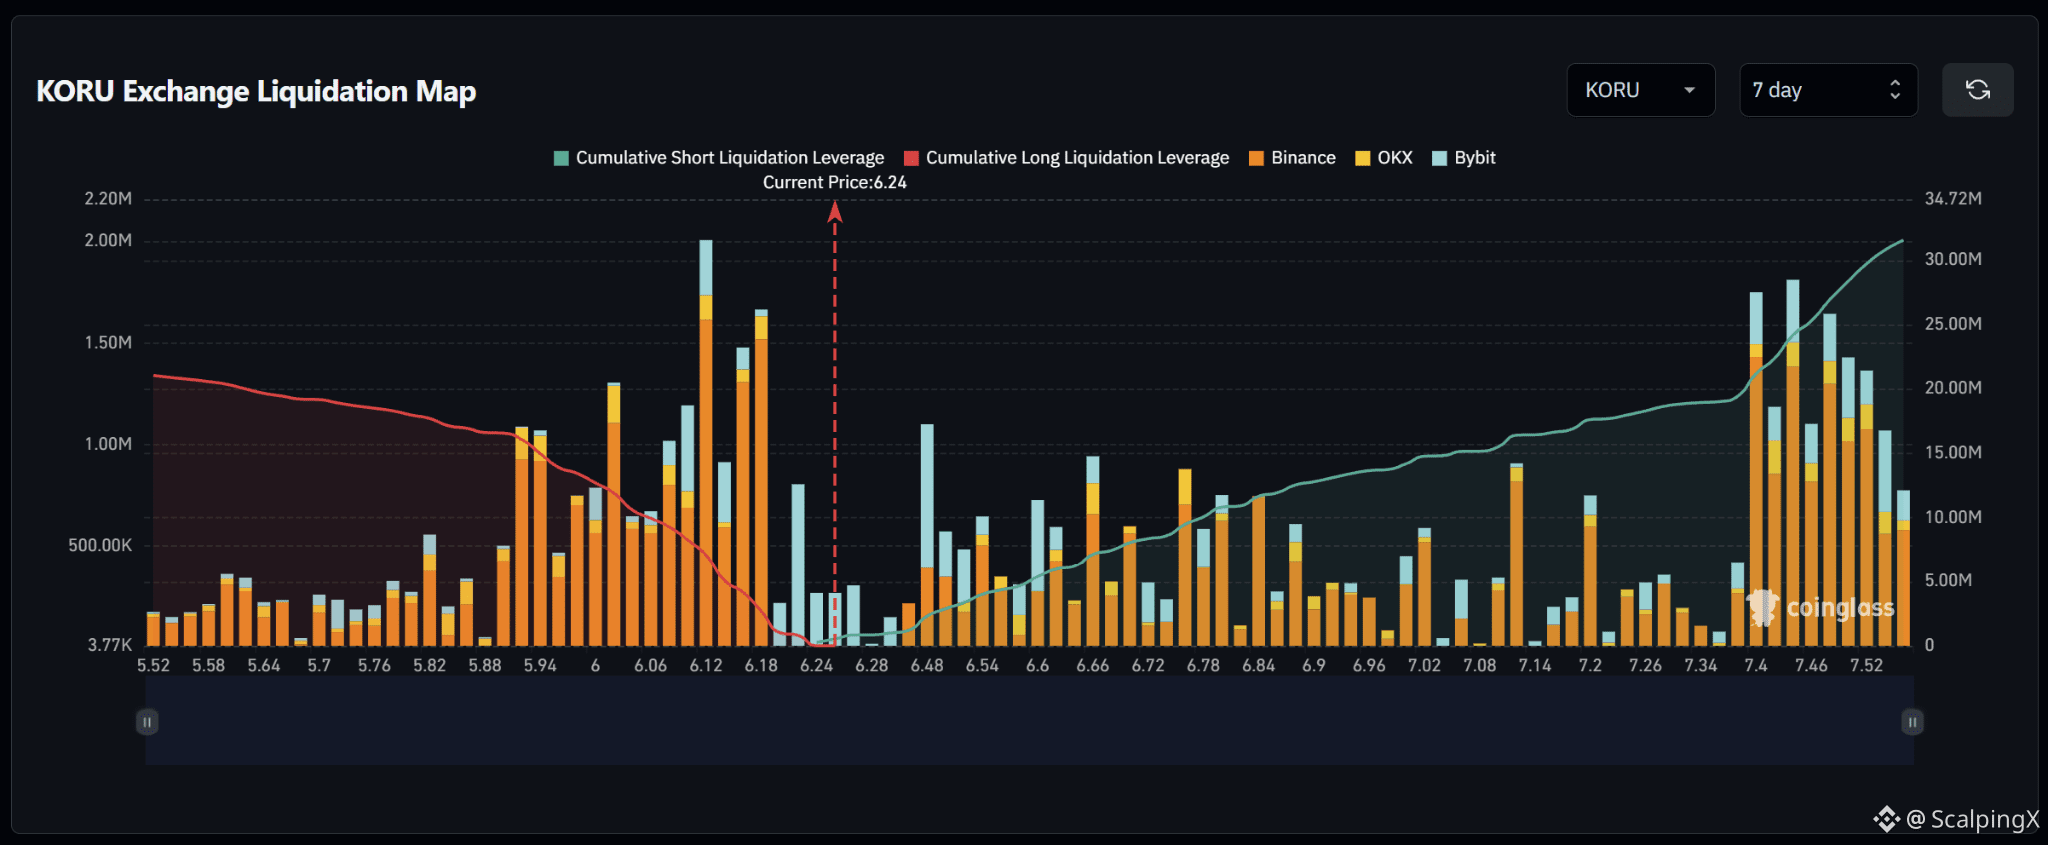
$KORU – Liquidation Map (7 days) – Index ~6.24
🧭 Favor a long-liquidation sweep at 6.18–6.22. Large downside bars sit closer to price than the main short zone at 6.48–6.66, with further long concentrations at 6.10–6.16.
🔻 Losing 6.18 without reclaiming it would shift focus to 6.10–6.16, particularly around 6.12, which contains the largest bar on the map. Holding below 6.10 would bring 6.00–6.08, then 5.92–5.96 into view.
🎯 A long sweep followed by a quick reclaim of 6.24 would weaken downside continuation. Above price, bars are relatively sparse before the large short cluster around 6.48, followed by successive clusters through 6.66.
⚖️ Breaking and holding above 6.48 would shift preference toward short-liquidation sweeps at 6.52–6.66. Holding above 6.66 would put 6.76–6.86 in focus. Further up, 7.40–7.52 contains another concentration of large bars; a short sweep followed by a loss of 6.48 would weaken further upside.
#LiquidationMap
$KORU – Liquidation Map (7 days) – Index ~6.24
🧭 Favor a long-liquidation sweep at 6.18–6.22. Large downside bars sit closer to price than the main short zone at 6.48–6.66, with further long concentrations at 6.10–6.16.
🔻 Losing 6.18 without reclaiming it would shift focus to 6.10–6.16, particularly around 6.12, which contains the largest bar on the map. Holding below 6.10 would bring 6.00–6.08, then 5.92–5.96 into view.
🎯 A long sweep followed by a quick reclaim of 6.24 would weaken downside continuation. Above price, bars are relatively sparse before the large short cluster around 6.48, followed by successive clusters through 6.66.
⚖️ Breaking and holding above 6.48 would shift preference toward short-liquidation sweeps at 6.52–6.66. Holding above 6.66 would put 6.76–6.86 in focus. Further up, 7.40–7.52 contains another concentration of large bars; a short sweep followed by a loss of 6.48 would weaken further upside.
#LiquidationMap
🧭 Favor a long-liquidation sweep at 6.18–6.22. Large downside bars sit closer to price than the main short zone at 6.48–6.66, with further long concentrations at 6.10–6.16.
🔻 Losing 6.18 without reclaiming it would shift focus to 6.10–6.16, particularly around 6.12, which contains the largest bar on the map. Holding below 6.10 would bring 6.00–6.08, then 5.92–5.96 into view.
🎯 A long sweep followed by a quick reclaim of 6.24 would weaken downside continuation. Above price, bars are relatively sparse before the large short cluster around 6.48, followed by successive clusters through 6.66.
⚖️ Breaking and holding above 6.48 would shift preference toward short-liquidation sweeps at 6.52–6.66. Holding above 6.66 would put 6.76–6.86 in focus. Further up, 7.40–7.52 contains another concentration of large bars; a short sweep followed by a loss of 6.48 would weaken further upside.
#LiquidationMap
64
·
--
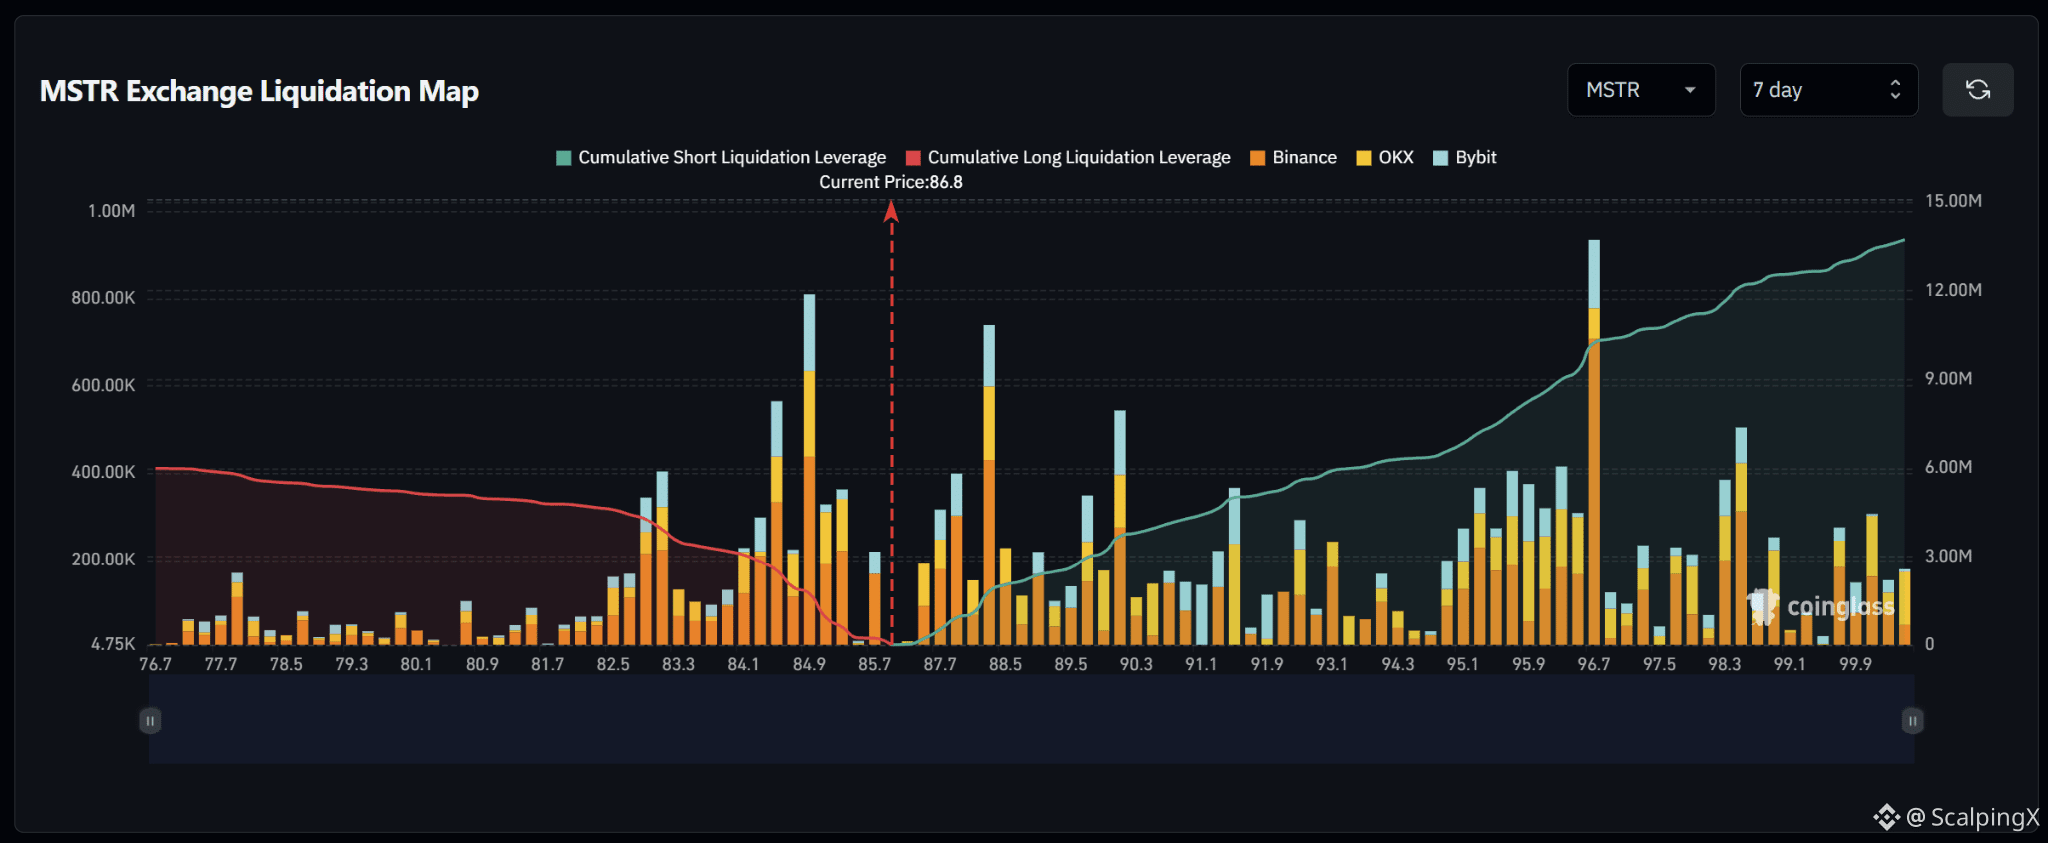
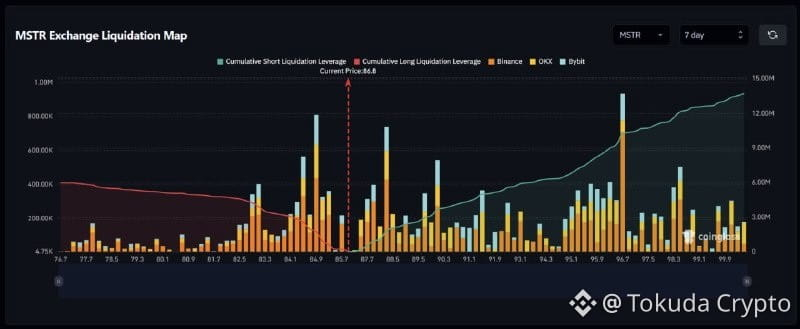
$MSTR – Liquidation Map (7 days) – Index ~86.8
🧭 Favor a short-liquidation sweep at 87.5–88.5, particularly around 88.3. Large bars cluster relatively close above price, while the notable opposing long cluster sits at 85.3–85.7.
🔺 Breaking and holding above 88.5 would shift focus to 89.5–90.2. Holding above 90.2 would bring 91.3–91.7 into view, before liquidation density declines and clusters become more scattered.
🎯 Further up, 95.0–96.7 contains another concentration of large short bars, with the largest bar on the map around 96.7. Sweeping 87.5–88.5 and quickly falling below 86.8 would weaken upside continuation.
⚖️ Losing 85.7 without reclaiming it would shift preference toward a long-liquidation sweep at 84.5–85.3, particularly around 84.9. Holding below 84.5 would put 82.8–83.3 in focus. Reclaiming 86.8 after a sweep would weaken downside continuation.
#LiquidationMap
$MSTR – Liquidation Map (7 days) – Index ~86.8
🧭 Favor a short-liquidation sweep at 87.5–88.5, particularly around 88.3. Large bars cluster relatively close above price, while the notable opposing long cluster sits at 85.3–85.7.
🔺 Breaking and holding above 88.5 would shift focus to 89.5–90.2. Holding above 90.2 would bring 91.3–91.7 into view, before liquidation density declines and clusters become more scattered.
🎯 Further up, 95.0–96.7 contains another concentration of large short bars, with the largest bar on the map around 96.7. Sweeping 87.5–88.5 and quickly falling below 86.8 would weaken upside continuation.
⚖️ Losing 85.7 without reclaiming it would shift preference toward a long-liquidation sweep at 84.5–85.3, particularly around 84.9. Holding below 84.5 would put 82.8–83.3 in focus. Reclaiming 86.8 after a sweep would weaken downside continuation.
#LiquidationMap
🧭 Favor a short-liquidation sweep at 87.5–88.5, particularly around 88.3. Large bars cluster relatively close above price, while the notable opposing long cluster sits at 85.3–85.7.
🔺 Breaking and holding above 88.5 would shift focus to 89.5–90.2. Holding above 90.2 would bring 91.3–91.7 into view, before liquidation density declines and clusters become more scattered.
🎯 Further up, 95.0–96.7 contains another concentration of large short bars, with the largest bar on the map around 96.7. Sweeping 87.5–88.5 and quickly falling below 86.8 would weaken upside continuation.
⚖️ Losing 85.7 without reclaiming it would shift preference toward a long-liquidation sweep at 84.5–85.3, particularly around 84.9. Holding below 84.5 would put 82.8–83.3 in focus. Reclaiming 86.8 after a sweep would weaken downside continuation.
#LiquidationMap
61
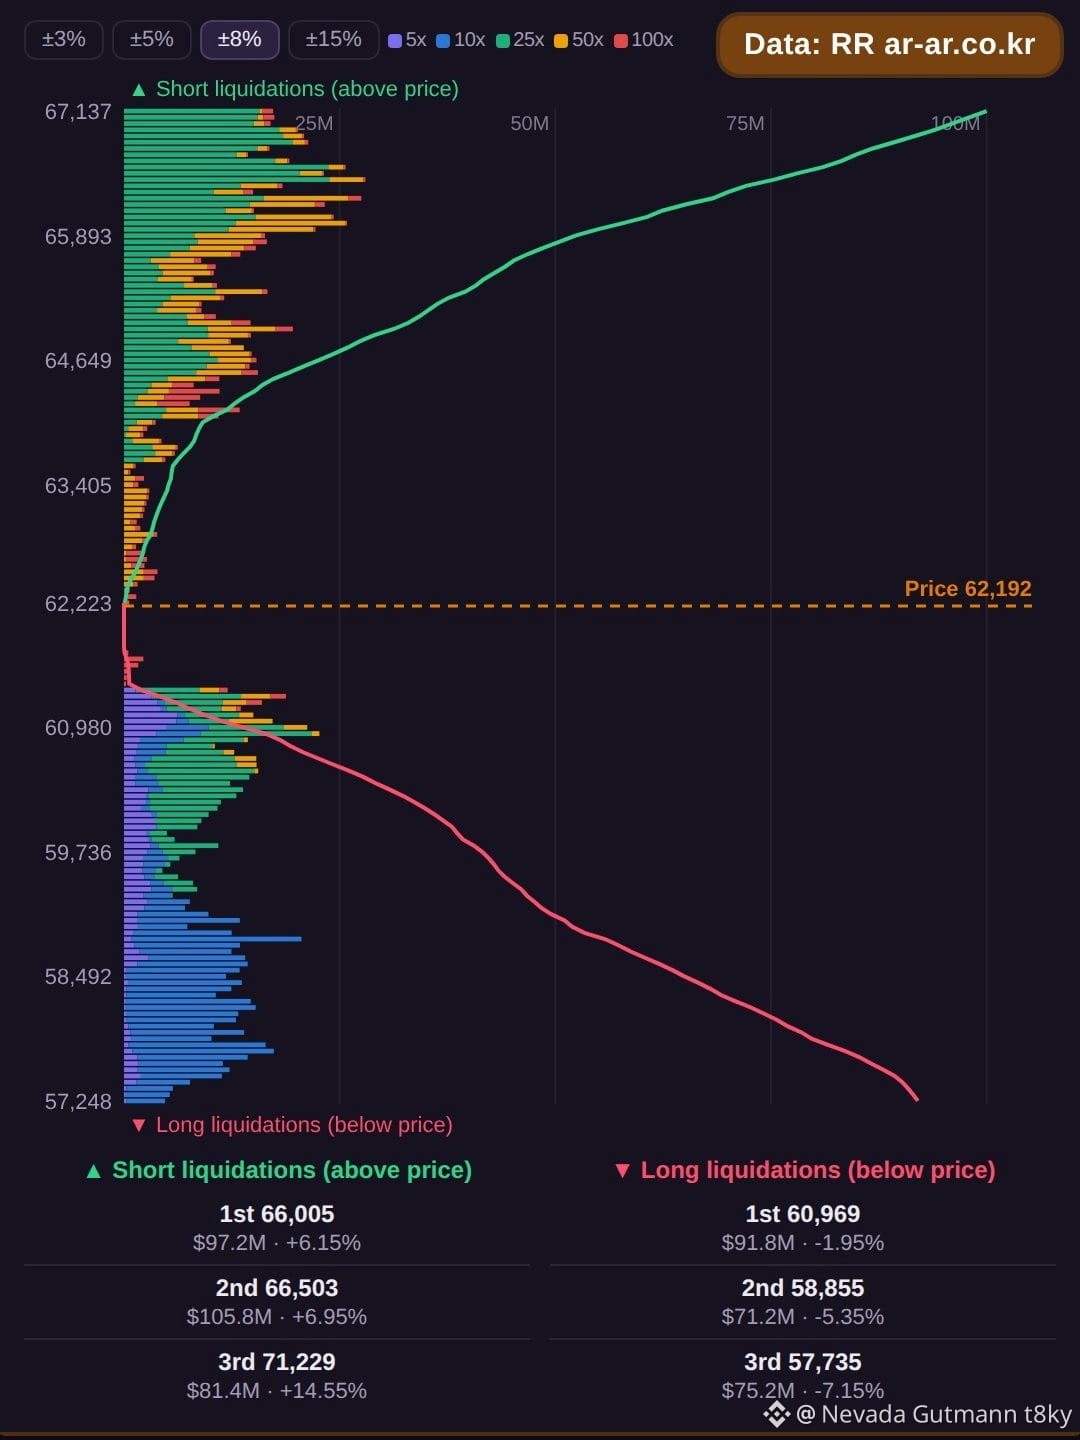
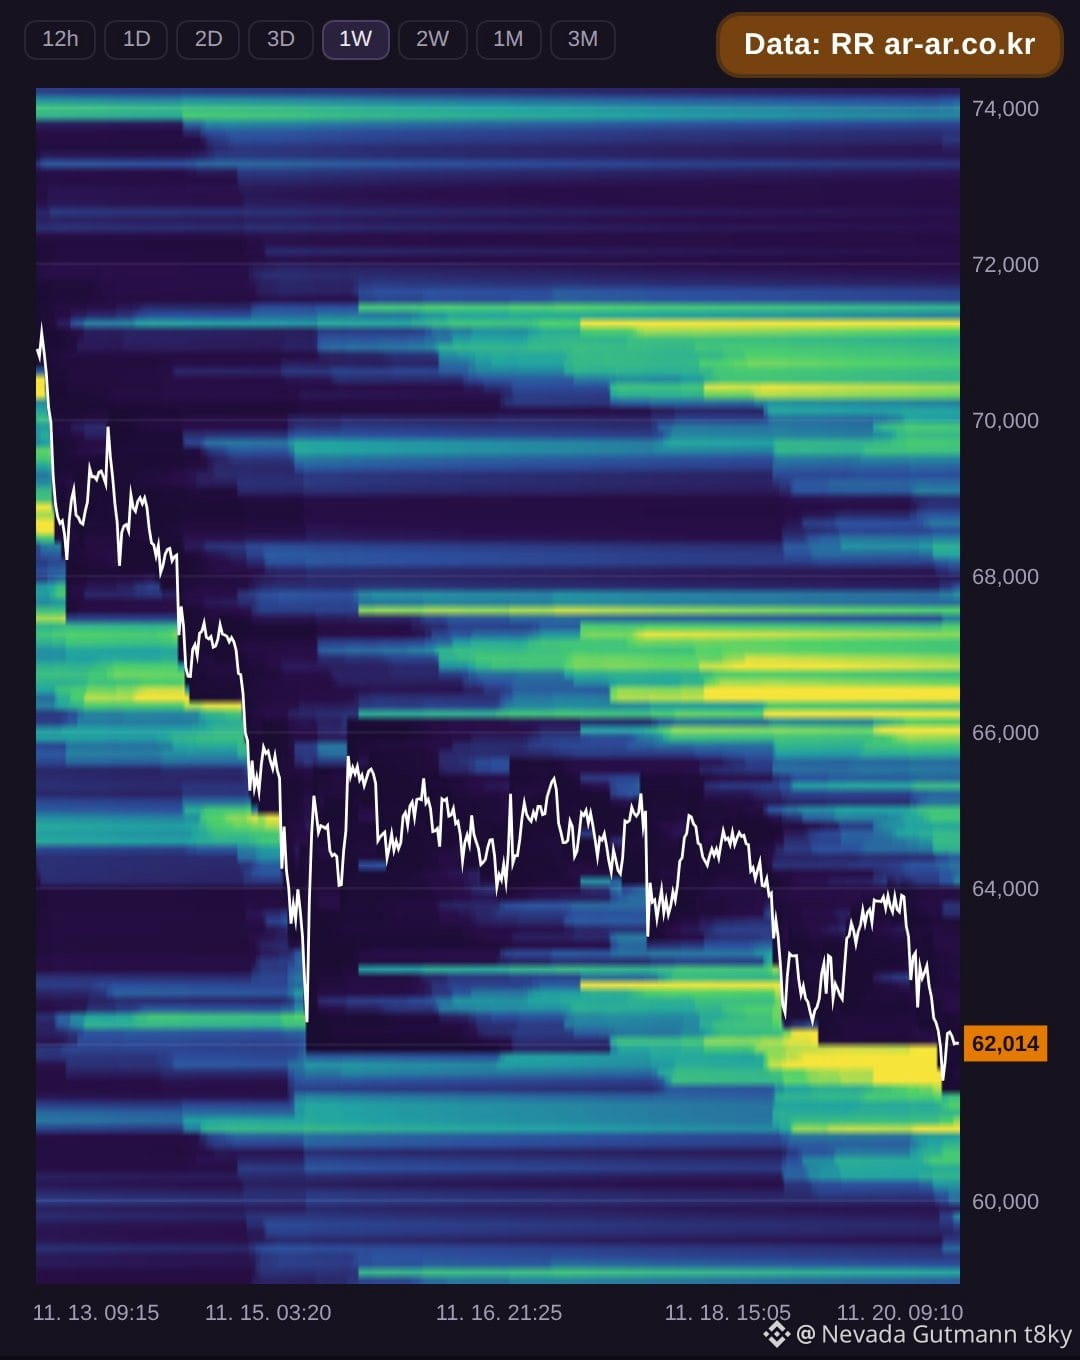
Bitcoin is trading at $62,056 as of 00:30 UTC on Nov 20. The liquidation map shows short positions stacked above current price with significant volume at $65,996 holding about $97.3M, followed by $66,493 with about $104.5M, and $71,209 carrying about $81.8M. Combined, these three short clusters total $283.6M.
Below price, long liquidations sit at $61,280 with about $64.5M, $60,970 holding about $91.7M, and $57,743 with about $74.8M. These three long clusters add up to $231.0M total.
Longs are closer to current price at just -1.25% away, but the larger stack sits on the short side by over fifty million. Traders may watch whether price tests the nearby long levels first or pushes upward toward the heavier short clusters overhead.
Data source: RR (ar-ar.co.kr). Estimated from BTCUSDT futures data. Not financial advice.
#BTC #Bitcoin #LiquidationMap #LiquidationHeatmap
Bitcoin is trading at $62,056 as of 00:30 UTC on Nov 20. The liquidation map shows short positions stacked above current price with significant volume at $65,996 holding about $97.3M, followed by $66,493 with about $104.5M, and $71,209 carrying about $81.8M. Combined, these three short clusters total $283.6M.
Below price, long liquidations sit at $61,280 with about $64.5M, $60,970 holding about $91.7M, and $57,743 with about $74.8M. These three long clusters add up to $231.0M total.
Longs are closer to current price at just -1.25% away, but the larger stack sits on the short side by over fifty million. Traders may watch whether price tests the nearby long levels first or pushes upward toward the heavier short clusters overhead.
Data source: RR (ar-ar.co.kr). Estimated from BTCUSDT futures data. Not financial advice.
#BTC #Bitcoin #LiquidationMap #LiquidationHeatmap
Below price, long liquidations sit at $61,280 with about $64.5M, $60,970 holding about $91.7M, and $57,743 with about $74.8M. These three long clusters add up to $231.0M total.
Longs are closer to current price at just -1.25% away, but the larger stack sits on the short side by over fifty million. Traders may watch whether price tests the nearby long levels first or pushes upward toward the heavier short clusters overhead.
Data source: RR (ar-ar.co.kr). Estimated from BTCUSDT futures data. Not financial advice.
#BTC #Bitcoin #LiquidationMap #LiquidationHeatmap
99

·
--
Bullish
🚨 $EVAA : SHORT LIQUIDITY IS BUILDING ABOVE!
$EVAA has made a strong rally, but the liquidation map is revealing an interesting opportunity.
Here's what the liquidity data shows:
🔴 Short Liquidation Zone
$5.28 — Around $1.5M
Short Magnet Strength: 20.9
🟢 Long Liquidation Zones
$4.91 — Around $1.3M
$4.61 — Around $1.1M
Long Magnet Strength: 9.6
What's Next for $EVAA?
After this sharp rally, the market could move in either direction.
If bullish momentum continues, $EVAA could push toward $5.28 to sweep short liquidity.
However, if buying pressure weakens, price could pull back toward $4.91 or even $4.61 to test long liquidity.
My Focus: Watch how price reacts around these key liquidity zones before taking a position.
Which comes first — $5.28 or a pullback to $4.91?
#EVAA #Crypto #LiquidationMap #Trading #Binance
🚨 $EVAA : SHORT LIQUIDITY IS BUILDING ABOVE!
$EVAA has made a strong rally, but the liquidation map is revealing an interesting opportunity.
Here's what the liquidity data shows:
🔴 Short Liquidation Zone
$5.28 — Around $1.5M
Short Magnet Strength: 20.9
🟢 Long Liquidation Zones
$4.91 — Around $1.3M
$4.61 — Around $1.1M
Long Magnet Strength: 9.6
What's Next for $EVAA ?
After this sharp rally, the market could move in either direction.
If bullish momentum continues, $EVAA could push toward $5.28 to sweep short liquidity.
However, if buying pressure weakens, price could pull back toward $4.91 or even $4.61 to test long liquidity.
My Focus: Watch how price reacts around these key liquidity zones before taking a position.
Which comes first — $5.28 or a pullback to $4.91?
#EVAA #Crypto #LiquidationMap #Trading #Binance
$EVAA has made a strong rally, but the liquidation map is revealing an interesting opportunity.
Here's what the liquidity data shows:
🔴 Short Liquidation Zone
$5.28 — Around $1.5M
Short Magnet Strength: 20.9
🟢 Long Liquidation Zones
$4.91 — Around $1.3M
$4.61 — Around $1.1M
Long Magnet Strength: 9.6
What's Next for $EVAA ?
After this sharp rally, the market could move in either direction.
If bullish momentum continues, $EVAA could push toward $5.28 to sweep short liquidity.
However, if buying pressure weakens, price could pull back toward $4.91 or even $4.61 to test long liquidity.
My Focus: Watch how price reacts around these key liquidity zones before taking a position.
Which comes first — $5.28 or a pullback to $4.91?
#EVAA #Crypto #LiquidationMap #Trading #Binance
28

Bản đồ thanh lý 7 ngày của $DOT (Index ~0.646) đang phát tín hiệu cực gắt! Cửa quét short ưu tiên mở ra ở 0.648–0.657, với lực nén mạnh tại 0.650 và 0.653. Nếu vượt 0.657, đường lên 0.674–0.686 sẽ rộng mở. Ngược lại, thủng 0.646 sẽ kích hoạt chiến dịch hốt long quanh 0.635–0.644.
Theo anh em, phe nào sẽ bị "cắt tiết" trước ở mốc này?
#DOT #BinanceSquare #CryptoTrading #LiquidationMap
Bản đồ thanh lý 7 ngày của $DOT (Index ~0.646) đang phát tín hiệu cực gắt! Cửa quét short ưu tiên mở ra ở 0.648–0.657, với lực nén mạnh tại 0.650 và 0.653. Nếu vượt 0.657, đường lên 0.674–0.686 sẽ rộng mở. Ngược lại, thủng 0.646 sẽ kích hoạt chiến dịch hốt long quanh 0.635–0.644.
Theo anh em, phe nào sẽ bị "cắt tiết" trước ở mốc này?
#DOT #BinanceSquare #CryptoTrading #LiquidationMap
Theo anh em, phe nào sẽ bị "cắt tiết" trước ở mốc này?
#DOT #BinanceSquare #CryptoTrading #LiquidationMap
4
Bản đồ thanh lý 7 ngày của $ONDO (Index ~0.276) đang phát tín hiệu gì? Cửa sáng lúc này là quét short vùng 0.281–0.287, mạnh nhất quanh 0.284–0.286. Nếu vượt 0.287, mốc 0.294–0.304 sẽ trong tầm ngắm. Ngược lại, thủng 0.276 dễ kích hoạt quét long tại 0.270–0.274.
Theo anh em, bò $ONDO có đủ lực vượt kháng cự để hướng lên 0.315 không?
#ONDO #BinanceSquare #CryptoTrading #LiquidationMap
Bản đồ thanh lý 7 ngày của $ONDO (Index ~0.276) đang phát tín hiệu gì? Cửa sáng lúc này là quét short vùng 0.281–0.287, mạnh nhất quanh 0.284–0.286. Nếu vượt 0.287, mốc 0.294–0.304 sẽ trong tầm ngắm. Ngược lại, thủng 0.276 dễ kích hoạt quét long tại 0.270–0.274.
Theo anh em, bò $ONDO có đủ lực vượt kháng cự để hướng lên 0.315 không?
#ONDO #BinanceSquare #CryptoTrading #LiquidationMap
Theo anh em, bò $ONDO có đủ lực vượt kháng cự để hướng lên 0.315 không?
#ONDO #BinanceSquare #CryptoTrading #LiquidationMap
22
·
--
Bullish
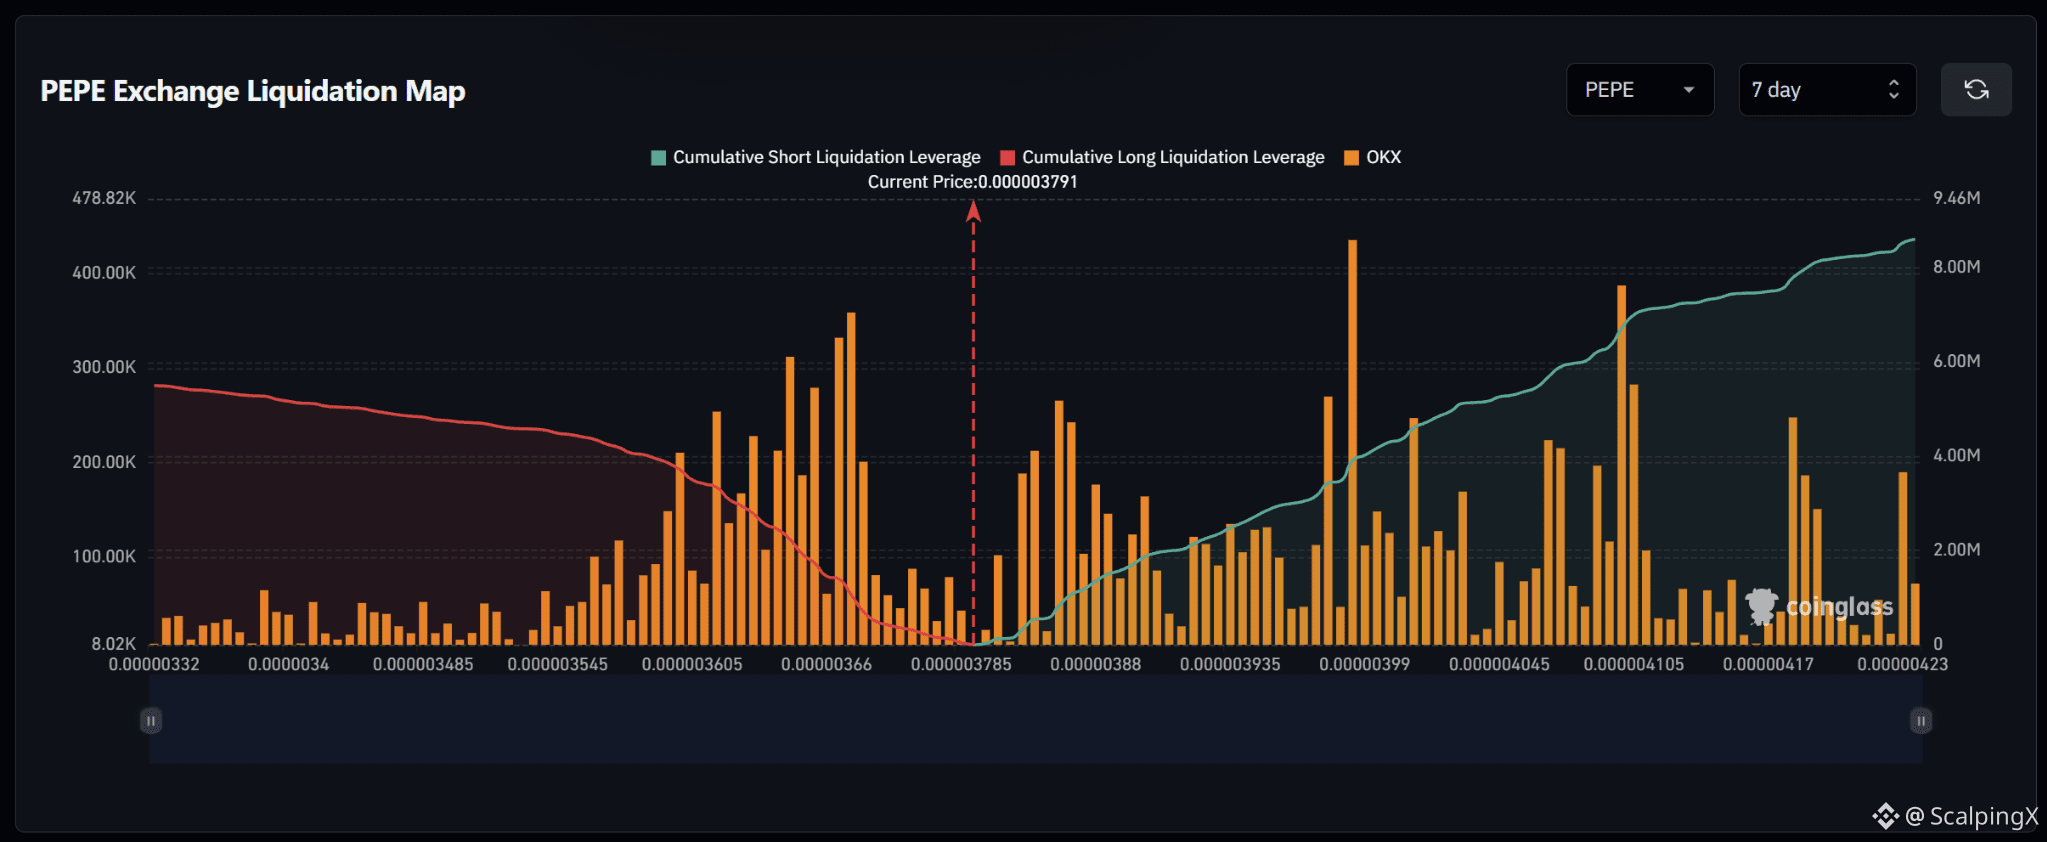
$PEPE – Liquidation Map (7 days) – Index ~0.000003791
🧭 Favor a short-liquidation sweep at 0.00000382–0.00000388. Nearby upside bars are larger than the long cluster immediately below at 0.00000376–0.00000378.
🔺 Breaking and holding above 0.00000388 would shift focus to 0.00000393–0.00000400. The largest short bar on the map stands out around 0.00000398.
🎯 Holding above 0.00000400 would bring 0.00000408–0.00000411 into view. The 0.00000412–0.00000416 stretch is sparse before 0.00000418–0.00000419. A short sweep followed by a drop below 0.000003791 would weaken upside continuation.
⚖️ Losing 0.000003785 without reclaiming it would shift preference toward long-liquidation sweeps at 0.00000374–0.00000377. Holding below 0.00000374 would put the larger 0.00000365–0.00000370 zone in focus; reclaiming 0.000003791 after a sweep would weaken downside continuation.
#LiquidationMap
$PEPE – Liquidation Map (7 days) – Index ~0.000003791
🧭 Favor a short-liquidation sweep at 0.00000382–0.00000388. Nearby upside bars are larger than the long cluster immediately below at 0.00000376–0.00000378.
🔺 Breaking and holding above 0.00000388 would shift focus to 0.00000393–0.00000400. The largest short bar on the map stands out around 0.00000398.
🎯 Holding above 0.00000400 would bring 0.00000408–0.00000411 into view. The 0.00000412–0.00000416 stretch is sparse before 0.00000418–0.00000419. A short sweep followed by a drop below 0.000003791 would weaken upside continuation.
⚖️ Losing 0.000003785 without reclaiming it would shift preference toward long-liquidation sweeps at 0.00000374–0.00000377. Holding below 0.00000374 would put the larger 0.00000365–0.00000370 zone in focus; reclaiming 0.000003791 after a sweep would weaken downside continuation.
#LiquidationMap
🧭 Favor a short-liquidation sweep at 0.00000382–0.00000388. Nearby upside bars are larger than the long cluster immediately below at 0.00000376–0.00000378.
🔺 Breaking and holding above 0.00000388 would shift focus to 0.00000393–0.00000400. The largest short bar on the map stands out around 0.00000398.
🎯 Holding above 0.00000400 would bring 0.00000408–0.00000411 into view. The 0.00000412–0.00000416 stretch is sparse before 0.00000418–0.00000419. A short sweep followed by a drop below 0.000003791 would weaken upside continuation.
⚖️ Losing 0.000003785 without reclaiming it would shift preference toward long-liquidation sweeps at 0.00000374–0.00000377. Holding below 0.00000374 would put the larger 0.00000365–0.00000370 zone in focus; reclaiming 0.000003791 after a sweep would weaken downside continuation.
#LiquidationMap
17
Cẩn thận bẫy thanh lý $XLM! Với Index quanh 0.1339, phe short đang nằm trong tầm ngắm vùng 0.1347–0.1357. Nếu phá vỡ 0.1357, đường lên 0.1403 và đỉnh 0.1429 hoàn toàn khả thi. Ngược lại, mất mốc 0.1333 sẽ kích hoạt cú quét long về 0.1311–0.1315. Theo bạn, cá mập sẽ gom lệnh ở đâu trước?
#XLM #BinanceSquare #CryptoTrading #LiquidationMap
Cẩn thận bẫy thanh lý $XLM ! Với Index quanh 0.1339, phe short đang nằm trong tầm ngắm vùng 0.1347–0.1357. Nếu phá vỡ 0.1357, đường lên 0.1403 và đỉnh 0.1429 hoàn toàn khả thi. Ngược lại, mất mốc 0.1333 sẽ kích hoạt cú quét long về 0.1311–0.1315. Theo bạn, cá mập sẽ gom lệnh ở đâu trước?
#XLM #BinanceSquare #CryptoTrading #LiquidationMap
#XLM #BinanceSquare #CryptoTrading #LiquidationMap
23
Cẩn thận bẫy thanh lý $NBIS! Bản đồ nhiệt 7 ngày chỉ số ~94 đang lộ rõ kịch bản quét short vùng 94.5–95.4 trước khi với tới 97–99. Xa hơn, cụm short khủng nhất chờ sẵn ở 103.2. Ngược lại, thủng 93.4 cẩn thận hạm đội long dạt về 90.0–90.4.
Theo anh em, bò hay gấu sẽ bị "vặt lông" trước ở nhịp này?
#NBIS #BinanceSquare #CryptoTrading #LiquidationMap
Cẩn thận bẫy thanh lý $NBIS ! Bản đồ nhiệt 7 ngày chỉ số ~94 đang lộ rõ kịch bản quét short vùng 94.5–95.4 trước khi với tới 97–99. Xa hơn, cụm short khủng nhất chờ sẵn ở 103.2. Ngược lại, thủng 93.4 cẩn thận hạm đội long dạt về 90.0–90.4.
Theo anh em, bò hay gấu sẽ bị "vặt lông" trước ở nhịp này?
#NBIS #BinanceSquare #CryptoTrading #LiquidationMap
Theo anh em, bò hay gấu sẽ bị "vặt lông" trước ở nhịp này?
#NBIS #BinanceSquare #CryptoTrading #LiquidationMap
2
·
--
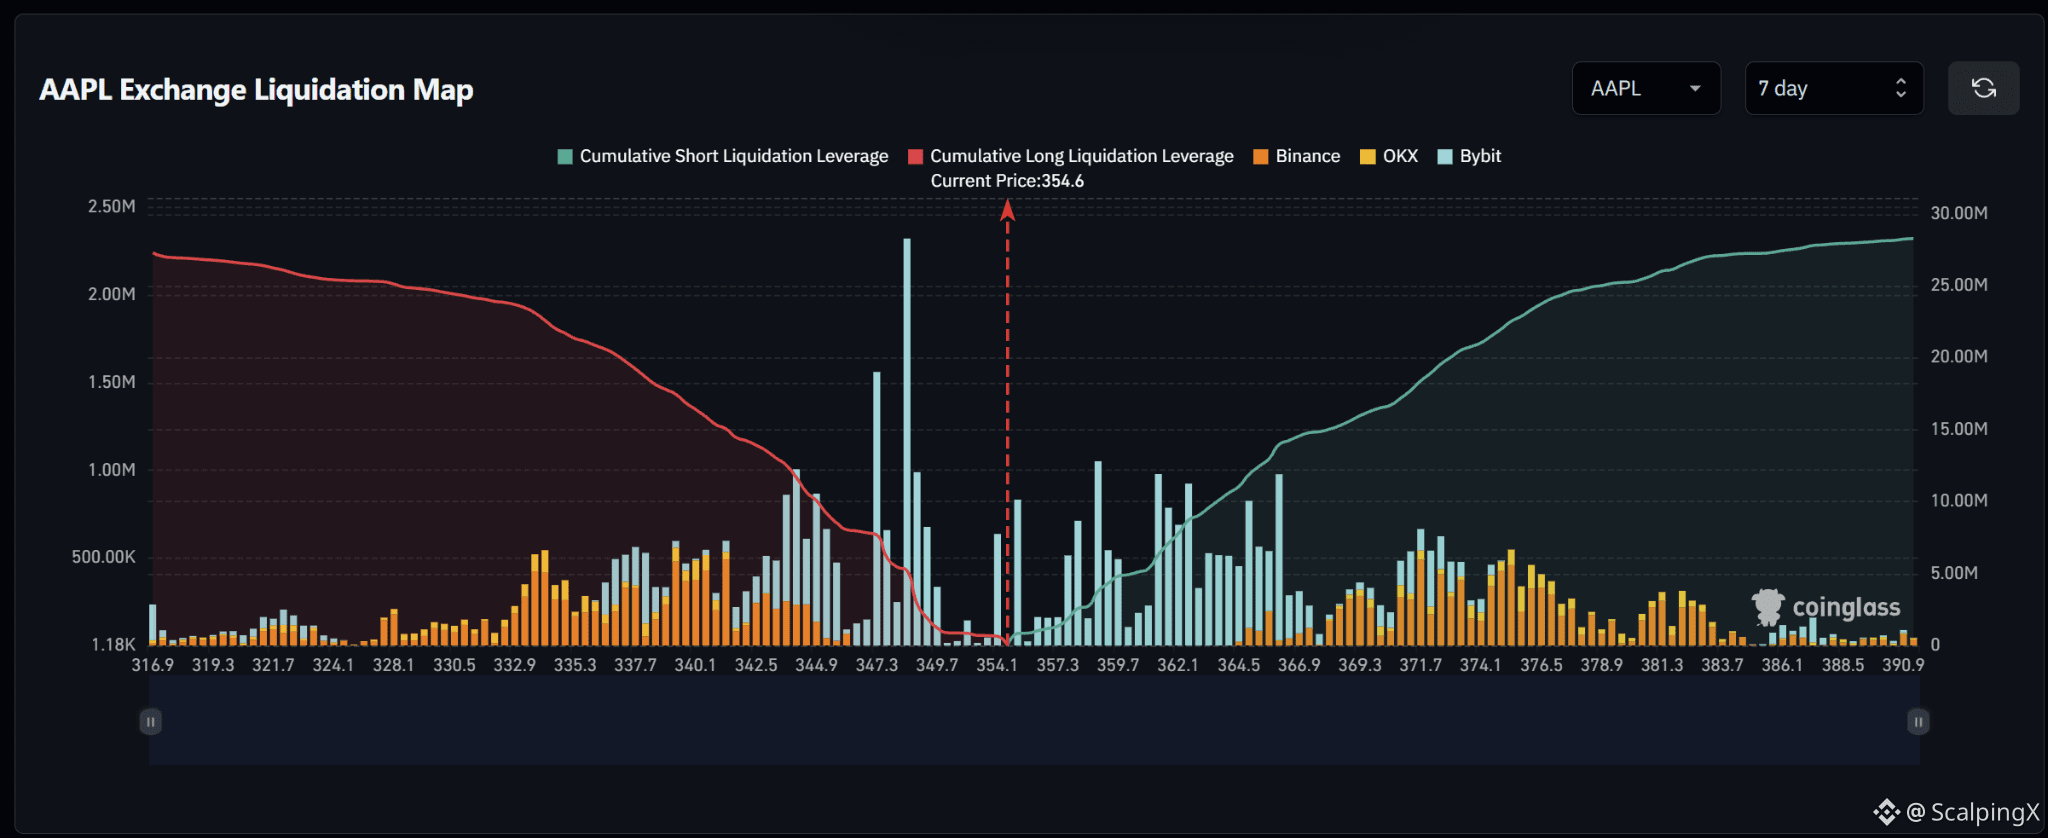
$AAPL – Liquidation Map (7 days) – Index ~354.6
🧭 Favor a short-liquidation sweep at 355–359. Large bars sit relatively close above price, while the most prominent long cluster lies further below at 347–349.
🔺 Breaking and holding above 359 would shift focus to 361–363, then 364.5–366.0. These short zones contain several consecutive large bars, making price retention after each sweep relevant.
🎯 Holding above 366 would bring 370.5–372.5, then 374–377 into view. Liquidation density drops noticeably above 384. Sweeping the initial clusters and quickly falling below 354.6 would weaken upside continuation.
⚖️ Losing 354.1 without reclaiming it would shift preference toward long liquidations at 347–349, with a relatively sparse stretch at 350–353. This zone contains the largest long bar, around 348.5. Holding below 347 would put 344–345.5 in focus; reclaiming 354.6 after a sweep would weaken downside continuation.
#LiquidationMap
$AAPL – Liquidation Map (7 days) – Index ~354.6
🧭 Favor a short-liquidation sweep at 355–359. Large bars sit relatively close above price, while the most prominent long cluster lies further below at 347–349.
🔺 Breaking and holding above 359 would shift focus to 361–363, then 364.5–366.0. These short zones contain several consecutive large bars, making price retention after each sweep relevant.
🎯 Holding above 366 would bring 370.5–372.5, then 374–377 into view. Liquidation density drops noticeably above 384. Sweeping the initial clusters and quickly falling below 354.6 would weaken upside continuation.
⚖️ Losing 354.1 without reclaiming it would shift preference toward long liquidations at 347–349, with a relatively sparse stretch at 350–353. This zone contains the largest long bar, around 348.5. Holding below 347 would put 344–345.5 in focus; reclaiming 354.6 after a sweep would weaken downside continuation.
#LiquidationMap
🧭 Favor a short-liquidation sweep at 355–359. Large bars sit relatively close above price, while the most prominent long cluster lies further below at 347–349.
🔺 Breaking and holding above 359 would shift focus to 361–363, then 364.5–366.0. These short zones contain several consecutive large bars, making price retention after each sweep relevant.
🎯 Holding above 366 would bring 370.5–372.5, then 374–377 into view. Liquidation density drops noticeably above 384. Sweeping the initial clusters and quickly falling below 354.6 would weaken upside continuation.
⚖️ Losing 354.1 without reclaiming it would shift preference toward long liquidations at 347–349, with a relatively sparse stretch at 350–353. This zone contains the largest long bar, around 348.5. Holding below 347 would put 344–345.5 in focus; reclaiming 354.6 after a sweep would weaken downside continuation.
#LiquidationMap
13
·
--
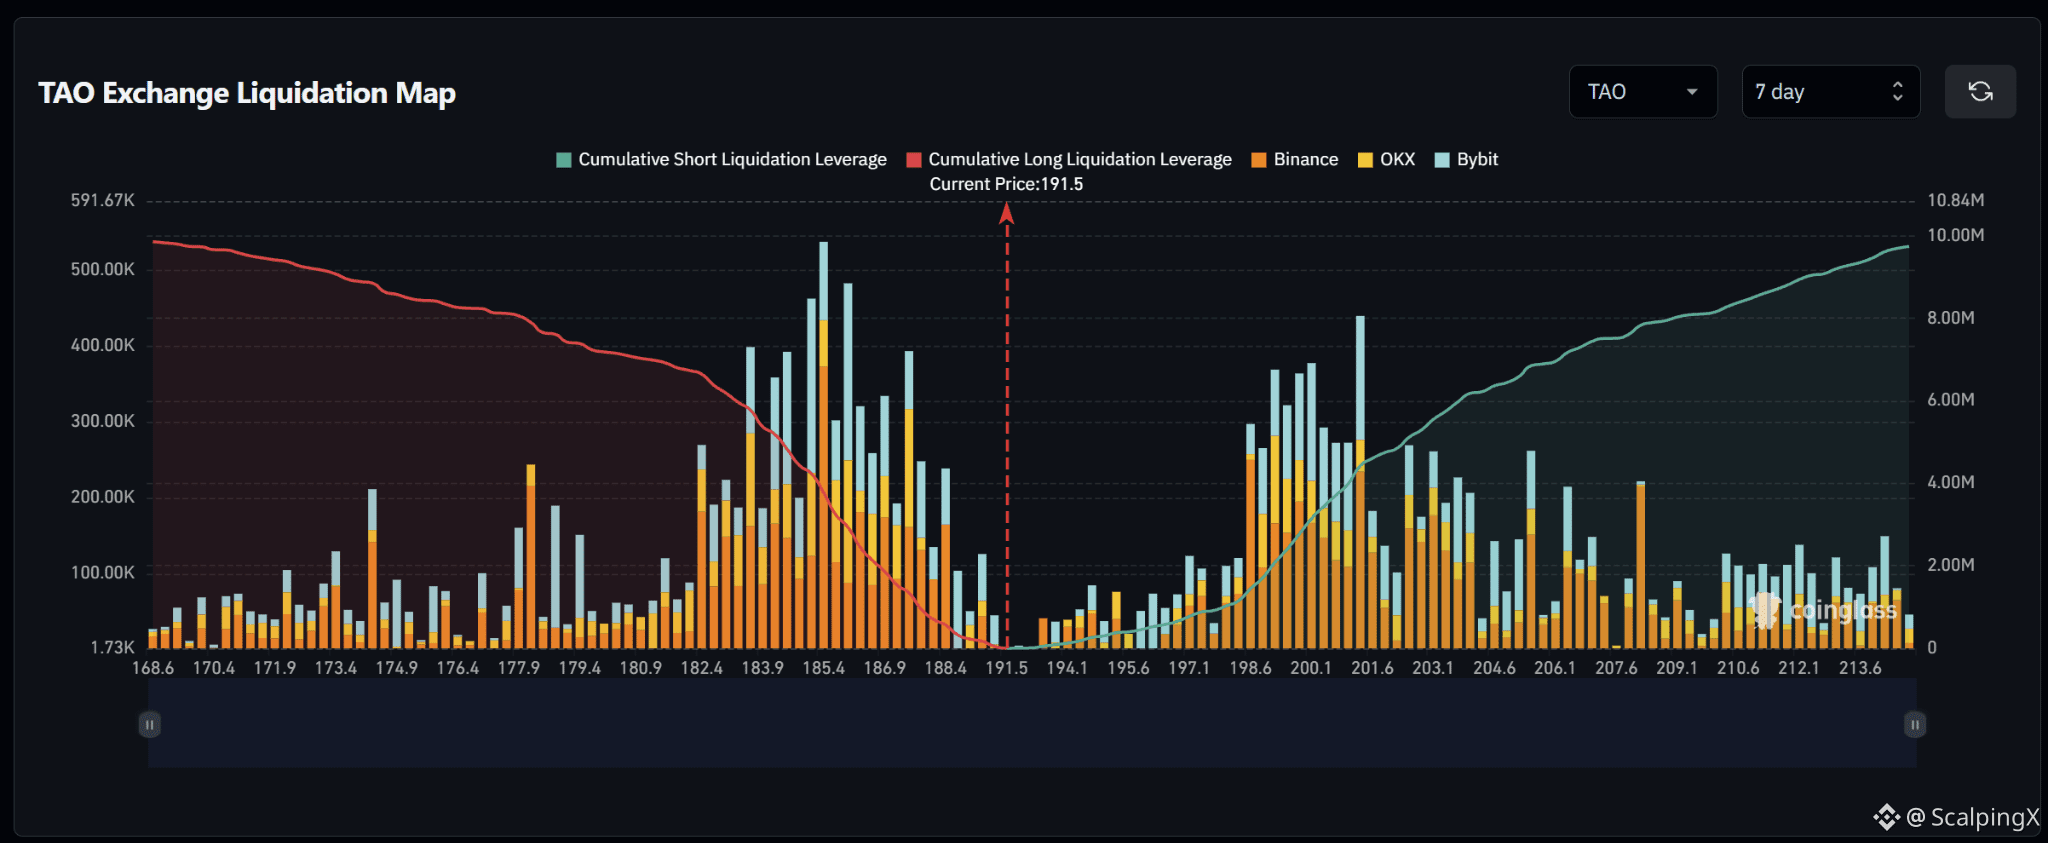
$TAO – Liquidation Map (7 days) – Index ~191.5
🧭 Favor a long-liquidation sweep at 188.4–190.5. Downside clusters sit closer to price than the major short zone at 198.6–201.6, while cumulative exposure is relatively balanced between the two sides.
🔻 Losing 188.4 without reclaiming it would shift focus to 186.0–187.5, then 184.0–185.8. The latter contains several large bars, particularly around 185.4. Holding below 184.0 would bring 182.4–183.4 into view.
🎯 A long sweep followed by a quick reclaim of 191.5 would weaken downside continuation. Above price, 192–196.5 is relatively sparse, with short bars starting to increase around 197.
⚖️ Breaking and holding above 197.5 would shift preference toward a short-liquidation sweep at 198.6–201.6, particularly around 199–200 and 201.3. Holding above 201.6 would put 202.5–204.0 in focus, followed by scattered clusters at 206.1–208.3.
#LiquidationMap
$TAO – Liquidation Map (7 days) – Index ~191.5
🧭 Favor a long-liquidation sweep at 188.4–190.5. Downside clusters sit closer to price than the major short zone at 198.6–201.6, while cumulative exposure is relatively balanced between the two sides.
🔻 Losing 188.4 without reclaiming it would shift focus to 186.0–187.5, then 184.0–185.8. The latter contains several large bars, particularly around 185.4. Holding below 184.0 would bring 182.4–183.4 into view.
🎯 A long sweep followed by a quick reclaim of 191.5 would weaken downside continuation. Above price, 192–196.5 is relatively sparse, with short bars starting to increase around 197.
⚖️ Breaking and holding above 197.5 would shift preference toward a short-liquidation sweep at 198.6–201.6, particularly around 199–200 and 201.3. Holding above 201.6 would put 202.5–204.0 in focus, followed by scattered clusters at 206.1–208.3.
#LiquidationMap
🧭 Favor a long-liquidation sweep at 188.4–190.5. Downside clusters sit closer to price than the major short zone at 198.6–201.6, while cumulative exposure is relatively balanced between the two sides.
🔻 Losing 188.4 without reclaiming it would shift focus to 186.0–187.5, then 184.0–185.8. The latter contains several large bars, particularly around 185.4. Holding below 184.0 would bring 182.4–183.4 into view.
🎯 A long sweep followed by a quick reclaim of 191.5 would weaken downside continuation. Above price, 192–196.5 is relatively sparse, with short bars starting to increase around 197.
⚖️ Breaking and holding above 197.5 would shift preference toward a short-liquidation sweep at 198.6–201.6, particularly around 199–200 and 201.3. Holding above 201.6 would put 202.5–204.0 in focus, followed by scattered clusters at 206.1–208.3.
#LiquidationMap
1
28

·
--
Bearish
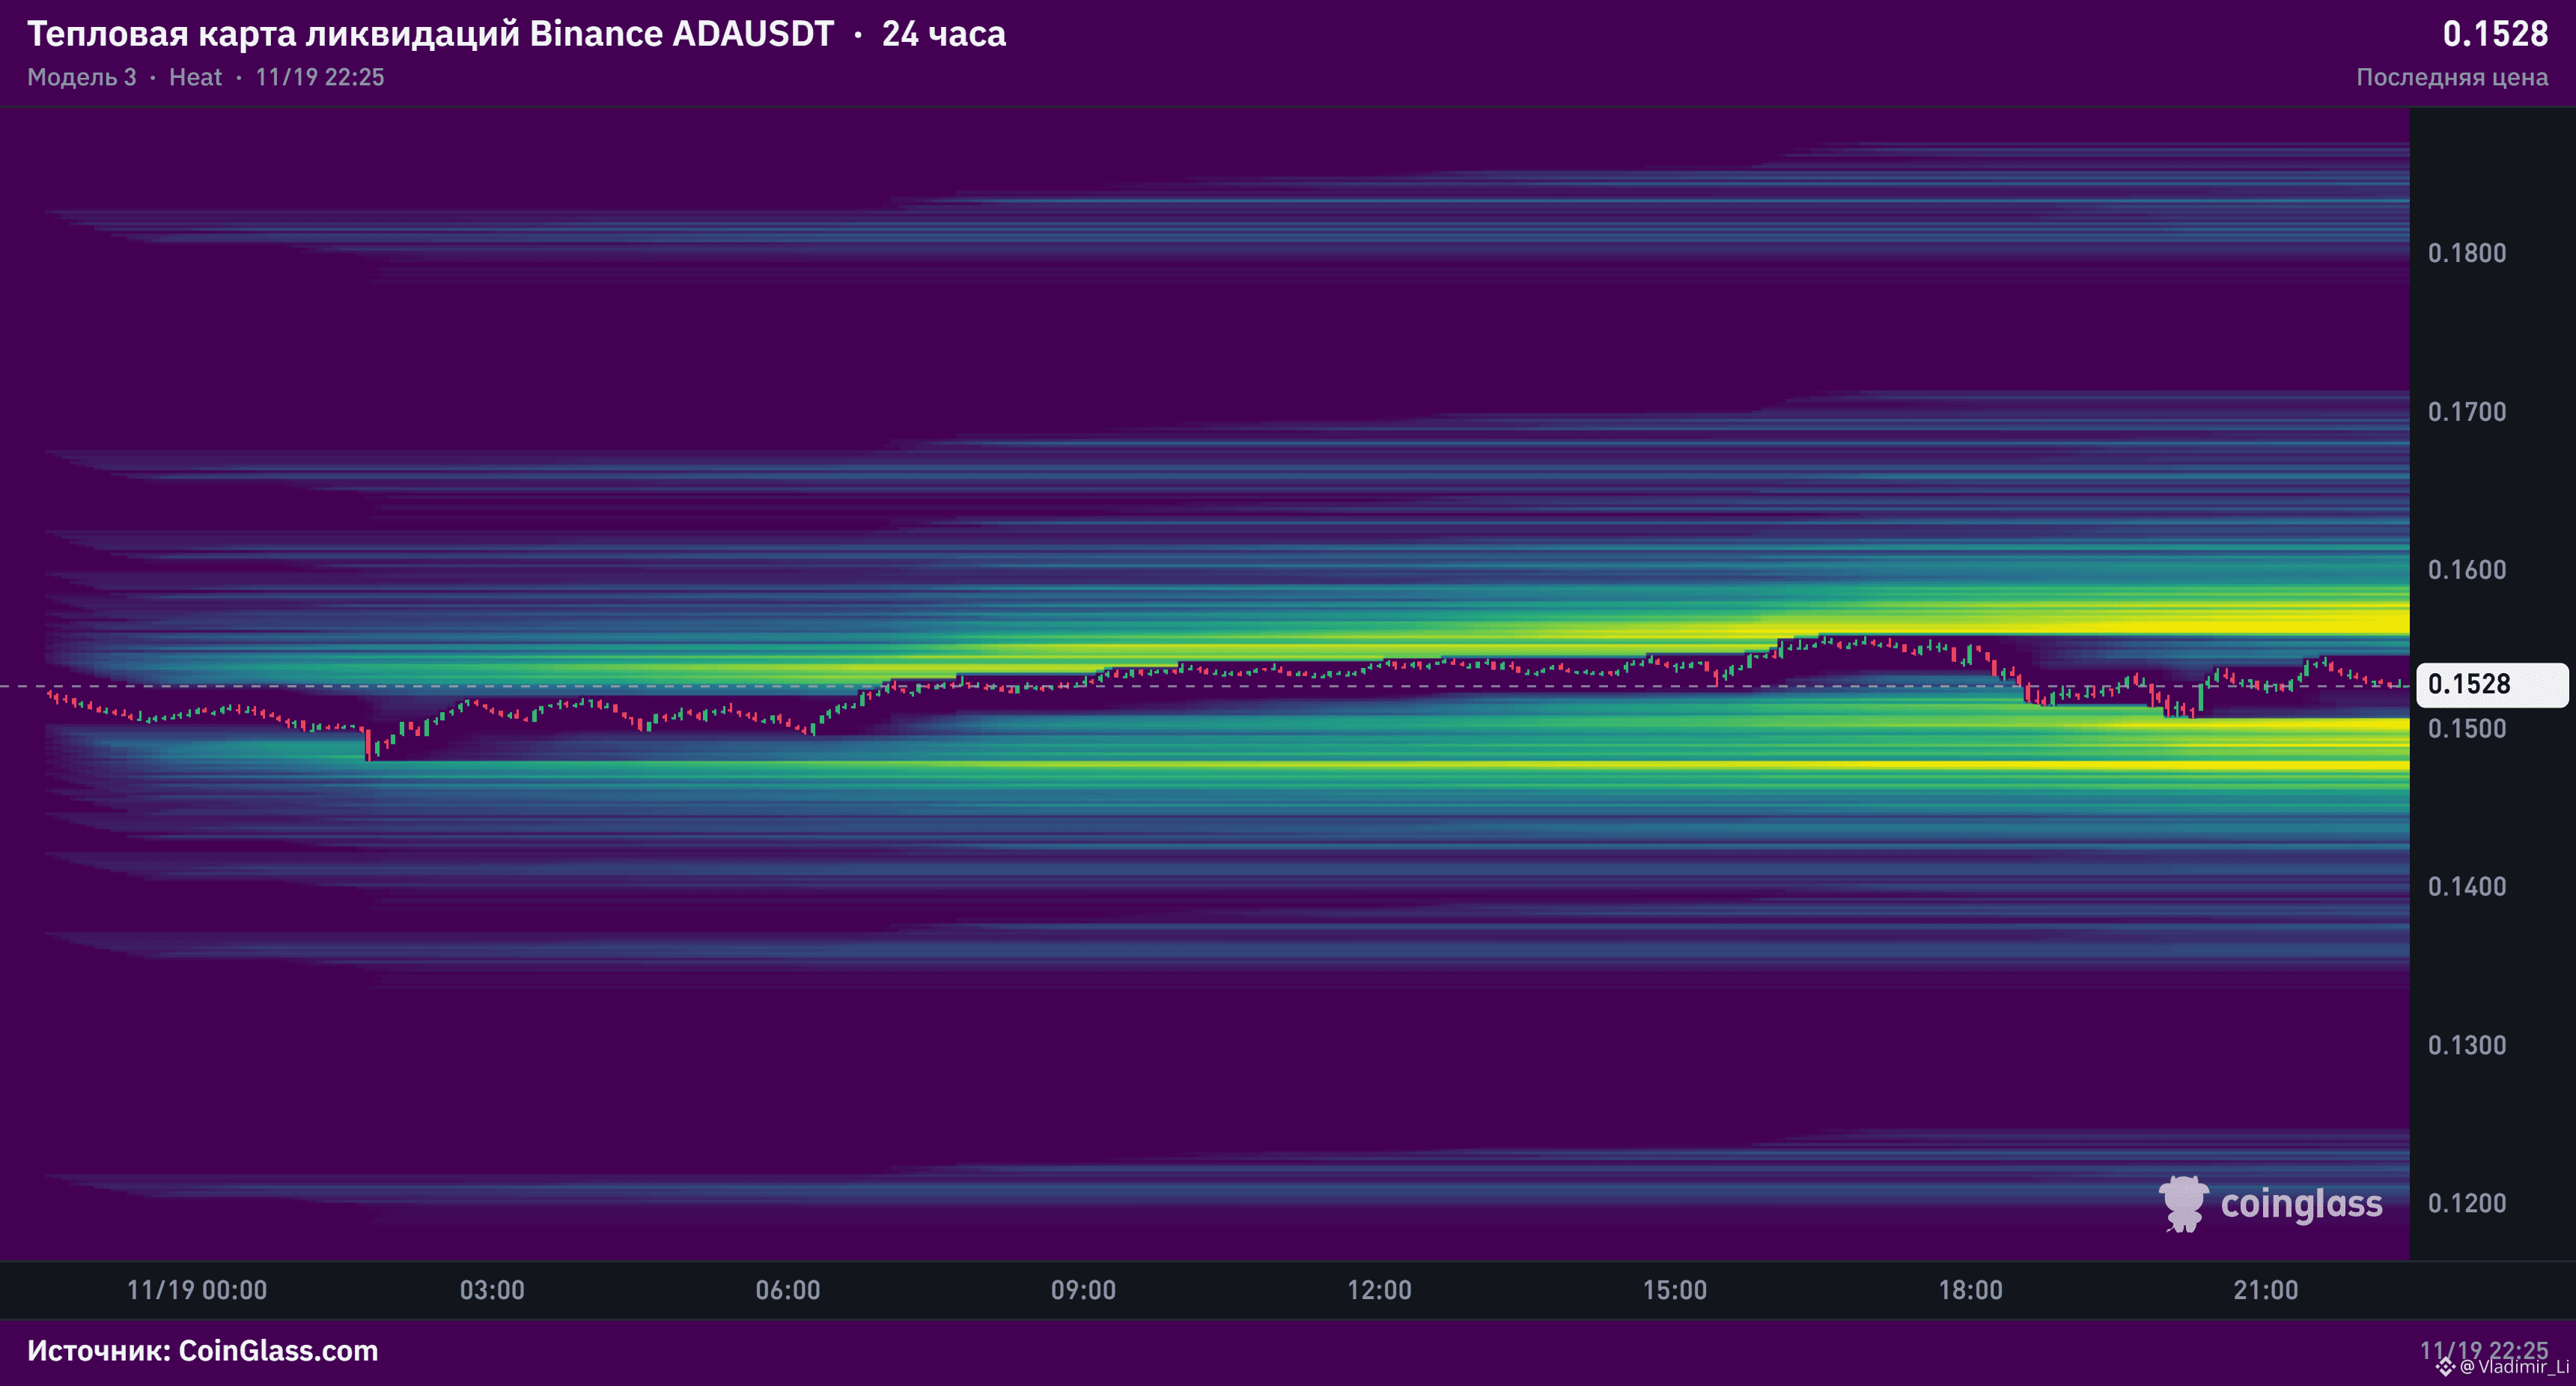
🧲 $ADA готовится к жесткому проливу за стопами лонгистов на $0.1480!
Цена ($0.1528) не удержала локальный рост, откатилась под середину диапазона и сейчас давит прямо на нижнюю границу. Покупатели слабеют, а снизу накопился огромный пул ликвидности. (Примечание: точный объем в $M на скриншоте не виден, оцениваем по максимальной яркости кластеров).
🔺 Сверху ($0.1560–$0.1580): плотный кластер ликвидаций шортистов, до которого цене сейчас не хватает сил дотянуться.
🔻 Снизу ($0.1480–$0.1500): жирный магнит стопов лонгистов прямо под круглой психологической отметкой $0.1500.
Прогноз и план:
Жду сквиз вниз — маркетмейкеру гораздо проще и быстрее забрать близкие стопы под круглым уровнем. Пробой и закрепление ниже $0.1510 запустит каскад ликвидаций лонгов с быстрым прострелом в зону $0.1480.
Уже открыл шорт по $ADA или ждешь пробоя $0.1510 для входа? Пиши в комментариях! 👇
#ADAUSDT #BİNANCEFUTURES #cryptotrading #liquidationmap
🧲 $ADA готовится к жесткому проливу за стопами лонгистов на $0.1480!
Цена ($0.1528) не удержала локальный рост, откатилась под середину диапазона и сейчас давит прямо на нижнюю границу. Покупатели слабеют, а снизу накопился огромный пул ликвидности. (Примечание: точный объем в $M на скриншоте не виден, оцениваем по максимальной яркости кластеров).
🔺 Сверху ($0.1560–$0.1580): плотный кластер ликвидаций шортистов, до которого цене сейчас не хватает сил дотянуться.
🔻 Снизу ($0.1480–$0.1500): жирный магнит стопов лонгистов прямо под круглой психологической отметкой $0.1500.
Прогноз и план:
Жду сквиз вниз — маркетмейкеру гораздо проще и быстрее забрать близкие стопы под круглым уровнем. Пробой и закрепление ниже $0.1510 запустит каскад ликвидаций лонгов с быстрым прострелом в зону $0.1480.
Уже открыл шорт по $ADA или ждешь пробоя $0.1510 для входа? Пиши в комментариях! 👇
#ADAUSDT #BİNANCEFUTURES #cryptotrading #liquidationmap
Цена ($0.1528) не удержала локальный рост, откатилась под середину диапазона и сейчас давит прямо на нижнюю границу. Покупатели слабеют, а снизу накопился огромный пул ликвидности. (Примечание: точный объем в $M на скриншоте не виден, оцениваем по максимальной яркости кластеров).
🔺 Сверху ($0.1560–$0.1580): плотный кластер ликвидаций шортистов, до которого цене сейчас не хватает сил дотянуться.
🔻 Снизу ($0.1480–$0.1500): жирный магнит стопов лонгистов прямо под круглой психологической отметкой $0.1500.
Прогноз и план:
Жду сквиз вниз — маркетмейкеру гораздо проще и быстрее забрать близкие стопы под круглым уровнем. Пробой и закрепление ниже $0.1510 запустит каскад ликвидаций лонгов с быстрым прострелом в зону $0.1480.
Уже открыл шорт по $ADA или ждешь пробоя $0.1510 для входа? Пиши в комментариях! 👇
#ADAUSDT #BİNANCEFUTURES #cryptotrading #liquidationmap
Artist 1979:
Какой тут жесткий пролив …. 0,1 цена !
2
1
540
Cẩn thận cái bẫy thanh lý của $MSTR (Index ~86.8) tuần này! Bản đồ cho thấy phe Short đang bị ngắm nghía mạnh ở vùng 87.5–88.5, trong khi đám đông Long chực chờ phía dưới tại 85.3–85.7. Liệu cá mập sẽ hốt sạch Short lên 90 trước hay đạp thẳng về 84? Anh em đang ôm vị thế nào rồi?
#BinanceSquare #MSTR #CryptoTrading #LiquidationMap
Cẩn thận cái bẫy thanh lý của $MSTR (Index ~86.8) tuần này! Bản đồ cho thấy phe Short đang bị ngắm nghía mạnh ở vùng 87.5–88.5, trong khi đám đông Long chực chờ phía dưới tại 85.3–85.7. Liệu cá mập sẽ hốt sạch Short lên 90 trước hay đạp thẳng về 84? Anh em đang ôm vị thế nào rồi?
#BinanceSquare #MSTR #CryptoTrading #LiquidationMap
#BinanceSquare #MSTR #CryptoTrading #LiquidationMap
94
·
--
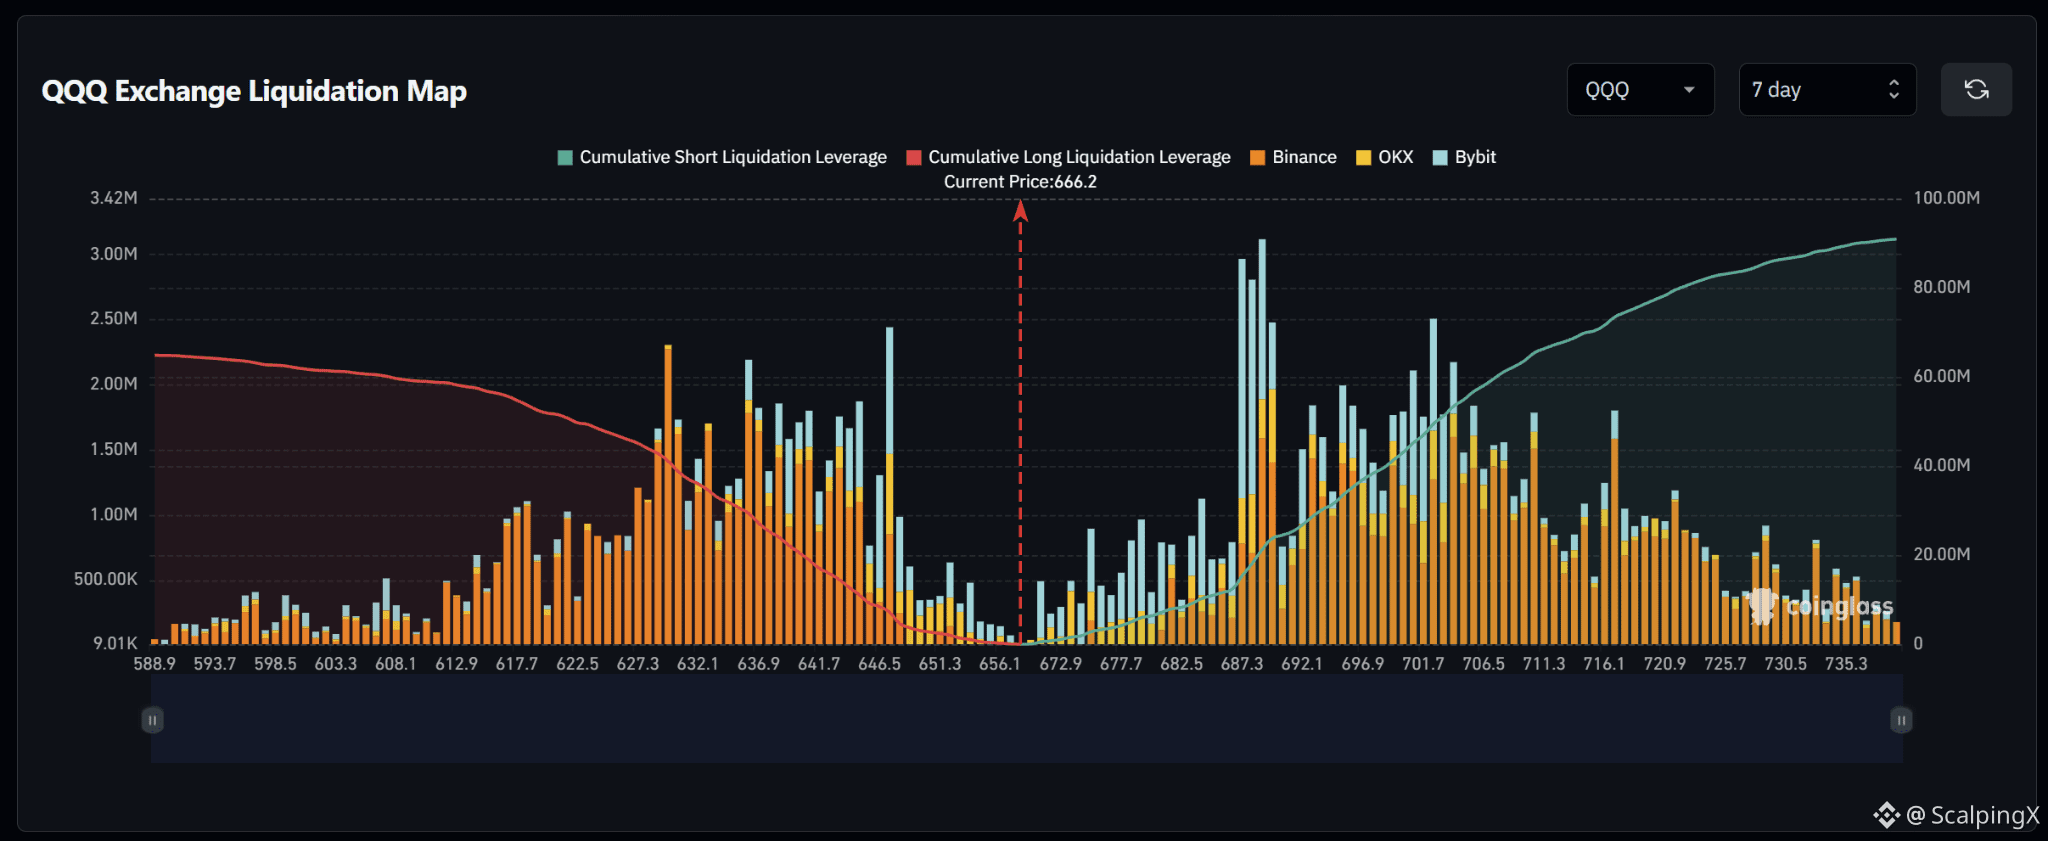
$QQQ – Liquidation Map (7 days) – Index ~666.2
🧭 Favor a short-liquidation sweep at 670–680. Upside clusters gradually increase in size, while longs immediately below price are relatively sparse. The most prominent short zone sits at 687–690.
🔺 Breaking and holding above 680 would shift focus to 683–690, with the largest bar around 689. Holding above 690 would bring 693–705 into view, another zone containing several large bars.
🎯 Above 705, the next notable clusters sit at 707–711 and 716–721. Bar sizes decline noticeably above 725. Sweeping the initial clusters and quickly falling below 666.2 would weaken upside continuation.
⚖️ Losing 665 without reclaiming it would shift preference toward long-liquidation sweeps at 658–662, then 650–655. Holding below 650 would put the larger 640–647 zone in focus. Reclaiming 666.2 after a sweep would weaken downside continuation.
#LiquidationMap
$QQQ – Liquidation Map (7 days) – Index ~666.2
🧭 Favor a short-liquidation sweep at 670–680. Upside clusters gradually increase in size, while longs immediately below price are relatively sparse. The most prominent short zone sits at 687–690.
🔺 Breaking and holding above 680 would shift focus to 683–690, with the largest bar around 689. Holding above 690 would bring 693–705 into view, another zone containing several large bars.
🎯 Above 705, the next notable clusters sit at 707–711 and 716–721. Bar sizes decline noticeably above 725. Sweeping the initial clusters and quickly falling below 666.2 would weaken upside continuation.
⚖️ Losing 665 without reclaiming it would shift preference toward long-liquidation sweeps at 658–662, then 650–655. Holding below 650 would put the larger 640–647 zone in focus. Reclaiming 666.2 after a sweep would weaken downside continuation.
#LiquidationMap
🧭 Favor a short-liquidation sweep at 670–680. Upside clusters gradually increase in size, while longs immediately below price are relatively sparse. The most prominent short zone sits at 687–690.
🔺 Breaking and holding above 680 would shift focus to 683–690, with the largest bar around 689. Holding above 690 would bring 693–705 into view, another zone containing several large bars.
🎯 Above 705, the next notable clusters sit at 707–711 and 716–721. Bar sizes decline noticeably above 725. Sweeping the initial clusters and quickly falling below 666.2 would weaken upside continuation.
⚖️ Losing 665 without reclaiming it would shift preference toward long-liquidation sweeps at 658–662, then 650–655. Holding below 650 would put the larger 640–647 zone in focus. Reclaiming 666.2 after a sweep would weaken downside continuation.
#LiquidationMap
14
Log in to explore more content
Join global crypto users on Binance Square
⚡️ Get latest and useful information about crypto.
💬 Trusted by the world’s largest crypto exchange.
👍 Discover real insights from verified creators.
Email / Phone number
Trending Topics
1
#CanBTCReboundAfterFallingBelow60K?
403,812 views
1,727 Discussing
2
#GlobalStocksFaceLongestLosingStreakSince2023
134,979 views
1,204 Discussing
3
#BlackRockIBITPostsRecord$541MSingleDayOutflow
1,868 views
32 Discussing
4
#AnthropicPlungesTowardIPOPriceonDay2
63,964 views
666 Discussing
5
#TwentyOneCapitalAdds172.25BTC
16,568 views
218 Discussing
6
#HKBillWouldExcludeTokenizedDepositsFromVirtualAssets
1,739 views
21 Discussing
7
#BNBDropsBelow540USDTWith8.46%DailyDecline
37,033 views
326 Discussing
8
#HKBillProposesHK$100KFineForUnauthorizedCryptoTitles
1,166 views
18 Discussing
9
#BitMineFaces$10.1BUnrealizedETHLoss
2,234 views
20 Discussing
10
#StrategyReports$35BNetReserves
2,174 views
18 Discussing