
#chartpatterns
chartpatterns
659,581 views
2,139 Discussing
Hot
Latest

·
--
A confession from a chart nerd 📉
I used to spend more time scanning for setups than analysing them. Triangles, wedges, head & shoulders all hiding across different coins and timeframes.
That's why we built ChartScout. It detects chart patterns and sends alerts when they form, so your attention goes to the setups that matter.
For Black Friday, ChartScout Pro is 40% off for 3 months.
Always confirm with your own analysis and risk management. This is a tool, not a signal service, and not financial advice.
#chartpatterns #TechnicalAnalysis #crypto #trading
A confession from a chart nerd 📉
I used to spend more time scanning for setups than analysing them. Triangles, wedges, head & shoulders all hiding across different coins and timeframes.
That's why we built ChartScout. It detects chart patterns and sends alerts when they form, so your attention goes to the setups that matter.
For Black Friday, ChartScout Pro is 40% off for 3 months.
Always confirm with your own analysis and risk management. This is a tool, not a signal service, and not financial advice.
#chartpatterns #TechnicalAnalysis #crypto #trading
I used to spend more time scanning for setups than analysing them. Triangles, wedges, head & shoulders all hiding across different coins and timeframes.
That's why we built ChartScout. It detects chart patterns and sends alerts when they form, so your attention goes to the setups that matter.
For Black Friday, ChartScout Pro is 40% off for 3 months.
Always confirm with your own analysis and risk management. This is a tool, not a signal service, and not financial advice.
#chartpatterns #TechnicalAnalysis #crypto #trading

76

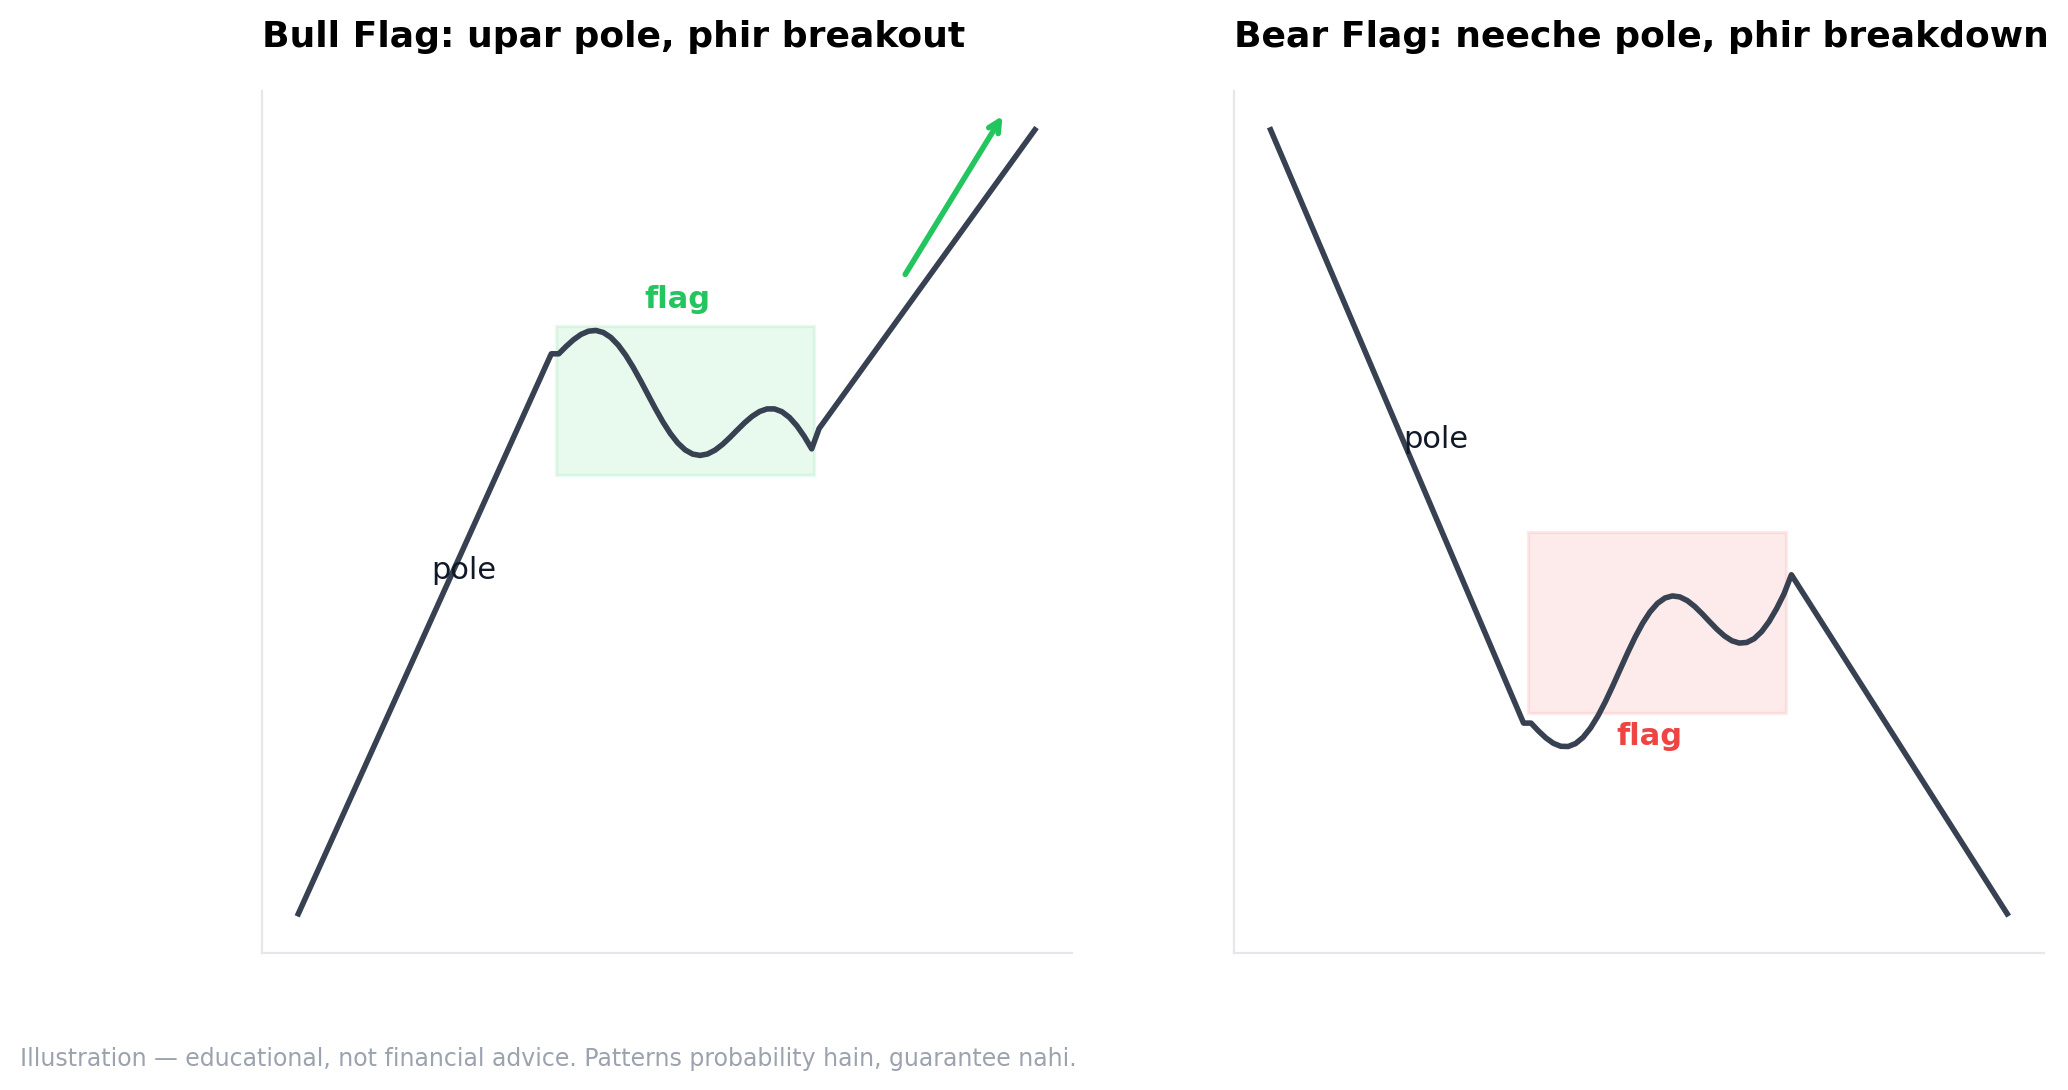
🚩 Flag patterns — trend ke beech ka saans.
1️⃣ Pole: tez directional move (bull mein upar, bear mein neeche)
2️⃣ Flag: us move ke baad patla, opposite-drift consolidation — market saans le raha hai
3️⃣ Breakout ya breakdown: flag ke bahar close — continuation ka classic (lekin pakka nahi) signal
Bear market mein bear flag sab se zyada dikhta hai — bounce aata hai, flag banta hai, phir breakdown.
Pattern = probability template hai — invalidation pehle likho. 📐
Chart mein dono flags side by side. 📊
Illustration — educational. 🔍
$BTC
#ChartPatterns #TechnicalAnalysis #CryptoTrading
🚩 Flag patterns — trend ke beech ka saans.
1️⃣ Pole: tez directional move (bull mein upar, bear mein neeche)
2️⃣ Flag: us move ke baad patla, opposite-drift consolidation — market saans le raha hai
3️⃣ Breakout ya breakdown: flag ke bahar close — continuation ka classic (lekin pakka nahi) signal
Bear market mein bear flag sab se zyada dikhta hai — bounce aata hai, flag banta hai, phir breakdown.
Pattern = probability template hai — invalidation pehle likho. 📐
Chart mein dono flags side by side. 📊
Illustration — educational. 🔍
$BTC
#ChartPatterns #TechnicalAnalysis #CryptoTrading
1️⃣ Pole: tez directional move (bull mein upar, bear mein neeche)
2️⃣ Flag: us move ke baad patla, opposite-drift consolidation — market saans le raha hai
3️⃣ Breakout ya breakdown: flag ke bahar close — continuation ka classic (lekin pakka nahi) signal
Bear market mein bear flag sab se zyada dikhta hai — bounce aata hai, flag banta hai, phir breakdown.
Pattern = probability template hai — invalidation pehle likho. 📐
Chart mein dono flags side by side. 📊
Illustration — educational. 🔍
$BTC
#ChartPatterns #TechnicalAnalysis #CryptoTrading
3
·
--
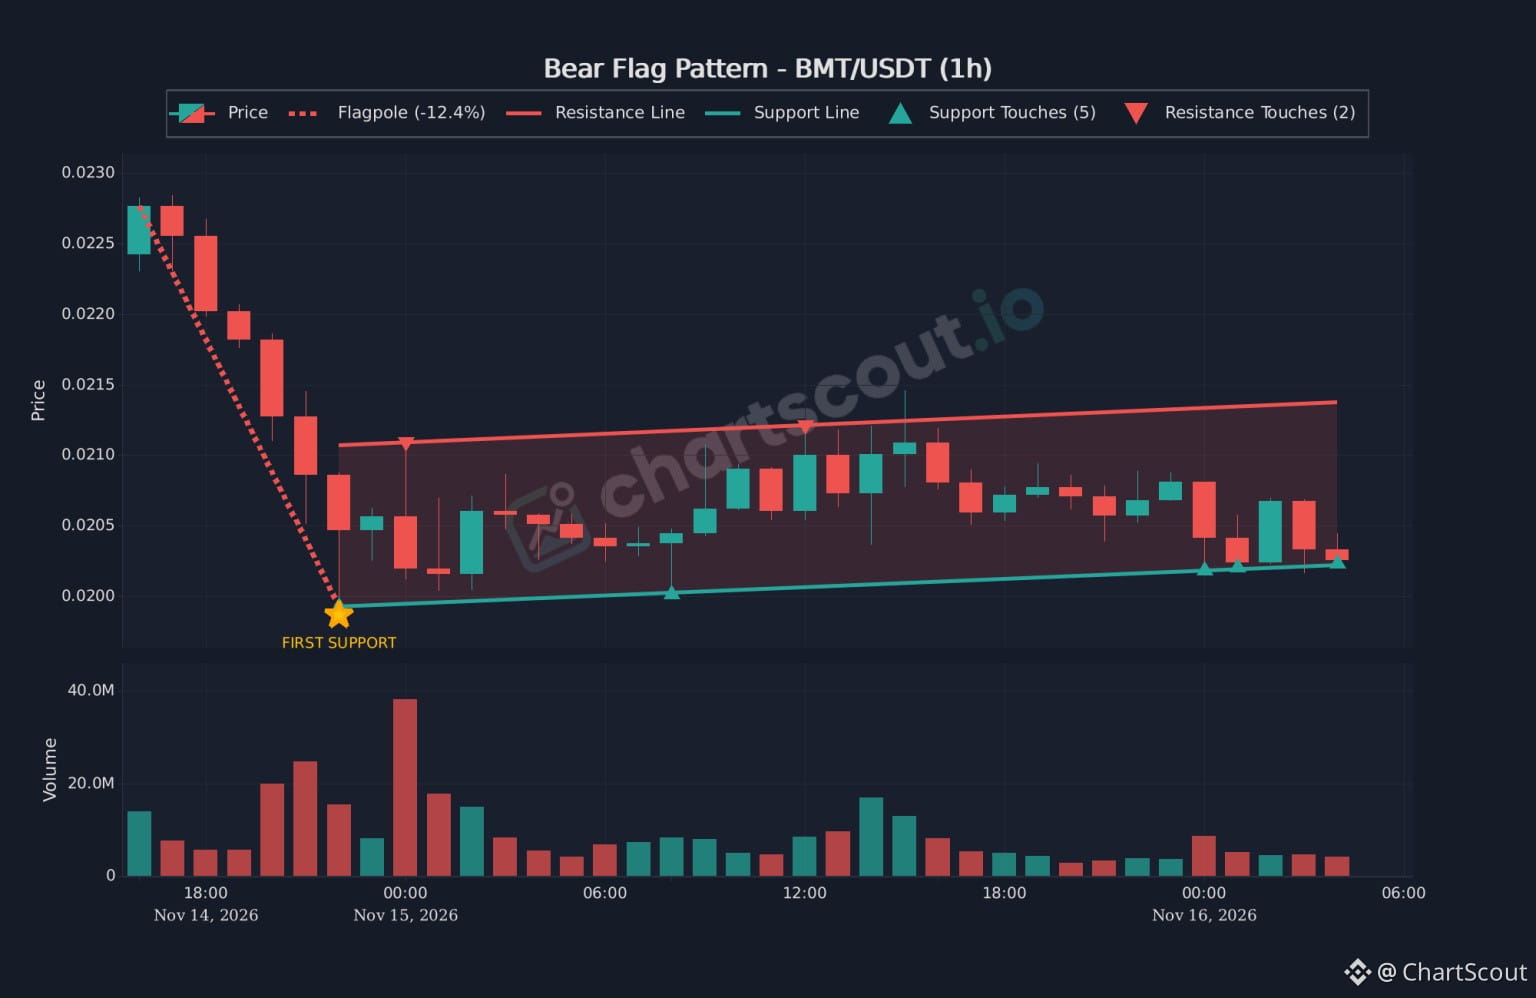
BMT/USDT 1h: back on support inside a possible bear flag. 🔍
After a 12.4% drop, price has drifted up in a gentle channel with 5 touches on the lower line and 2 on the upper. It's now sitting at the floor near 0.0202, with the top line around 0.0214.
Volume was heaviest on the way down and has faded since. A bear flag only matters if a candle closes below the lower line, so nothing is confirmed here.
Spotted with ChartScout's pattern scanner (free trial in our profile).
#BMT #chartpatterns #TechnicalAnalysis #ChartScout
BMT/USDT 1h: back on support inside a possible bear flag. 🔍
After a 12.4% drop, price has drifted up in a gentle channel with 5 touches on the lower line and 2 on the upper. It's now sitting at the floor near 0.0202, with the top line around 0.0214.
Volume was heaviest on the way down and has faded since. A bear flag only matters if a candle closes below the lower line, so nothing is confirmed here.
Spotted with ChartScout's pattern scanner (free trial in our profile).
#BMT #chartpatterns #TechnicalAnalysis #ChartScout
After a 12.4% drop, price has drifted up in a gentle channel with 5 touches on the lower line and 2 on the upper. It's now sitting at the floor near 0.0202, with the top line around 0.0214.
Volume was heaviest on the way down and has faded since. A bear flag only matters if a candle closes below the lower line, so nothing is confirmed here.
Spotted with ChartScout's pattern scanner (free trial in our profile).
#BMT #chartpatterns #TechnicalAnalysis #ChartScout
590

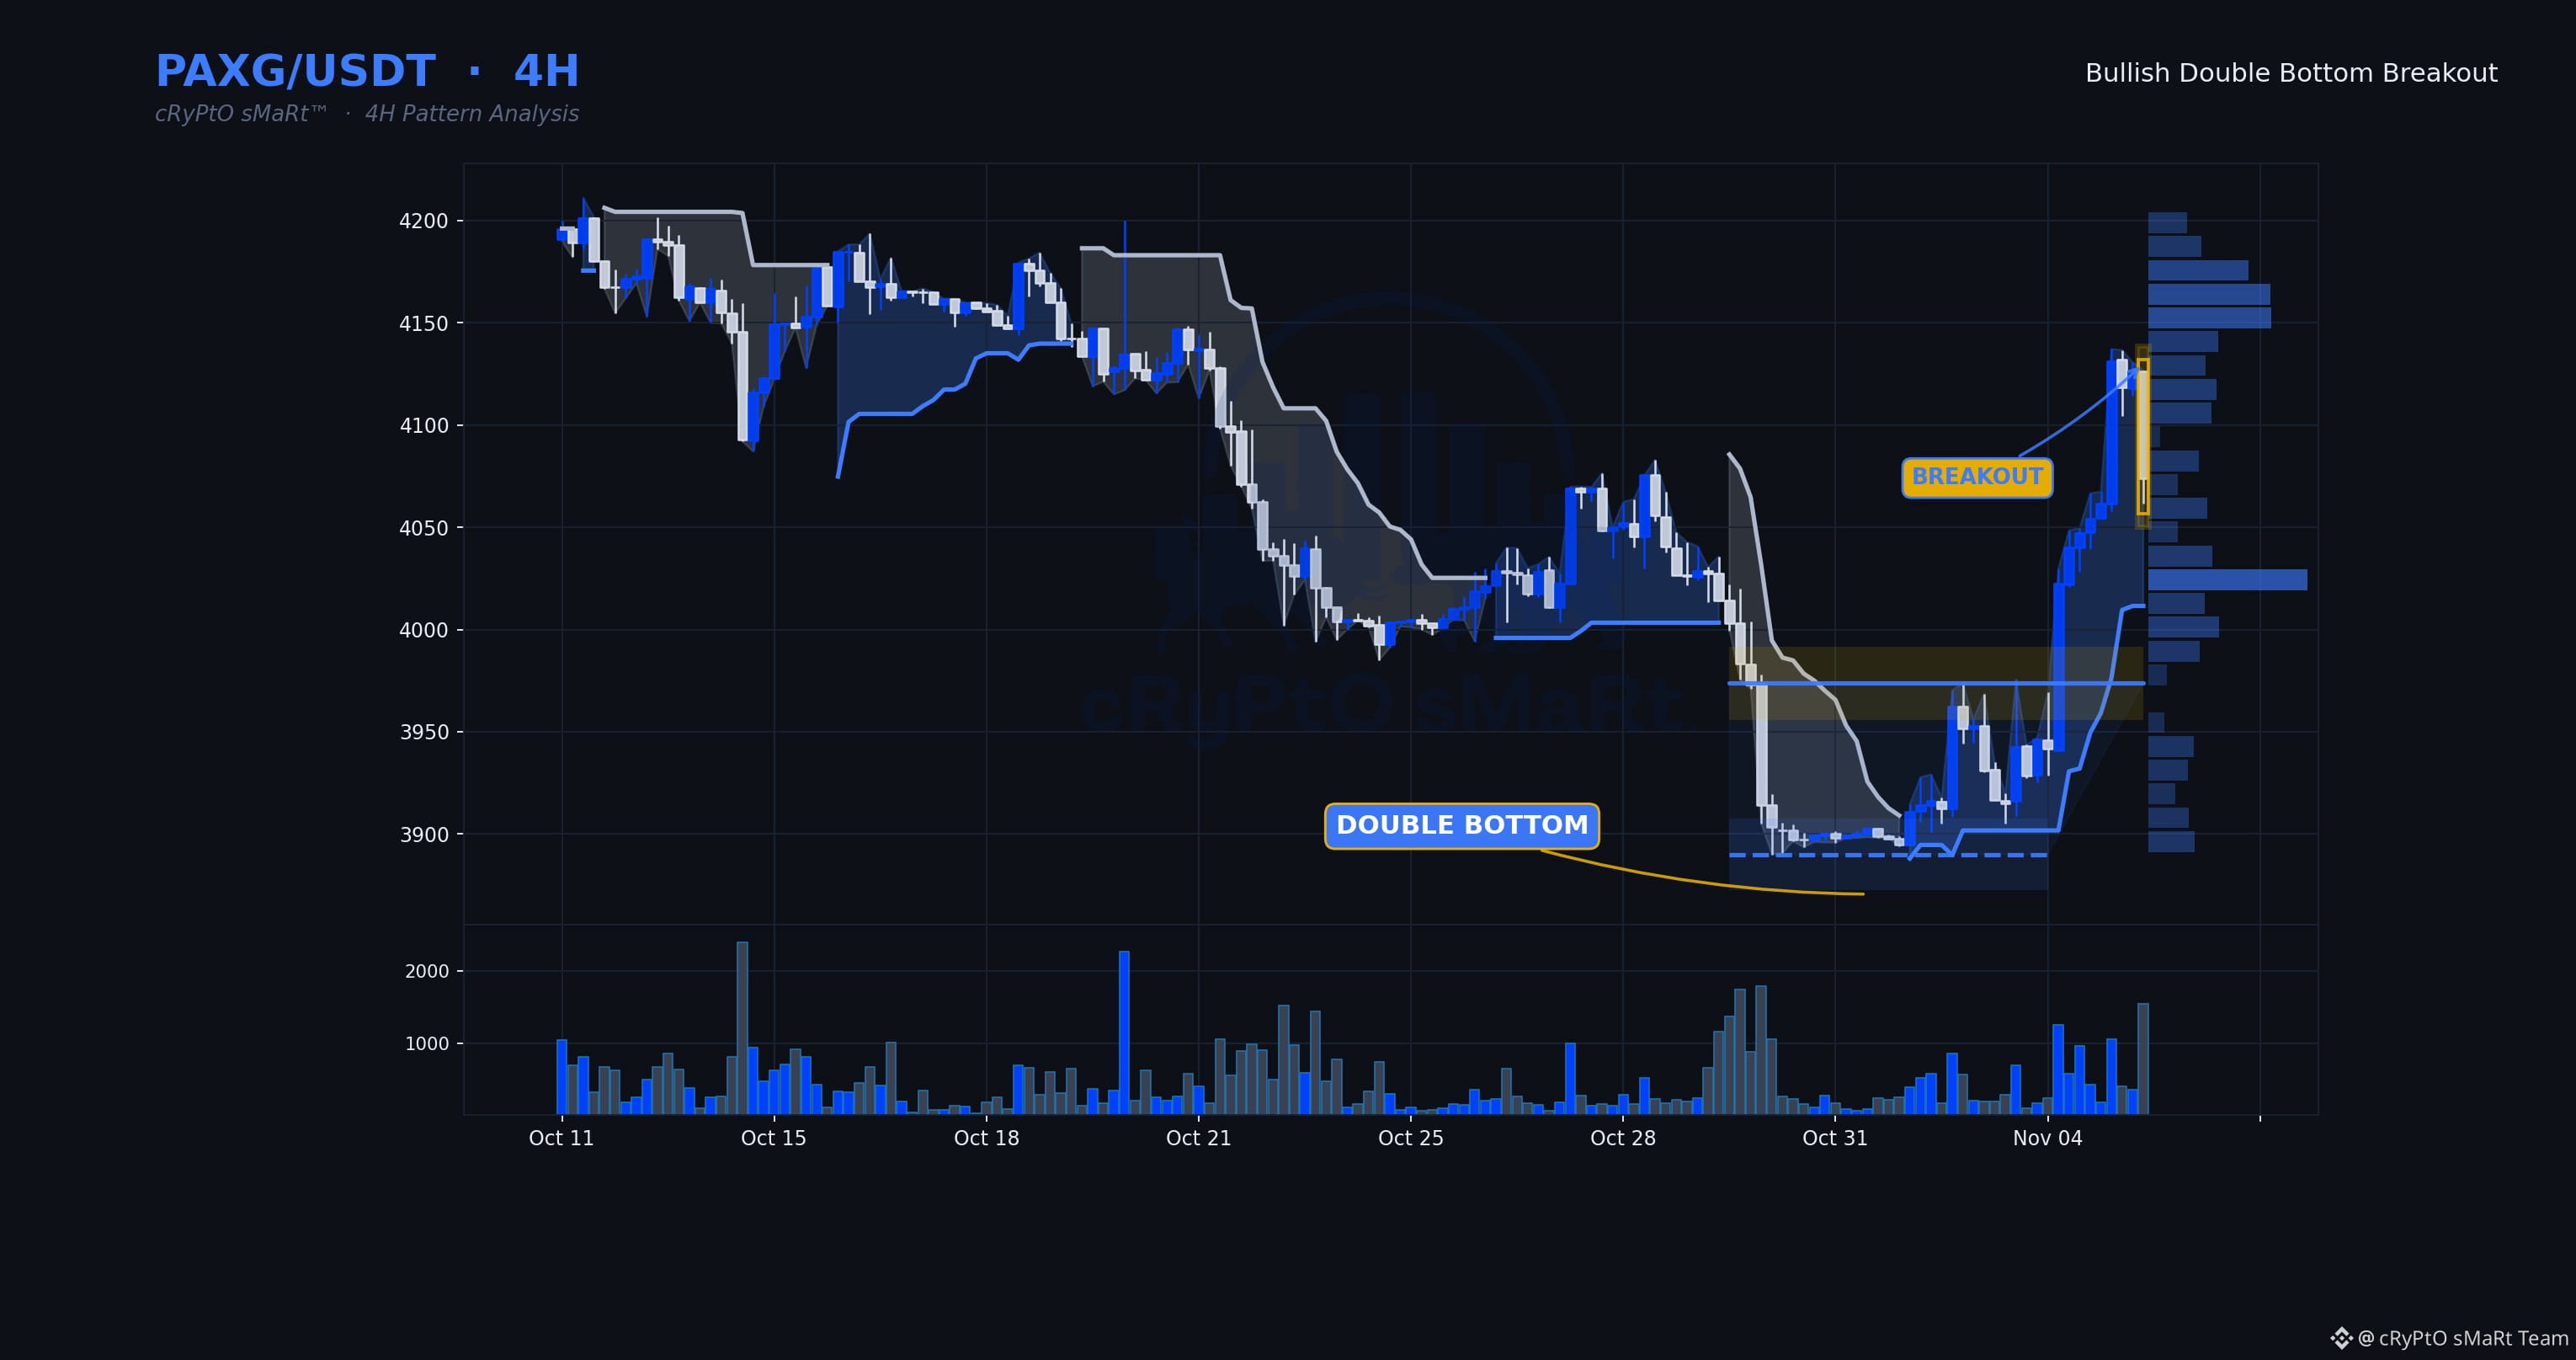
Buyers just took out the neckline on a double bottom with volume stepping up well above average — that's not a drift higher, that's participation showing up at the decision point. Momentum still has room before anything looks stretched, which matters for a breakout this clean.
🗓 Daily: Neutral — daily is mixed — Supertrend and EMAs not aligned
⏱ 4H: Double Bottom · Bullish bias
⏳ 1H: price is above the level but the 1H trend hasn't turned up yet — a 1H close that flips the trend up is the trigger.
📋 WHY IT QUALIFIES
✓ Double Bottom structure completed
✓ Decisive breakout — closed 2.5% beyond the line
✓ Volume 2.9× its 20-bar average
✓ RSI 63 — momentum confirms, not yet exhausted
🧭 Bias: Bullish while price holds above $3,973.74
⚠️ Invalidation: 4H close back below $3,973.74
🔵 Support $3,890.00 🟡 Resistance $3,973.74
$PAXG $BTC #ChartPatterns
Education only, not financial advice.
Buyers just took out the neckline on a double bottom with volume stepping up well above average — that's not a drift higher, that's participation showing up at the decision point. Momentum still has room before anything looks stretched, which matters for a breakout this clean.
🗓 Daily: Neutral — daily is mixed — Supertrend and EMAs not aligned
⏱ 4H: Double Bottom · Bullish bias
⏳ 1H: price is above the level but the 1H trend hasn't turned up yet — a 1H close that flips the trend up is the trigger.
📋 WHY IT QUALIFIES
✓ Double Bottom structure completed
✓ Decisive breakout — closed 2.5% beyond the line
✓ Volume 2.9× its 20-bar average
✓ RSI 63 — momentum confirms, not yet exhausted
🧭 Bias: Bullish while price holds above $3,973.74
⚠️ Invalidation: 4H close back below $3,973.74
🔵 Support $3,890.00 🟡 Resistance $3,973.74
$PAXG $BTC #ChartPatterns
Education only, not financial advice.
🗓 Daily: Neutral — daily is mixed — Supertrend and EMAs not aligned
⏱ 4H: Double Bottom · Bullish bias
⏳ 1H: price is above the level but the 1H trend hasn't turned up yet — a 1H close that flips the trend up is the trigger.
📋 WHY IT QUALIFIES
✓ Double Bottom structure completed
✓ Decisive breakout — closed 2.5% beyond the line
✓ Volume 2.9× its 20-bar average
✓ RSI 63 — momentum confirms, not yet exhausted
🧭 Bias: Bullish while price holds above $3,973.74
⚠️ Invalidation: 4H close back below $3,973.74
🔵 Support $3,890.00 🟡 Resistance $3,973.74
$PAXG $BTC #ChartPatterns
Education only, not financial advice.
156
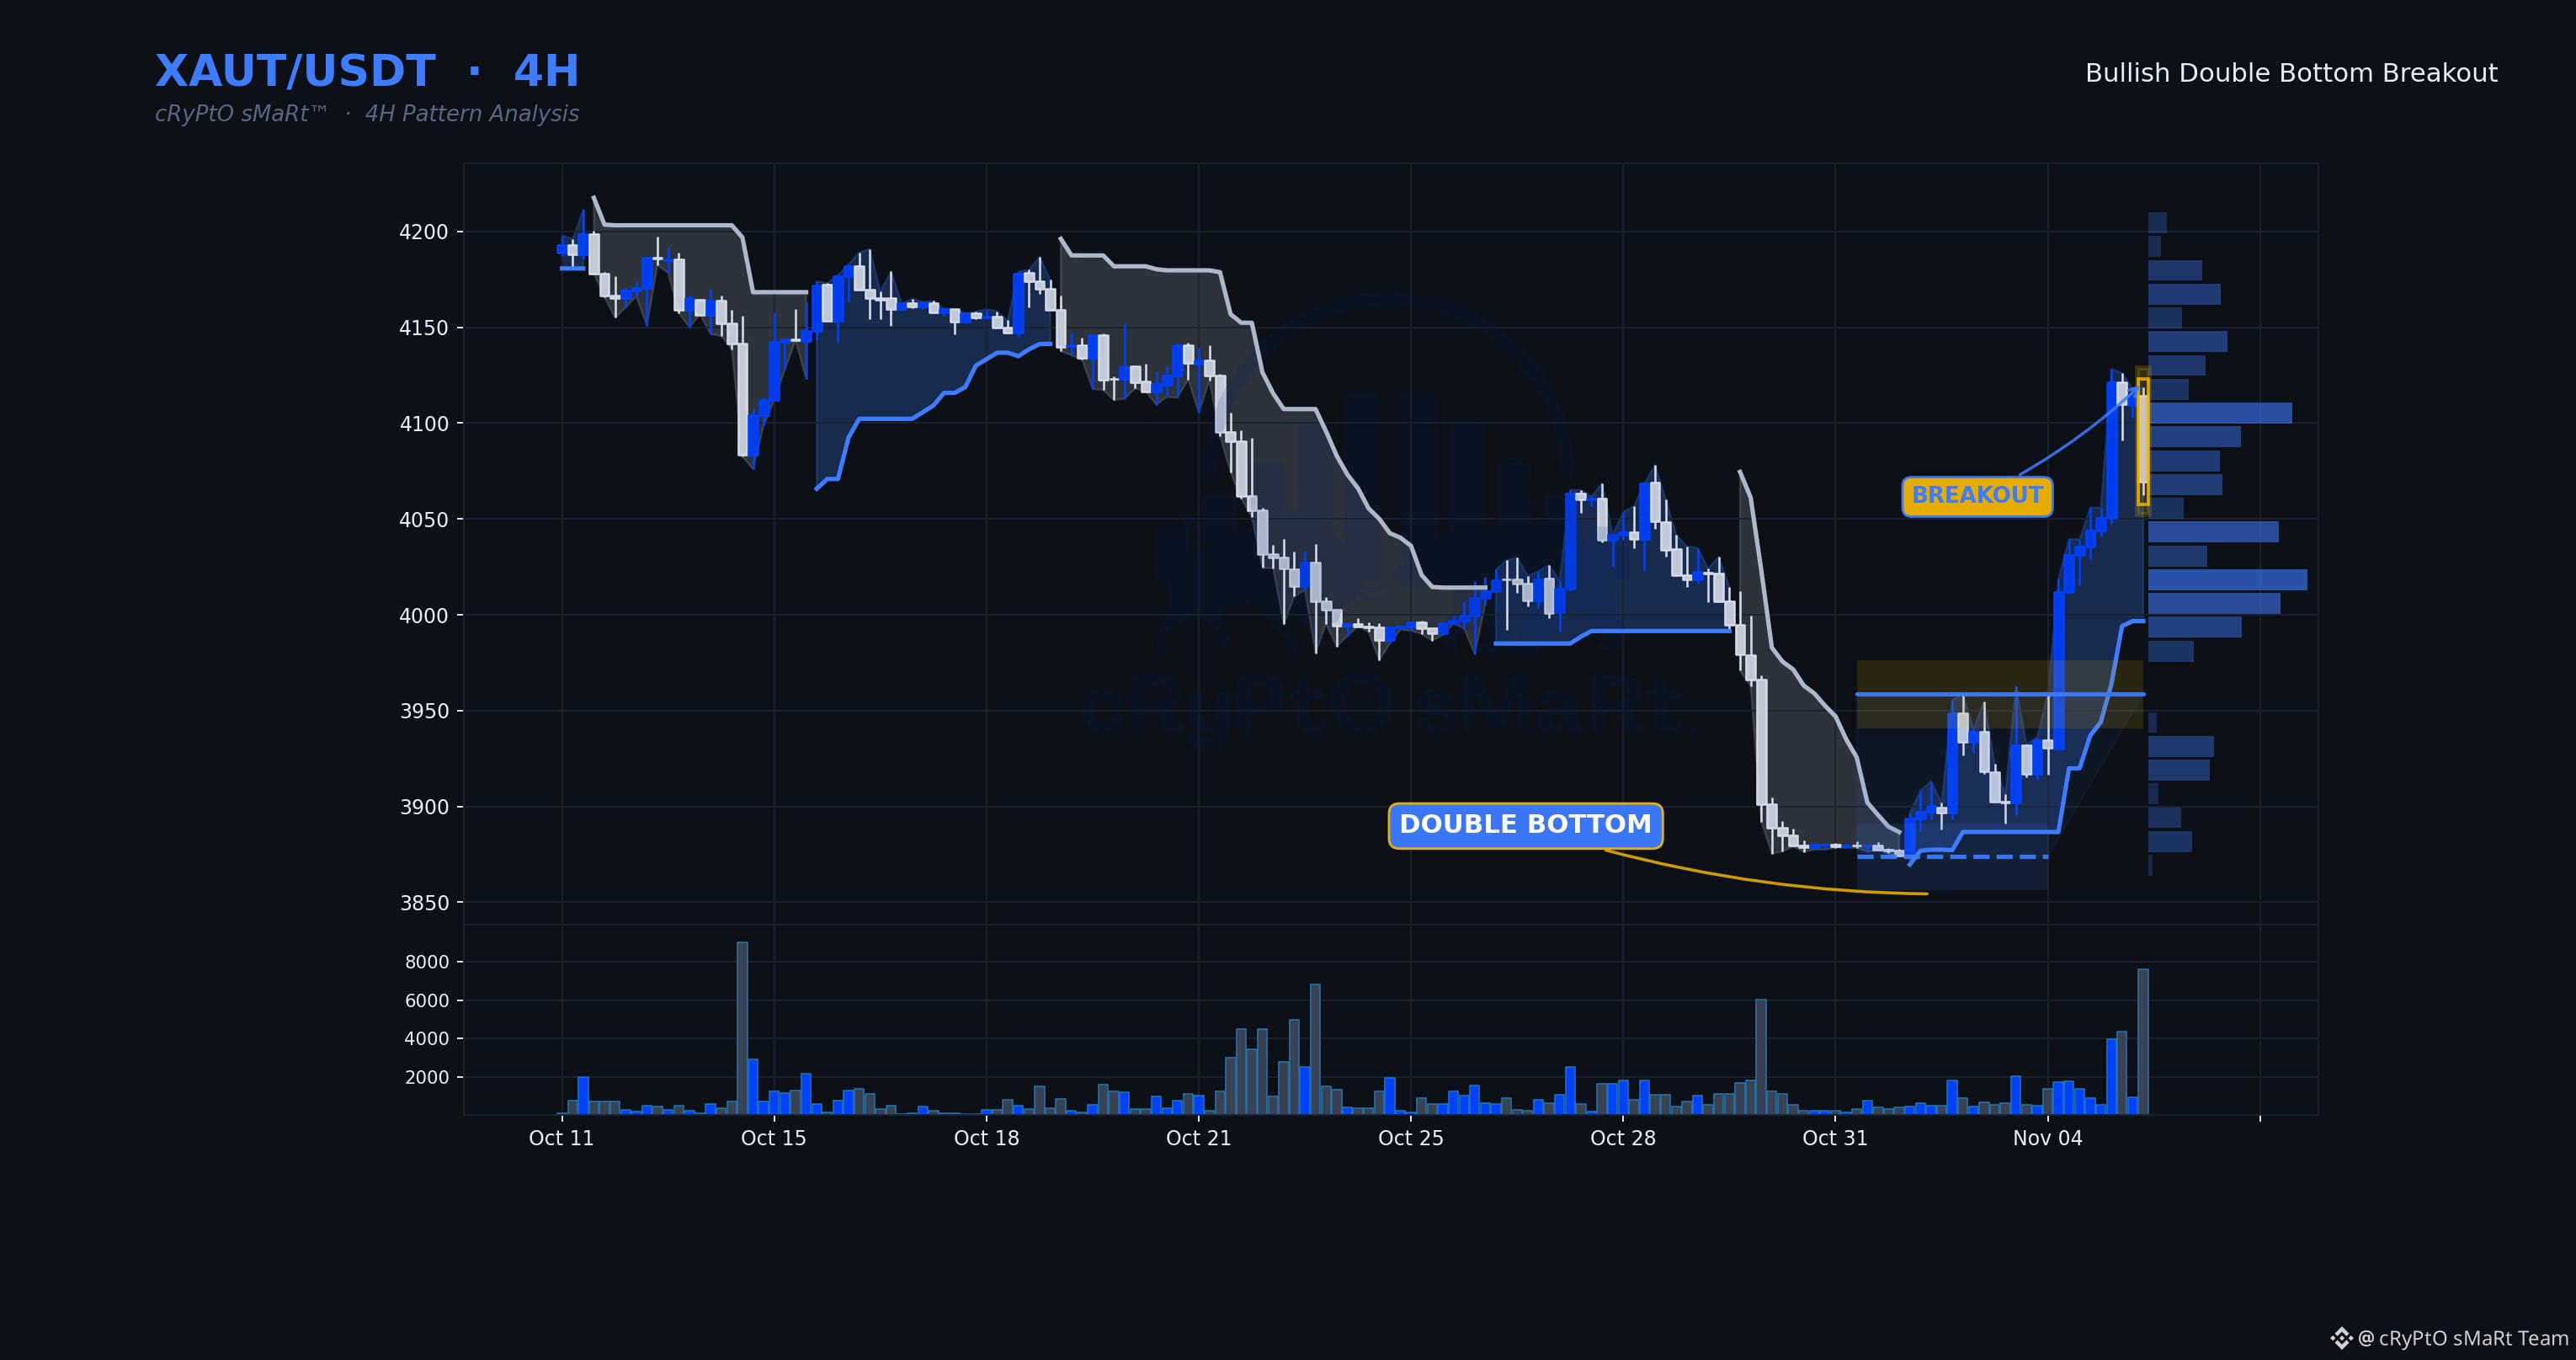
Buyers just took out the neckline with volume well above average, not a limp poke through — that's conviction stepping in, not stragglers. Double bottom confirms control has shifted away from sellers who defended that range twice and failed.
🗓 Daily: Neutral — daily is mixed — Supertrend and EMAs not aligned
⏱ 4H: Double Bottom · Bullish bias
⏳ 1H: price is above the level but the 1H trend hasn't turned up yet — a 1H close that flips the trend up is the trigger.
📋 WHY IT QUALIFIES
✓ Double Bottom structure completed
✓ Decisive breakout — closed 2.8% beyond the line
✓ Volume 4.6× its 20-bar average
✓ RSI 65 — momentum confirms, not yet exhausted
🧭 Bias: Bullish while price holds above $3,958.71
⚠️ Invalidation: 4H close back below $3,958.71
🔵 Support $3,873.76 🟡 Resistance $3,958.71
$XAUT $BTC #ChartPatterns
Education only, not financial advice.
Buyers just took out the neckline with volume well above average, not a limp poke through — that's conviction stepping in, not stragglers. Double bottom confirms control has shifted away from sellers who defended that range twice and failed.
🗓 Daily: Neutral — daily is mixed — Supertrend and EMAs not aligned
⏱ 4H: Double Bottom · Bullish bias
⏳ 1H: price is above the level but the 1H trend hasn't turned up yet — a 1H close that flips the trend up is the trigger.
📋 WHY IT QUALIFIES
✓ Double Bottom structure completed
✓ Decisive breakout — closed 2.8% beyond the line
✓ Volume 4.6× its 20-bar average
✓ RSI 65 — momentum confirms, not yet exhausted
🧭 Bias: Bullish while price holds above $3,958.71
⚠️ Invalidation: 4H close back below $3,958.71
🔵 Support $3,873.76 🟡 Resistance $3,958.71
$XAUT $BTC #ChartPatterns
Education only, not financial advice.
🗓 Daily: Neutral — daily is mixed — Supertrend and EMAs not aligned
⏱ 4H: Double Bottom · Bullish bias
⏳ 1H: price is above the level but the 1H trend hasn't turned up yet — a 1H close that flips the trend up is the trigger.
📋 WHY IT QUALIFIES
✓ Double Bottom structure completed
✓ Decisive breakout — closed 2.8% beyond the line
✓ Volume 4.6× its 20-bar average
✓ RSI 65 — momentum confirms, not yet exhausted
🧭 Bias: Bullish while price holds above $3,958.71
⚠️ Invalidation: 4H close back below $3,958.71
🔵 Support $3,873.76 🟡 Resistance $3,958.71
$XAUT $BTC #ChartPatterns
Education only, not financial advice.
133
·
--
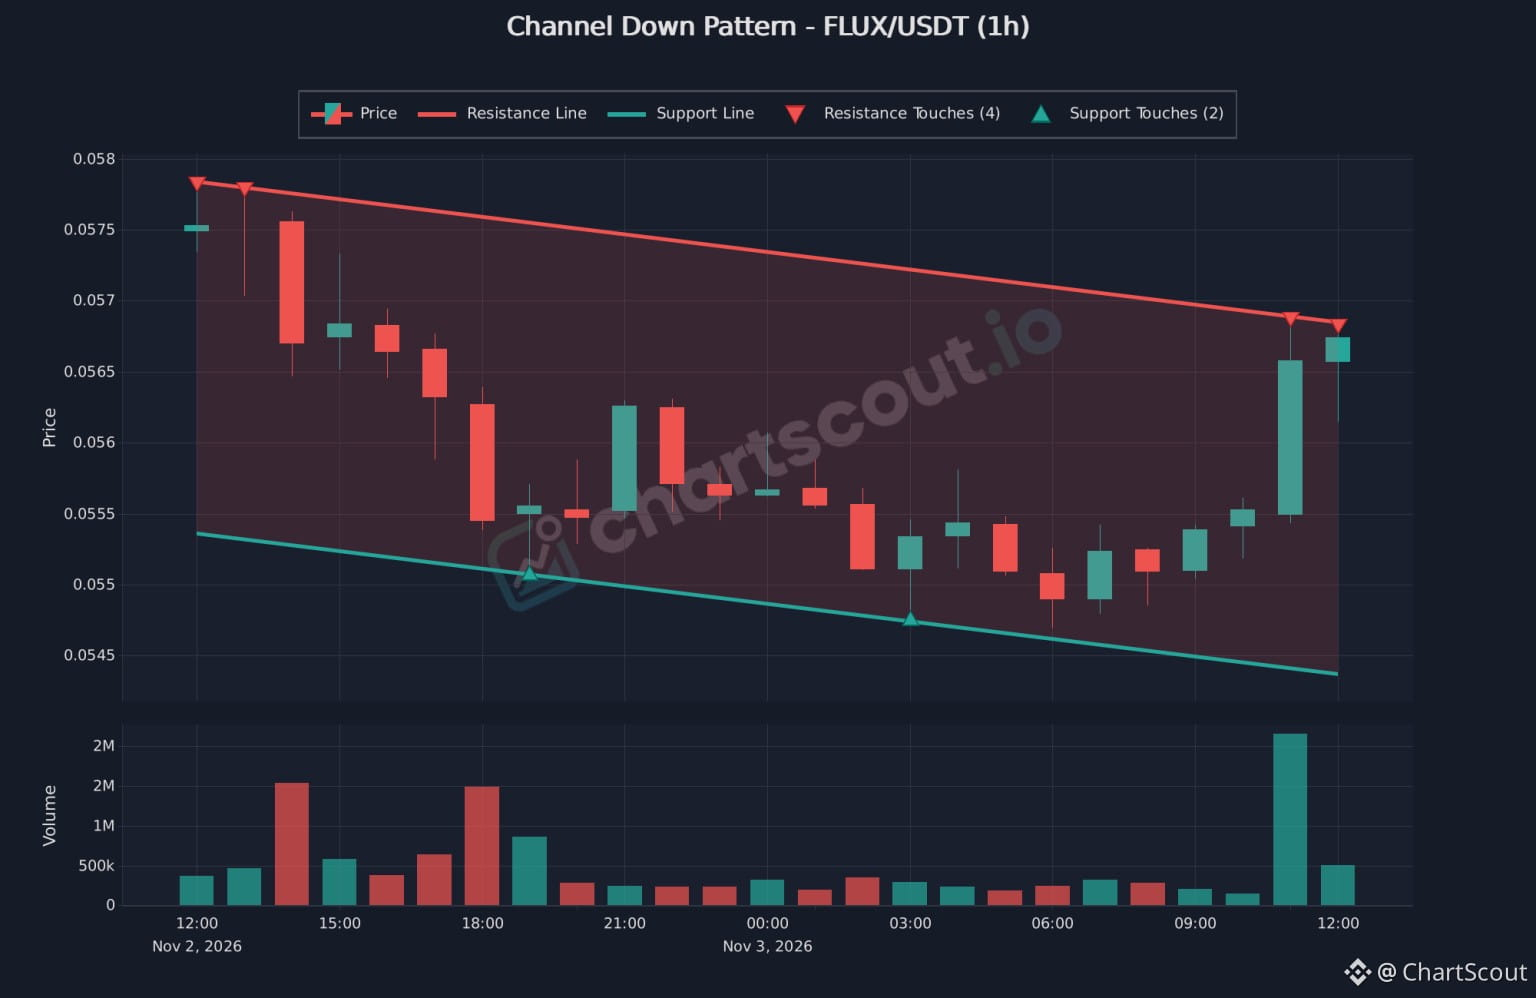
FLUX/USDT 1h: testing the top of a descending channel. 🔍
After a day of lower highs, a large green candle on the heaviest volume of the session pushed price up to the upper line near 0.0568. The lower line is around 0.0544.
The upper line has been touched 4 times and the lower only 2. A channel is only broken when price closes beyond a line, so a touch isn't enough.
Spotted with ChartScout's pattern scanner (free trial in our profile).
#flux #chartpatterns #TechnicalAnalysis #ChartScout
FLUX/USDT 1h: testing the top of a descending channel. 🔍
After a day of lower highs, a large green candle on the heaviest volume of the session pushed price up to the upper line near 0.0568. The lower line is around 0.0544.
The upper line has been touched 4 times and the lower only 2. A channel is only broken when price closes beyond a line, so a touch isn't enough.
Spotted with ChartScout's pattern scanner (free trial in our profile).
#flux #chartpatterns #TechnicalAnalysis #ChartScout
After a day of lower highs, a large green candle on the heaviest volume of the session pushed price up to the upper line near 0.0568. The lower line is around 0.0544.
The upper line has been touched 4 times and the lower only 2. A channel is only broken when price closes beyond a line, so a touch isn't enough.
Spotted with ChartScout's pattern scanner (free trial in our profile).
#flux #chartpatterns #TechnicalAnalysis #ChartScout
293
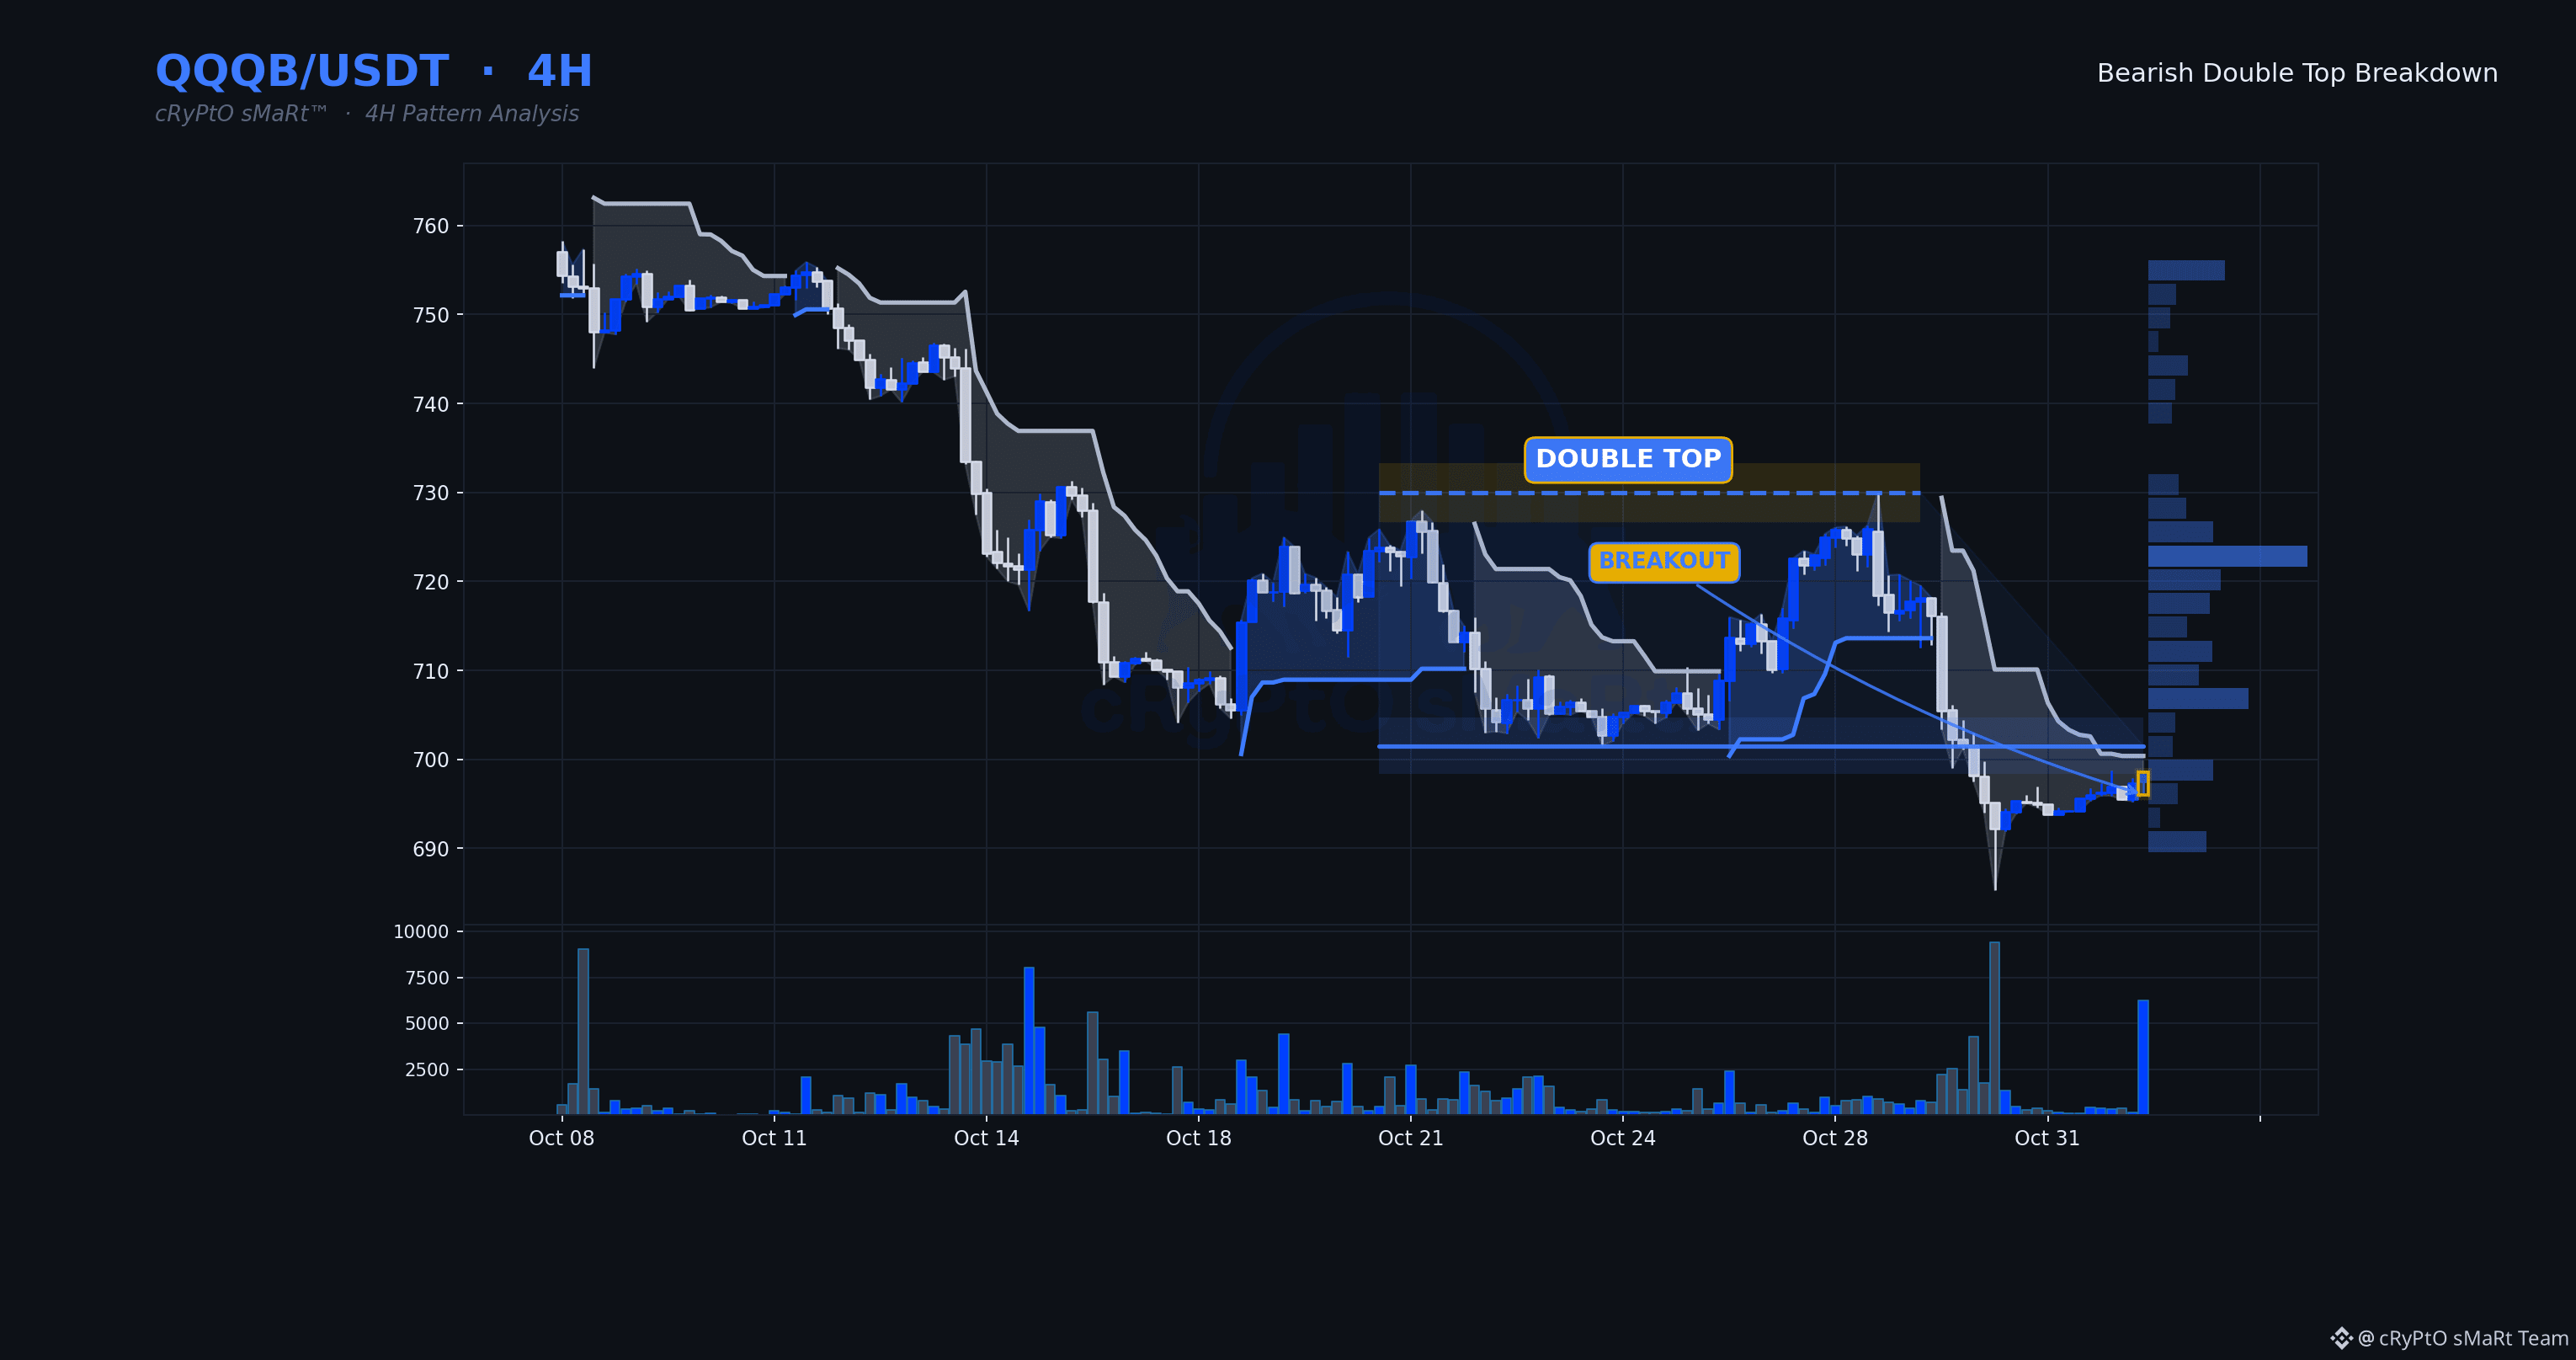
Sellers just took the neckline with volume that confirms real participation, not a thin stop-run. Double top structures resolving on decisive breaks tend to mean the buyers who defended that range are now underwater and trapped.
🗓 Daily: Bearish — price below the daily Supertrend with a falling 50/200 EMA stack
⏱ 4H: Double Top · Bearish bias
⏳ 1H: price is under the level but the 1H trend is still up — a 1H close that flips the trend down is the trigger.
📋 WHY IT QUALIFIES
✓ Double Top structure completed
✓ Decisive breakdown — closed 0.5% beyond the line
✓ Volume 3.8× its 20-bar average
✓ RSI 43 — momentum confirms, not yet exhausted
🧭 Bias: Bearish while price holds below $701.5300
⚠️ Invalidation: 4H close back above $701.5300
🔵 Support $701.5300 🟡 Resistance $729.9800
$QQQB $BTC #ChartPatterns
Education only, not financial advice.
Sellers just took the neckline with volume that confirms real participation, not a thin stop-run. Double top structures resolving on decisive breaks tend to mean the buyers who defended that range are now underwater and trapped.
🗓 Daily: Bearish — price below the daily Supertrend with a falling 50/200 EMA stack
⏱ 4H: Double Top · Bearish bias
⏳ 1H: price is under the level but the 1H trend is still up — a 1H close that flips the trend down is the trigger.
📋 WHY IT QUALIFIES
✓ Double Top structure completed
✓ Decisive breakdown — closed 0.5% beyond the line
✓ Volume 3.8× its 20-bar average
✓ RSI 43 — momentum confirms, not yet exhausted
🧭 Bias: Bearish while price holds below $701.5300
⚠️ Invalidation: 4H close back above $701.5300
🔵 Support $701.5300 🟡 Resistance $729.9800
$QQQB $BTC #ChartPatterns
Education only, not financial advice.
🗓 Daily: Bearish — price below the daily Supertrend with a falling 50/200 EMA stack
⏱ 4H: Double Top · Bearish bias
⏳ 1H: price is under the level but the 1H trend is still up — a 1H close that flips the trend down is the trigger.
📋 WHY IT QUALIFIES
✓ Double Top structure completed
✓ Decisive breakdown — closed 0.5% beyond the line
✓ Volume 3.8× its 20-bar average
✓ RSI 43 — momentum confirms, not yet exhausted
🧭 Bias: Bearish while price holds below $701.5300
⚠️ Invalidation: 4H close back above $701.5300
🔵 Support $701.5300 🟡 Resistance $729.9800
$QQQB $BTC #ChartPatterns
Education only, not financial advice.
86
·
--
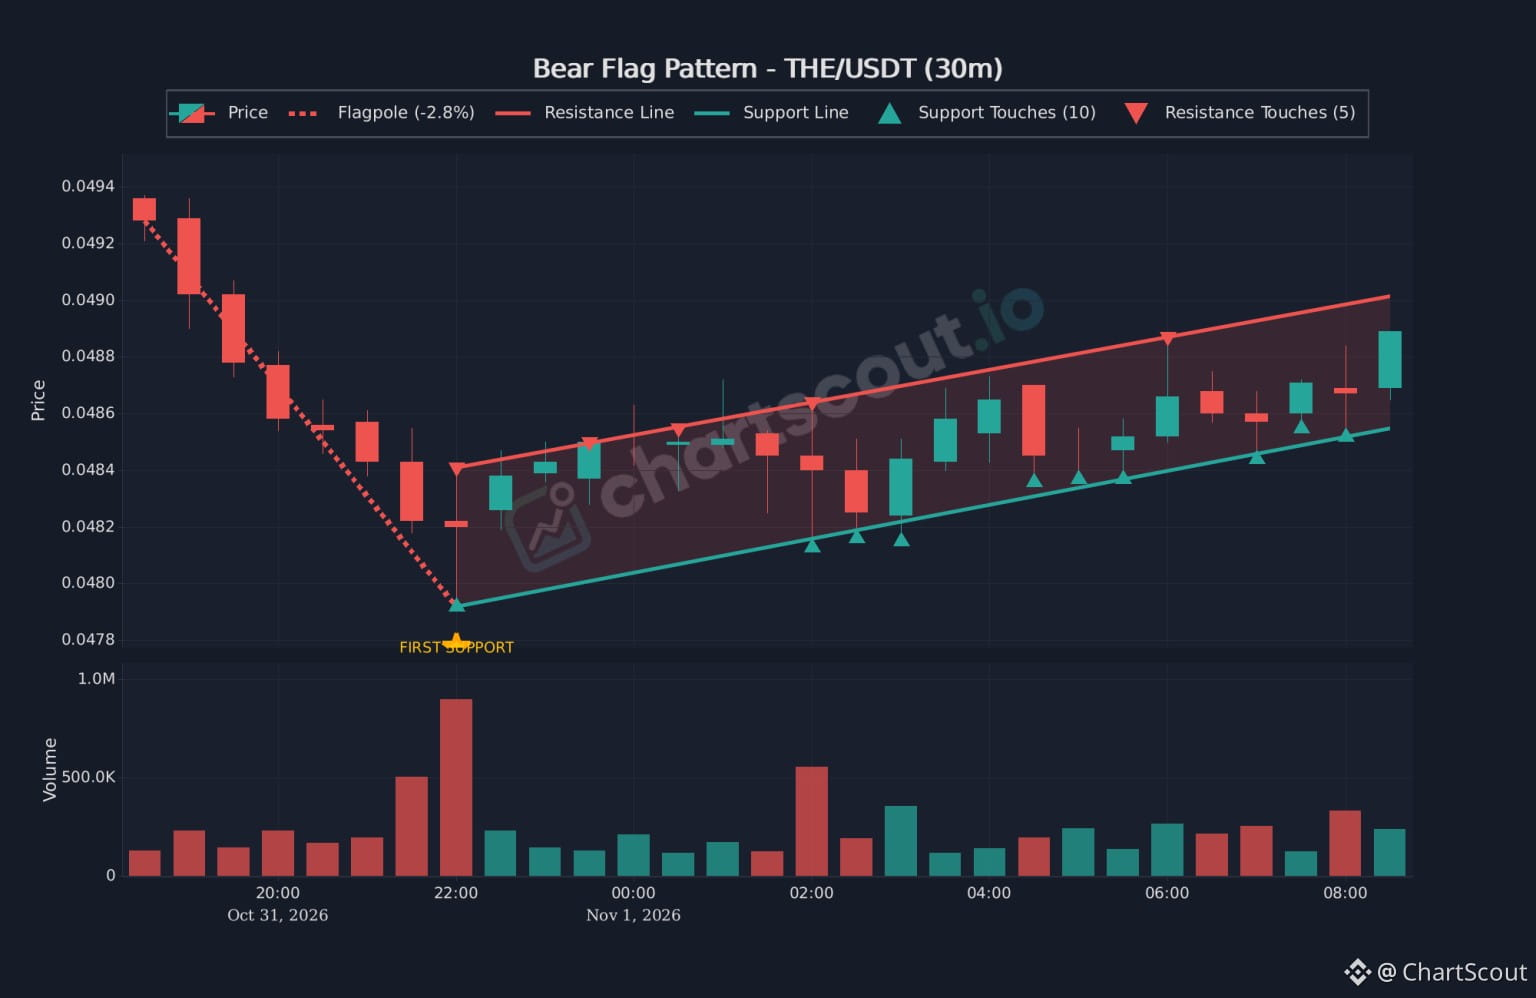
THE/USDT 30m: possible bear flag. 🔍
After a ~2.8% drop, price has been climbing inside a rising channel with 10 touches on the lower line and 5 on the upper. It's now near the top at about 0.0488–0.0490.
A bear flag only matters if price breaks the lower line, and a push above the upper line would invalidate the idea, so neither side is confirmed yet.
Spotted with ChartScout's pattern scanner (free trial in our profile).
#the #chartpatterns #TechnicalAnalysis
THE/USDT 30m: possible bear flag. 🔍
After a ~2.8% drop, price has been climbing inside a rising channel with 10 touches on the lower line and 5 on the upper. It's now near the top at about 0.0488–0.0490.
A bear flag only matters if price breaks the lower line, and a push above the upper line would invalidate the idea, so neither side is confirmed yet.
Spotted with ChartScout's pattern scanner (free trial in our profile).
#the #chartpatterns #TechnicalAnalysis
After a ~2.8% drop, price has been climbing inside a rising channel with 10 touches on the lower line and 5 on the upper. It's now near the top at about 0.0488–0.0490.
A bear flag only matters if price breaks the lower line, and a push above the upper line would invalidate the idea, so neither side is confirmed yet.
Spotted with ChartScout's pattern scanner (free trial in our profile).
#the #chartpatterns #TechnicalAnalysis
1
452
·
--
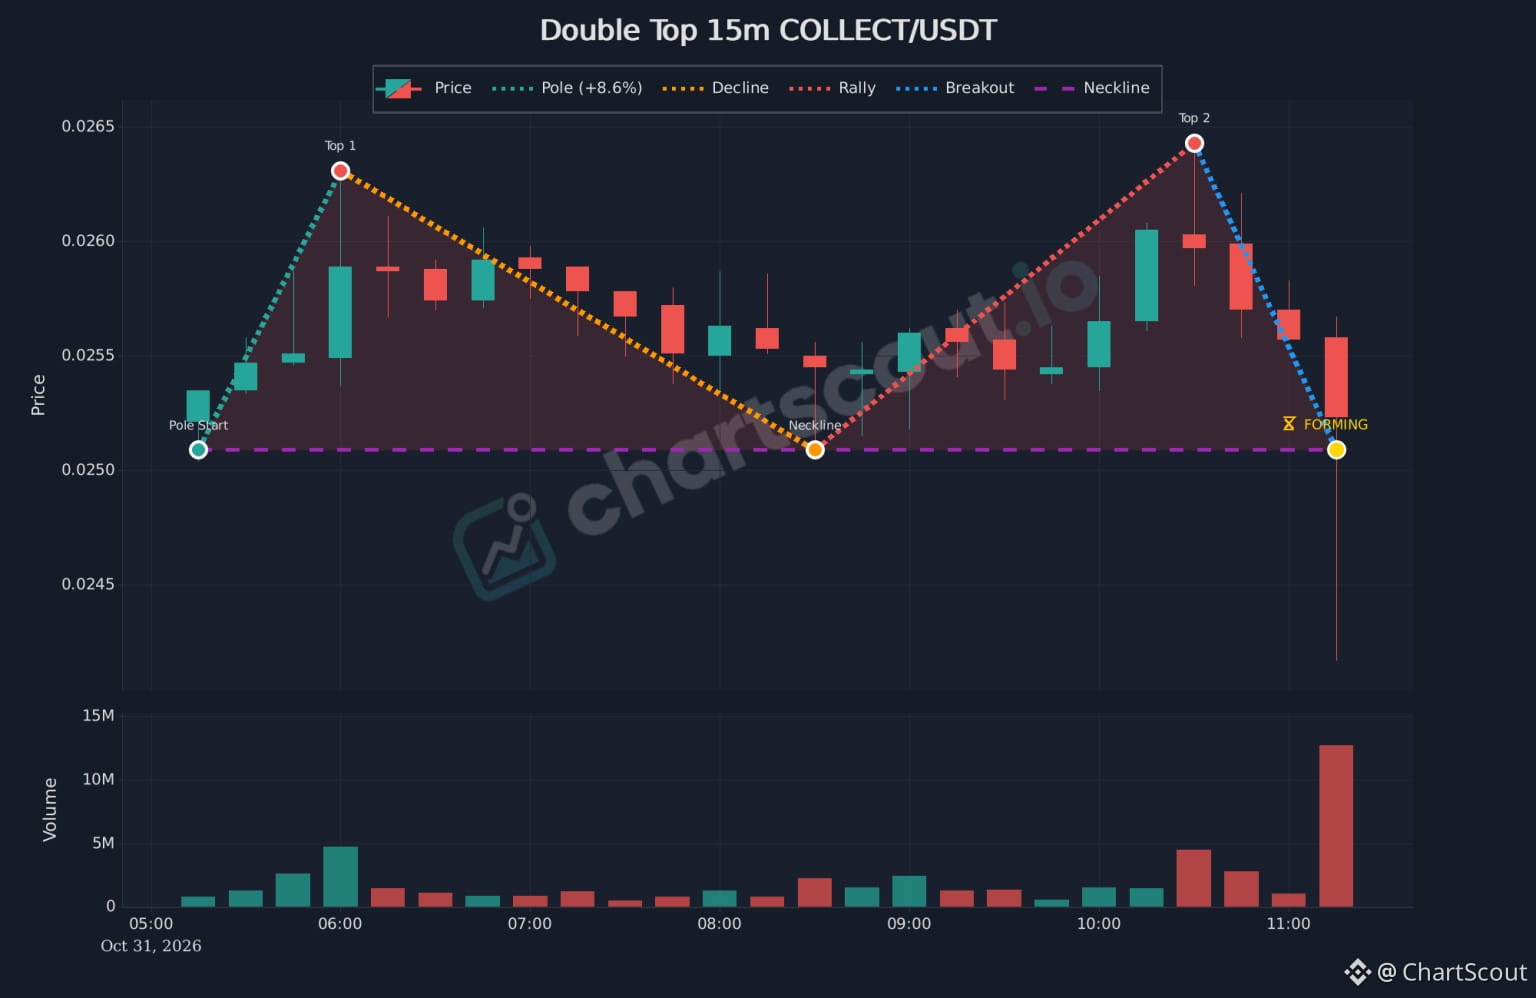
COLLECT/USDT 15m: double top forming. 🔍
After an 8.6% rise, price made two tops near 0.0263–0.0264 and is now testing the neckline around 0.0251. The latest candle printed heavy volume with a long wick below the line.
A double top isn't confirmed until a candle closes below the neckline, so a wick alone isn't enough.
Spotted with ChartScout's pattern scanner (free trial in our profile).
#collect #chartpatterns #TechnicalAnalysis #COLLECTUSDT
COLLECT/USDT 15m: double top forming. 🔍
After an 8.6% rise, price made two tops near 0.0263–0.0264 and is now testing the neckline around 0.0251. The latest candle printed heavy volume with a long wick below the line.
A double top isn't confirmed until a candle closes below the neckline, so a wick alone isn't enough.
Spotted with ChartScout's pattern scanner (free trial in our profile).
#collect #chartpatterns #TechnicalAnalysis #COLLECTUSDT
After an 8.6% rise, price made two tops near 0.0263–0.0264 and is now testing the neckline around 0.0251. The latest candle printed heavy volume with a long wick below the line.
A double top isn't confirmed until a candle closes below the neckline, so a wick alone isn't enough.
Spotted with ChartScout's pattern scanner (free trial in our profile).
#collect #chartpatterns #TechnicalAnalysis #COLLECTUSDT
635
·
--
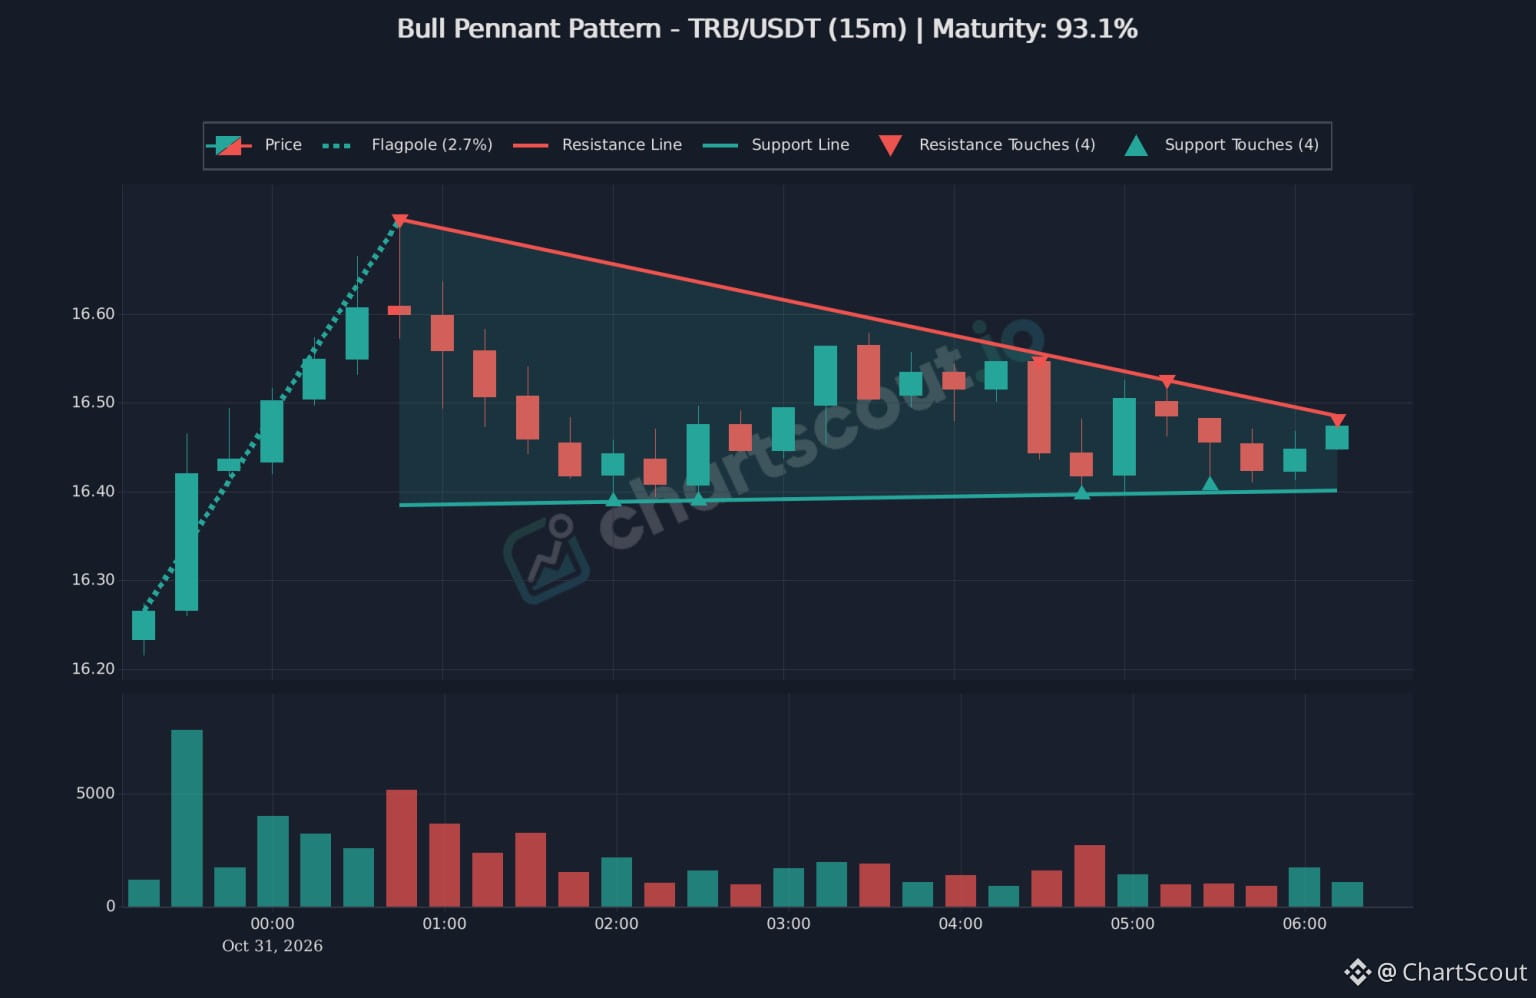
TRB/USDT 15m : bull pennant tightening. 🔍
A +2.7% pole, then a converging pennant with 4 touches on both lines. Price is pressing the upper line near 16.48 while support holds around 16.40.
A pennant is only a pattern, so watch for a clean 15m close beyond either line before drawing conclusions.
Spotted with ChartScout's pattern scanner (free trial in our profile).
#TRB #chartpatterns #TechnicalAnalysis
TRB/USDT 15m : bull pennant tightening. 🔍
A +2.7% pole, then a converging pennant with 4 touches on both lines. Price is pressing the upper line near 16.48 while support holds around 16.40.
A pennant is only a pattern, so watch for a clean 15m close beyond either line before drawing conclusions.
Spotted with ChartScout's pattern scanner (free trial in our profile).
#TRB #chartpatterns #TechnicalAnalysis
A +2.7% pole, then a converging pennant with 4 touches on both lines. Price is pressing the upper line near 16.48 while support holds around 16.40.
A pennant is only a pattern, so watch for a clean 15m close beyond either line before drawing conclusions.
Spotted with ChartScout's pattern scanner (free trial in our profile).
#TRB #chartpatterns #TechnicalAnalysis
1
678
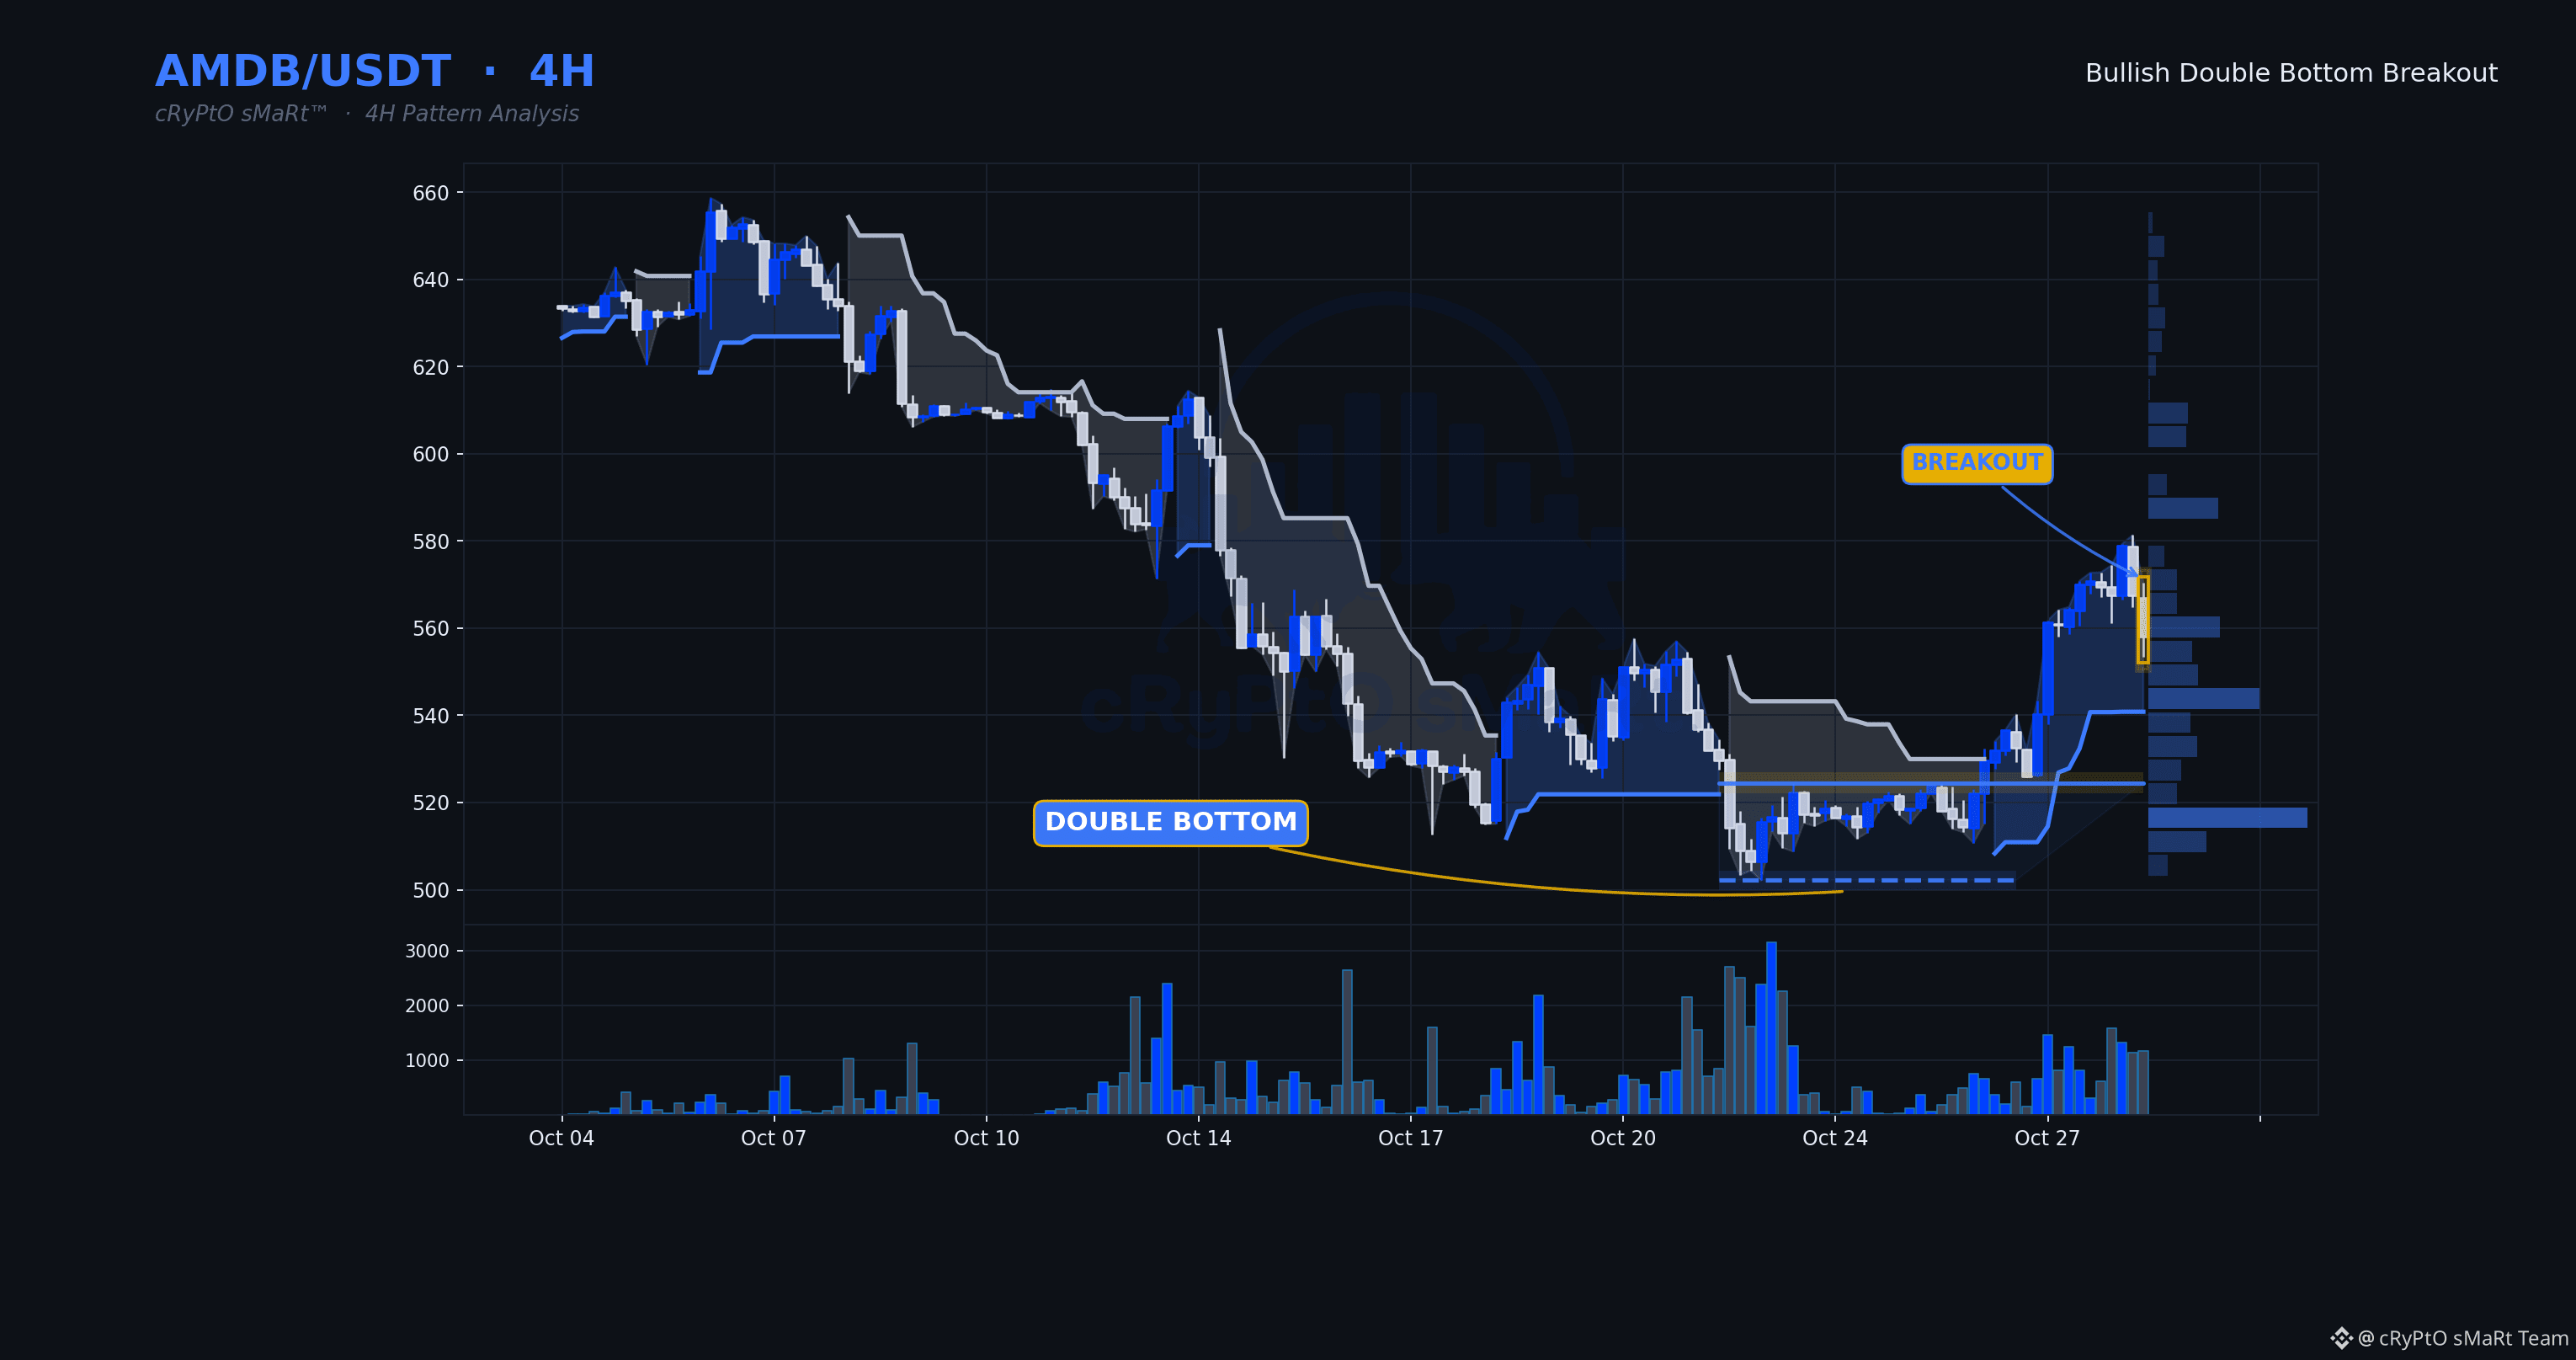
Double bottom resolving higher on a decisive breakout, and the volume behind it confirms buyers forced the issue rather than drifted into it. Momentum still has room, which matters — this isn't a stretched move chasing exhaustion, it's early-stage control shifting to the bulls.
🗓 Daily: Neutral — daily is mixed — Supertrend and EMAs not aligned
⏱ 4H: Double Bottom · Bullish bias
⏳ 1H: price is above the level but the 1H trend hasn't turned up yet — a 1H close that flips the trend up is the trigger.
📋 WHY IT QUALIFIES
✓ Double Bottom structure completed
✓ Decisive breakout — closed 6.4% beyond the line
✓ Volume 1.6× its 20-bar average
✓ RSI 57 — momentum confirms, not yet exhausted
🧭 Bias: Bullish while price holds above $524.5000
⚠️ Invalidation: 4H close back below $524.5000
🔵 Support $502.1500 🟡 Resistance $524.5000
$AMDB $BTC #ChartPatterns
Education only, not financial advice.
Double bottom resolving higher on a decisive breakout, and the volume behind it confirms buyers forced the issue rather than drifted into it. Momentum still has room, which matters — this isn't a stretched move chasing exhaustion, it's early-stage control shifting to the bulls.
🗓 Daily: Neutral — daily is mixed — Supertrend and EMAs not aligned
⏱ 4H: Double Bottom · Bullish bias
⏳ 1H: price is above the level but the 1H trend hasn't turned up yet — a 1H close that flips the trend up is the trigger.
📋 WHY IT QUALIFIES
✓ Double Bottom structure completed
✓ Decisive breakout — closed 6.4% beyond the line
✓ Volume 1.6× its 20-bar average
✓ RSI 57 — momentum confirms, not yet exhausted
🧭 Bias: Bullish while price holds above $524.5000
⚠️ Invalidation: 4H close back below $524.5000
🔵 Support $502.1500 🟡 Resistance $524.5000
$AMDB $BTC #ChartPatterns
Education only, not financial advice.
🗓 Daily: Neutral — daily is mixed — Supertrend and EMAs not aligned
⏱ 4H: Double Bottom · Bullish bias
⏳ 1H: price is above the level but the 1H trend hasn't turned up yet — a 1H close that flips the trend up is the trigger.
📋 WHY IT QUALIFIES
✓ Double Bottom structure completed
✓ Decisive breakout — closed 6.4% beyond the line
✓ Volume 1.6× its 20-bar average
✓ RSI 57 — momentum confirms, not yet exhausted
🧭 Bias: Bullish while price holds above $524.5000
⚠️ Invalidation: 4H close back below $524.5000
🔵 Support $502.1500 🟡 Resistance $524.5000
$AMDB $BTC #ChartPatterns
Education only, not financial advice.
22
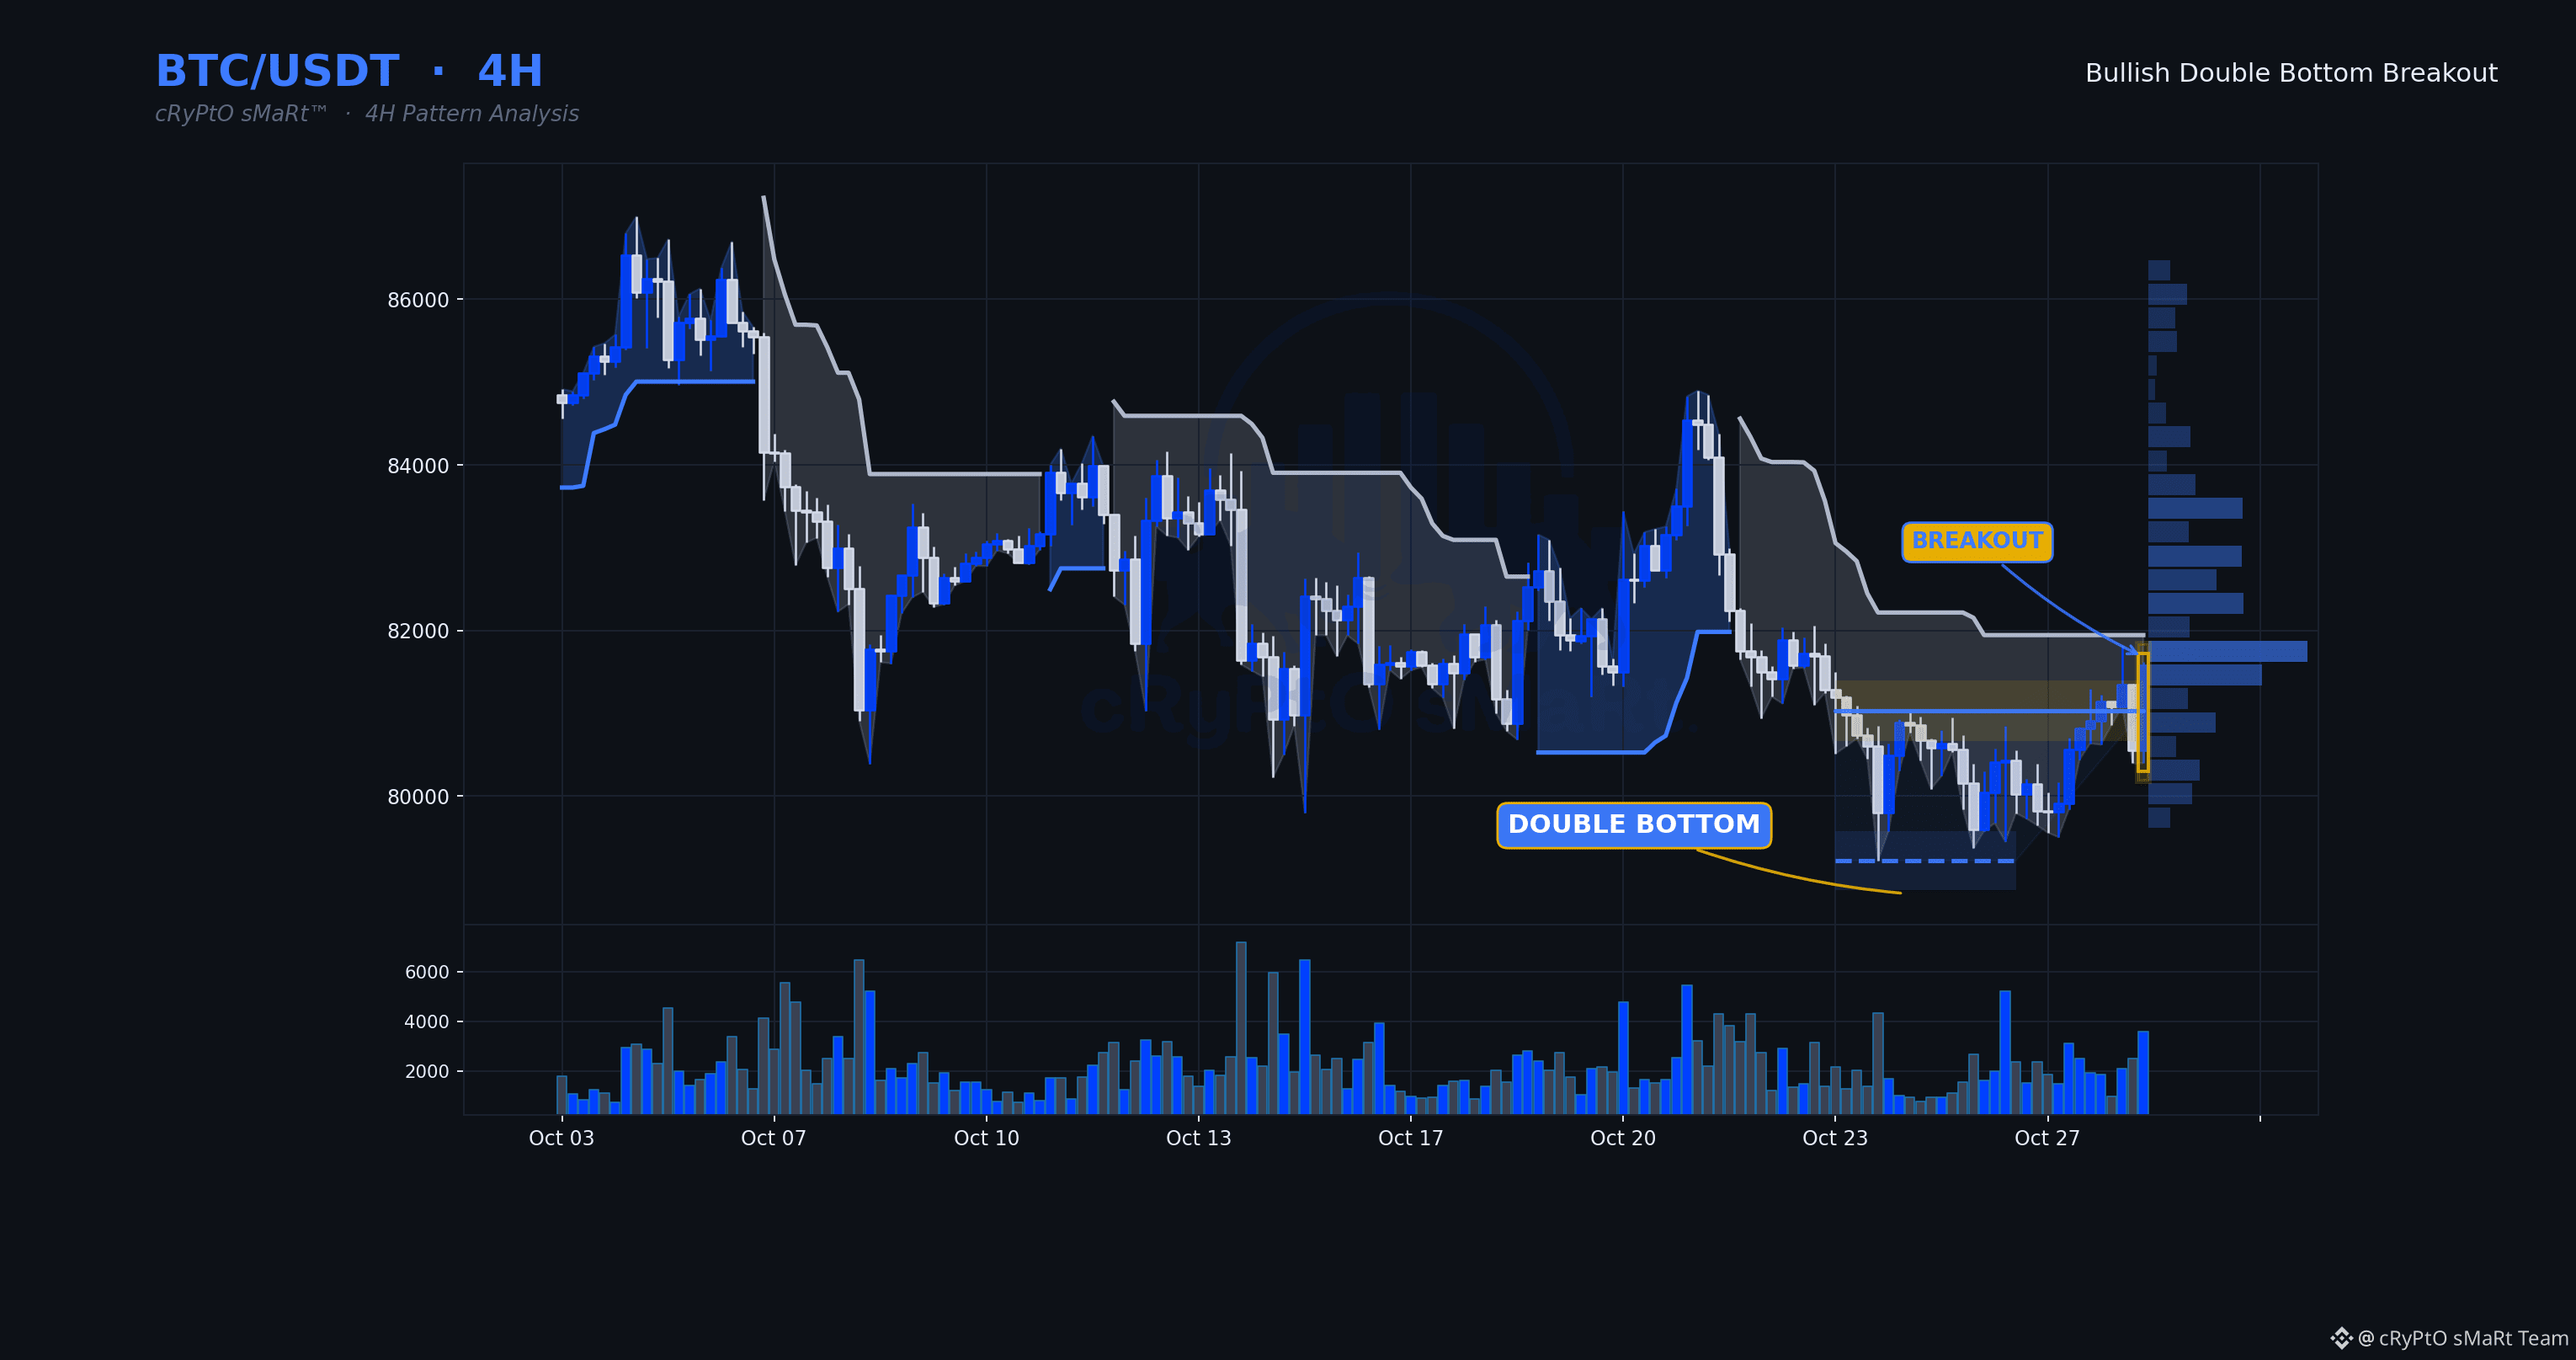
Double bottom resolving higher with volume stepping up well above average on the break — that's demand showing up with conviction, not a quiet drift through resistance. Momentum still has room, meaning this isn't a stretched move chasing itself into exhaustion.
🗓 Daily: Neutral — daily is mixed — Supertrend and EMAs not aligned
⏱ 4H: Double Bottom · Bullish bias
⏳ 1H: price is above the level but the 1H trend hasn't turned up yet — a 1H close that flips the trend up is the trigger.
📋 WHY IT QUALIFIES
✓ Double Bottom structure completed
✓ Decisive breakout — closed 0.7% beyond the line
✓ Volume 1.7× its 20-bar average
✓ RSI 59 — momentum confirms, not yet exhausted
🧭 Bias: Bullish while price holds above $81,033.69
⚠️ Invalidation: 4H close back below $81,033.69
🔵 Support $79,220.74 🟡 Resistance $81,033.69
$BTC #ChartPatterns
Education only, not financial advice.
Double bottom resolving higher with volume stepping up well above average on the break — that's demand showing up with conviction, not a quiet drift through resistance. Momentum still has room, meaning this isn't a stretched move chasing itself into exhaustion.
🗓 Daily: Neutral — daily is mixed — Supertrend and EMAs not aligned
⏱ 4H: Double Bottom · Bullish bias
⏳ 1H: price is above the level but the 1H trend hasn't turned up yet — a 1H close that flips the trend up is the trigger.
📋 WHY IT QUALIFIES
✓ Double Bottom structure completed
✓ Decisive breakout — closed 0.7% beyond the line
✓ Volume 1.7× its 20-bar average
✓ RSI 59 — momentum confirms, not yet exhausted
🧭 Bias: Bullish while price holds above $81,033.69
⚠️ Invalidation: 4H close back below $81,033.69
🔵 Support $79,220.74 🟡 Resistance $81,033.69
$BTC #ChartPatterns
Education only, not financial advice.
🗓 Daily: Neutral — daily is mixed — Supertrend and EMAs not aligned
⏱ 4H: Double Bottom · Bullish bias
⏳ 1H: price is above the level but the 1H trend hasn't turned up yet — a 1H close that flips the trend up is the trigger.
📋 WHY IT QUALIFIES
✓ Double Bottom structure completed
✓ Decisive breakout — closed 0.7% beyond the line
✓ Volume 1.7× its 20-bar average
✓ RSI 59 — momentum confirms, not yet exhausted
🧭 Bias: Bullish while price holds above $81,033.69
⚠️ Invalidation: 4H close back below $81,033.69
🔵 Support $79,220.74 🟡 Resistance $81,033.69
$BTC #ChartPatterns
Education only, not financial advice.
40
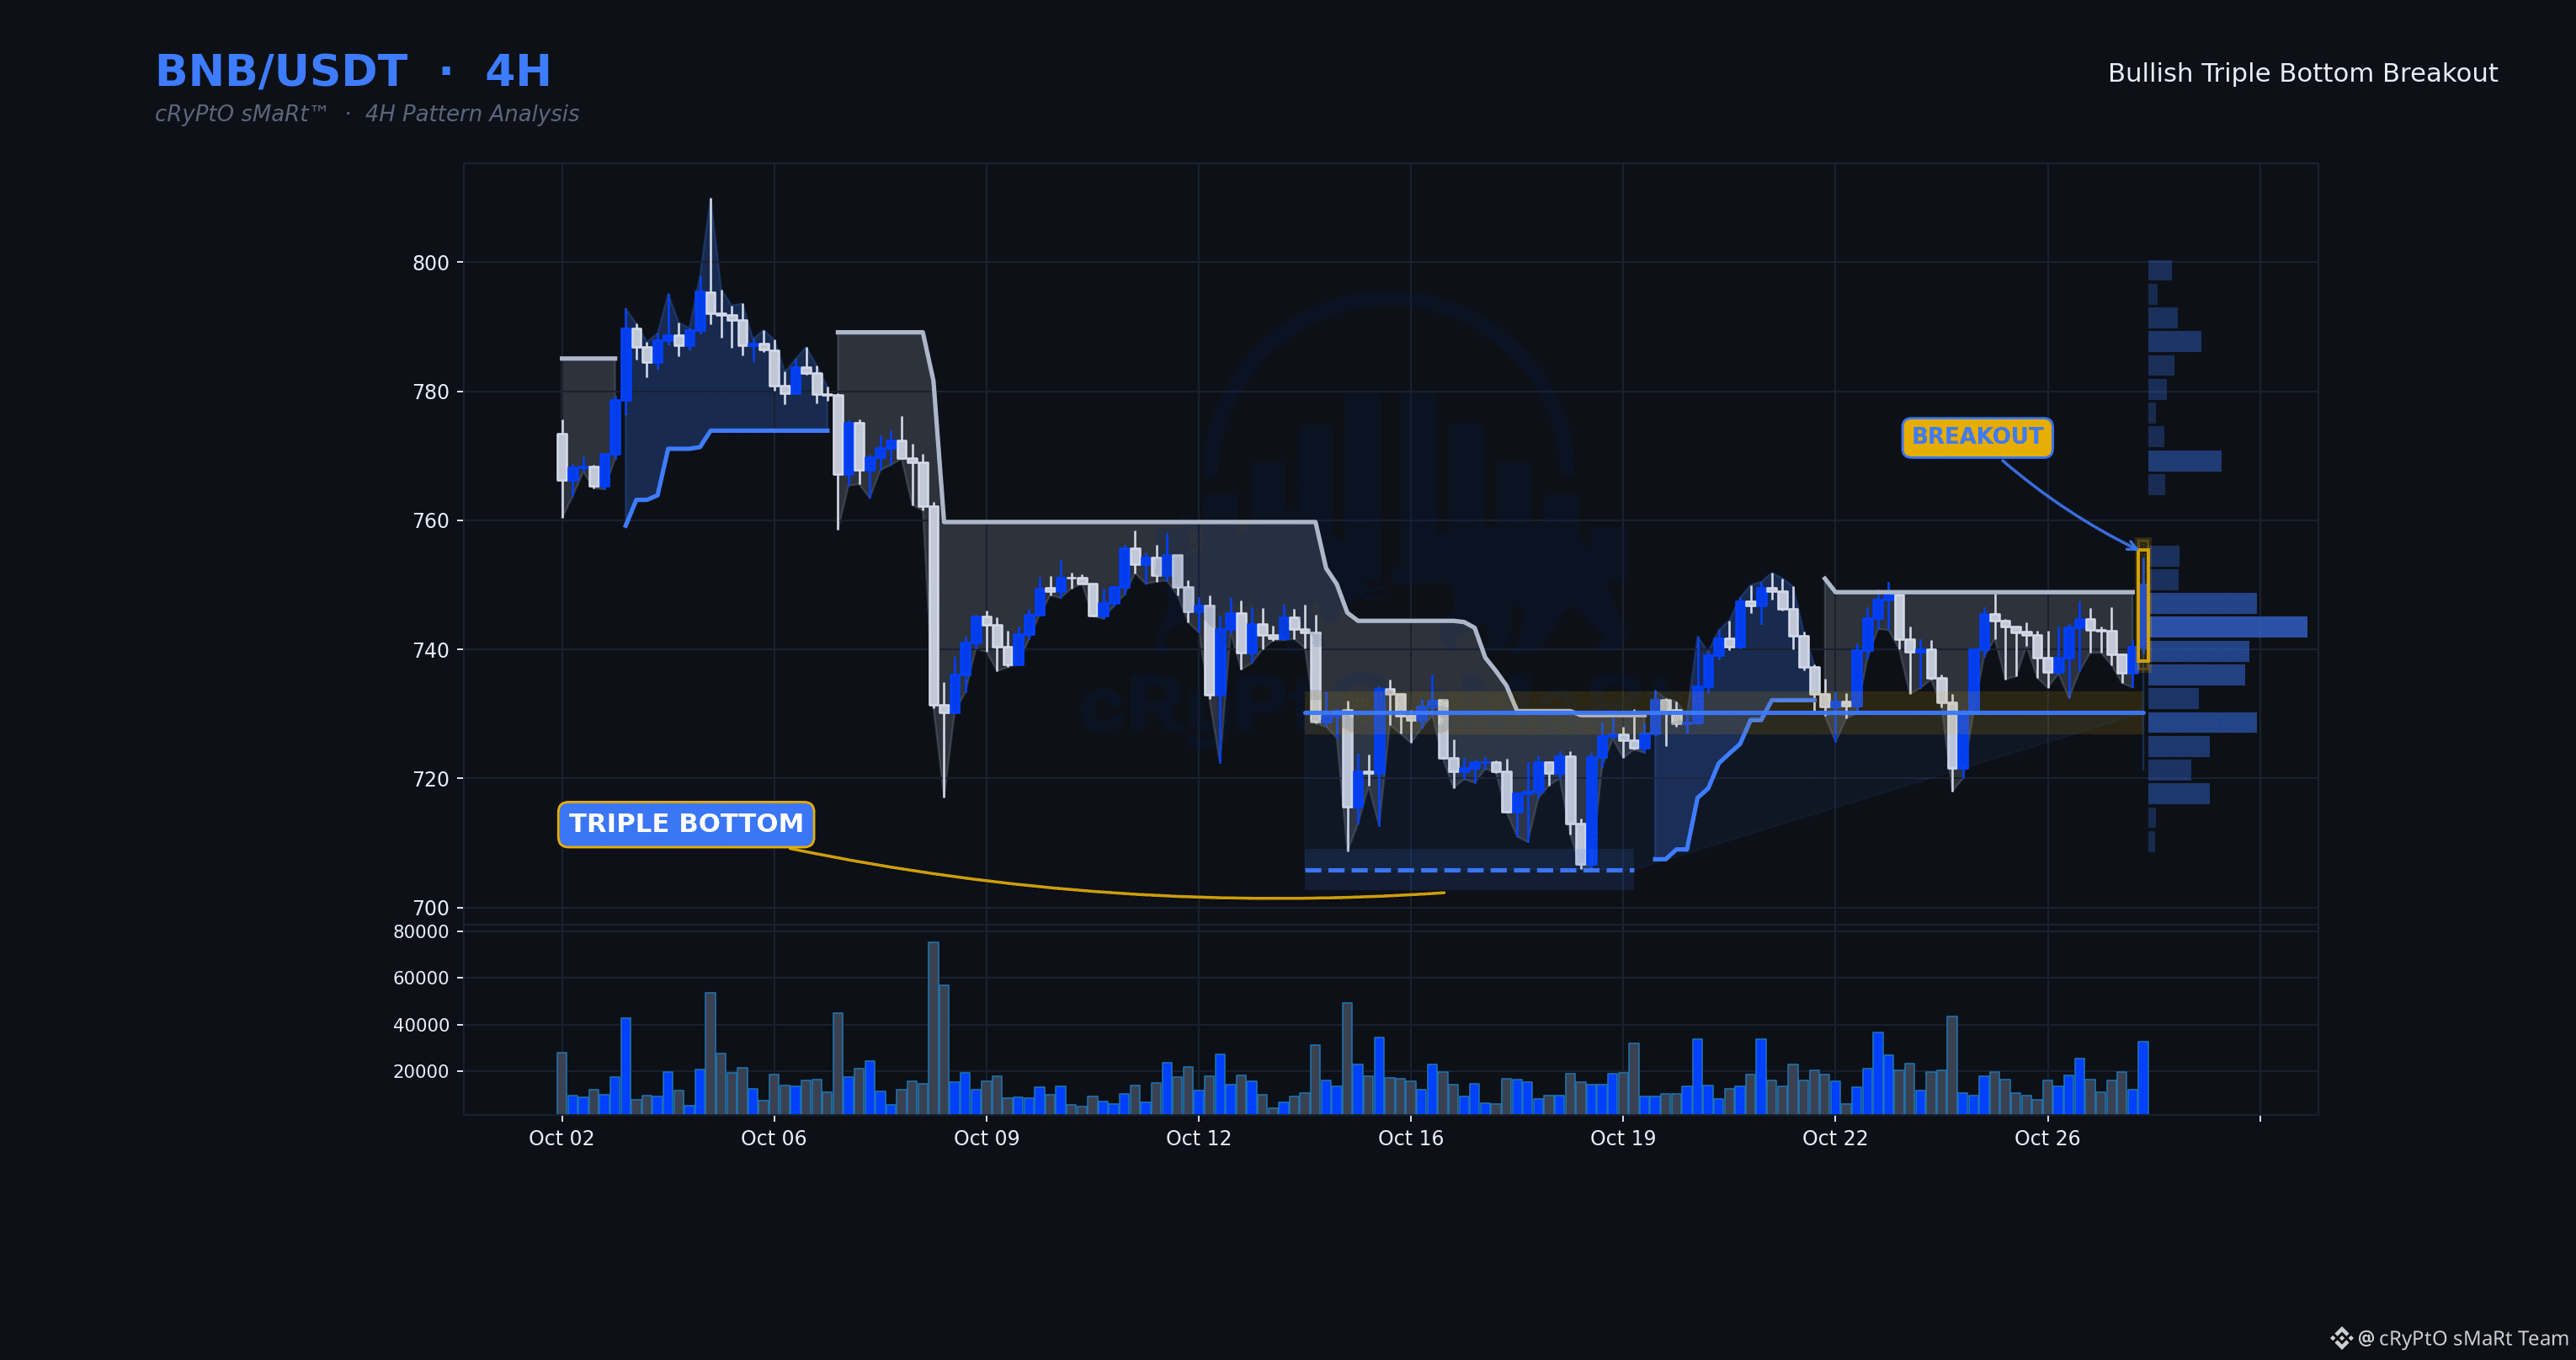
Three failed attempts at the same floor, then a clean break through on volume well above average — that's not a retest grind, that's buyers finally overwhelming the level that held three times.
🗓 Daily: Neutral — daily is mixed — Supertrend and EMAs not aligned
⏱ 4H: Triple Bottom · Bullish bias
⏳ 1H: the 1H is holding above the level with its trend up — the lower timeframe confirms the setup.
📋 WHY IT QUALIFIES
✓ Triple Bottom structure completed
✓ Decisive breakout — closed 2.7% beyond the line
✓ Volume 1.9× its 20-bar average
✓ RSI 61 — momentum confirms, not yet exhausted
🧭 Bias: Bullish while price holds above $730.1900
⚠️ Invalidation: 4H close back below $730.1900
🔵 Support $705.8600 🟡 Resistance $730.1900
$BNB $BTC #ChartPatterns
Education only, not financial advice.
Three failed attempts at the same floor, then a clean break through on volume well above average — that's not a retest grind, that's buyers finally overwhelming the level that held three times.
🗓 Daily: Neutral — daily is mixed — Supertrend and EMAs not aligned
⏱ 4H: Triple Bottom · Bullish bias
⏳ 1H: the 1H is holding above the level with its trend up — the lower timeframe confirms the setup.
📋 WHY IT QUALIFIES
✓ Triple Bottom structure completed
✓ Decisive breakout — closed 2.7% beyond the line
✓ Volume 1.9× its 20-bar average
✓ RSI 61 — momentum confirms, not yet exhausted
🧭 Bias: Bullish while price holds above $730.1900
⚠️ Invalidation: 4H close back below $730.1900
🔵 Support $705.8600 🟡 Resistance $730.1900
$BNB $BTC #ChartPatterns
Education only, not financial advice.
🗓 Daily: Neutral — daily is mixed — Supertrend and EMAs not aligned
⏱ 4H: Triple Bottom · Bullish bias
⏳ 1H: the 1H is holding above the level with its trend up — the lower timeframe confirms the setup.
📋 WHY IT QUALIFIES
✓ Triple Bottom structure completed
✓ Decisive breakout — closed 2.7% beyond the line
✓ Volume 1.9× its 20-bar average
✓ RSI 61 — momentum confirms, not yet exhausted
🧭 Bias: Bullish while price holds above $730.1900
⚠️ Invalidation: 4H close back below $730.1900
🔵 Support $705.8600 🟡 Resistance $730.1900
$BNB $BTC #ChartPatterns
Education only, not financial advice.
50
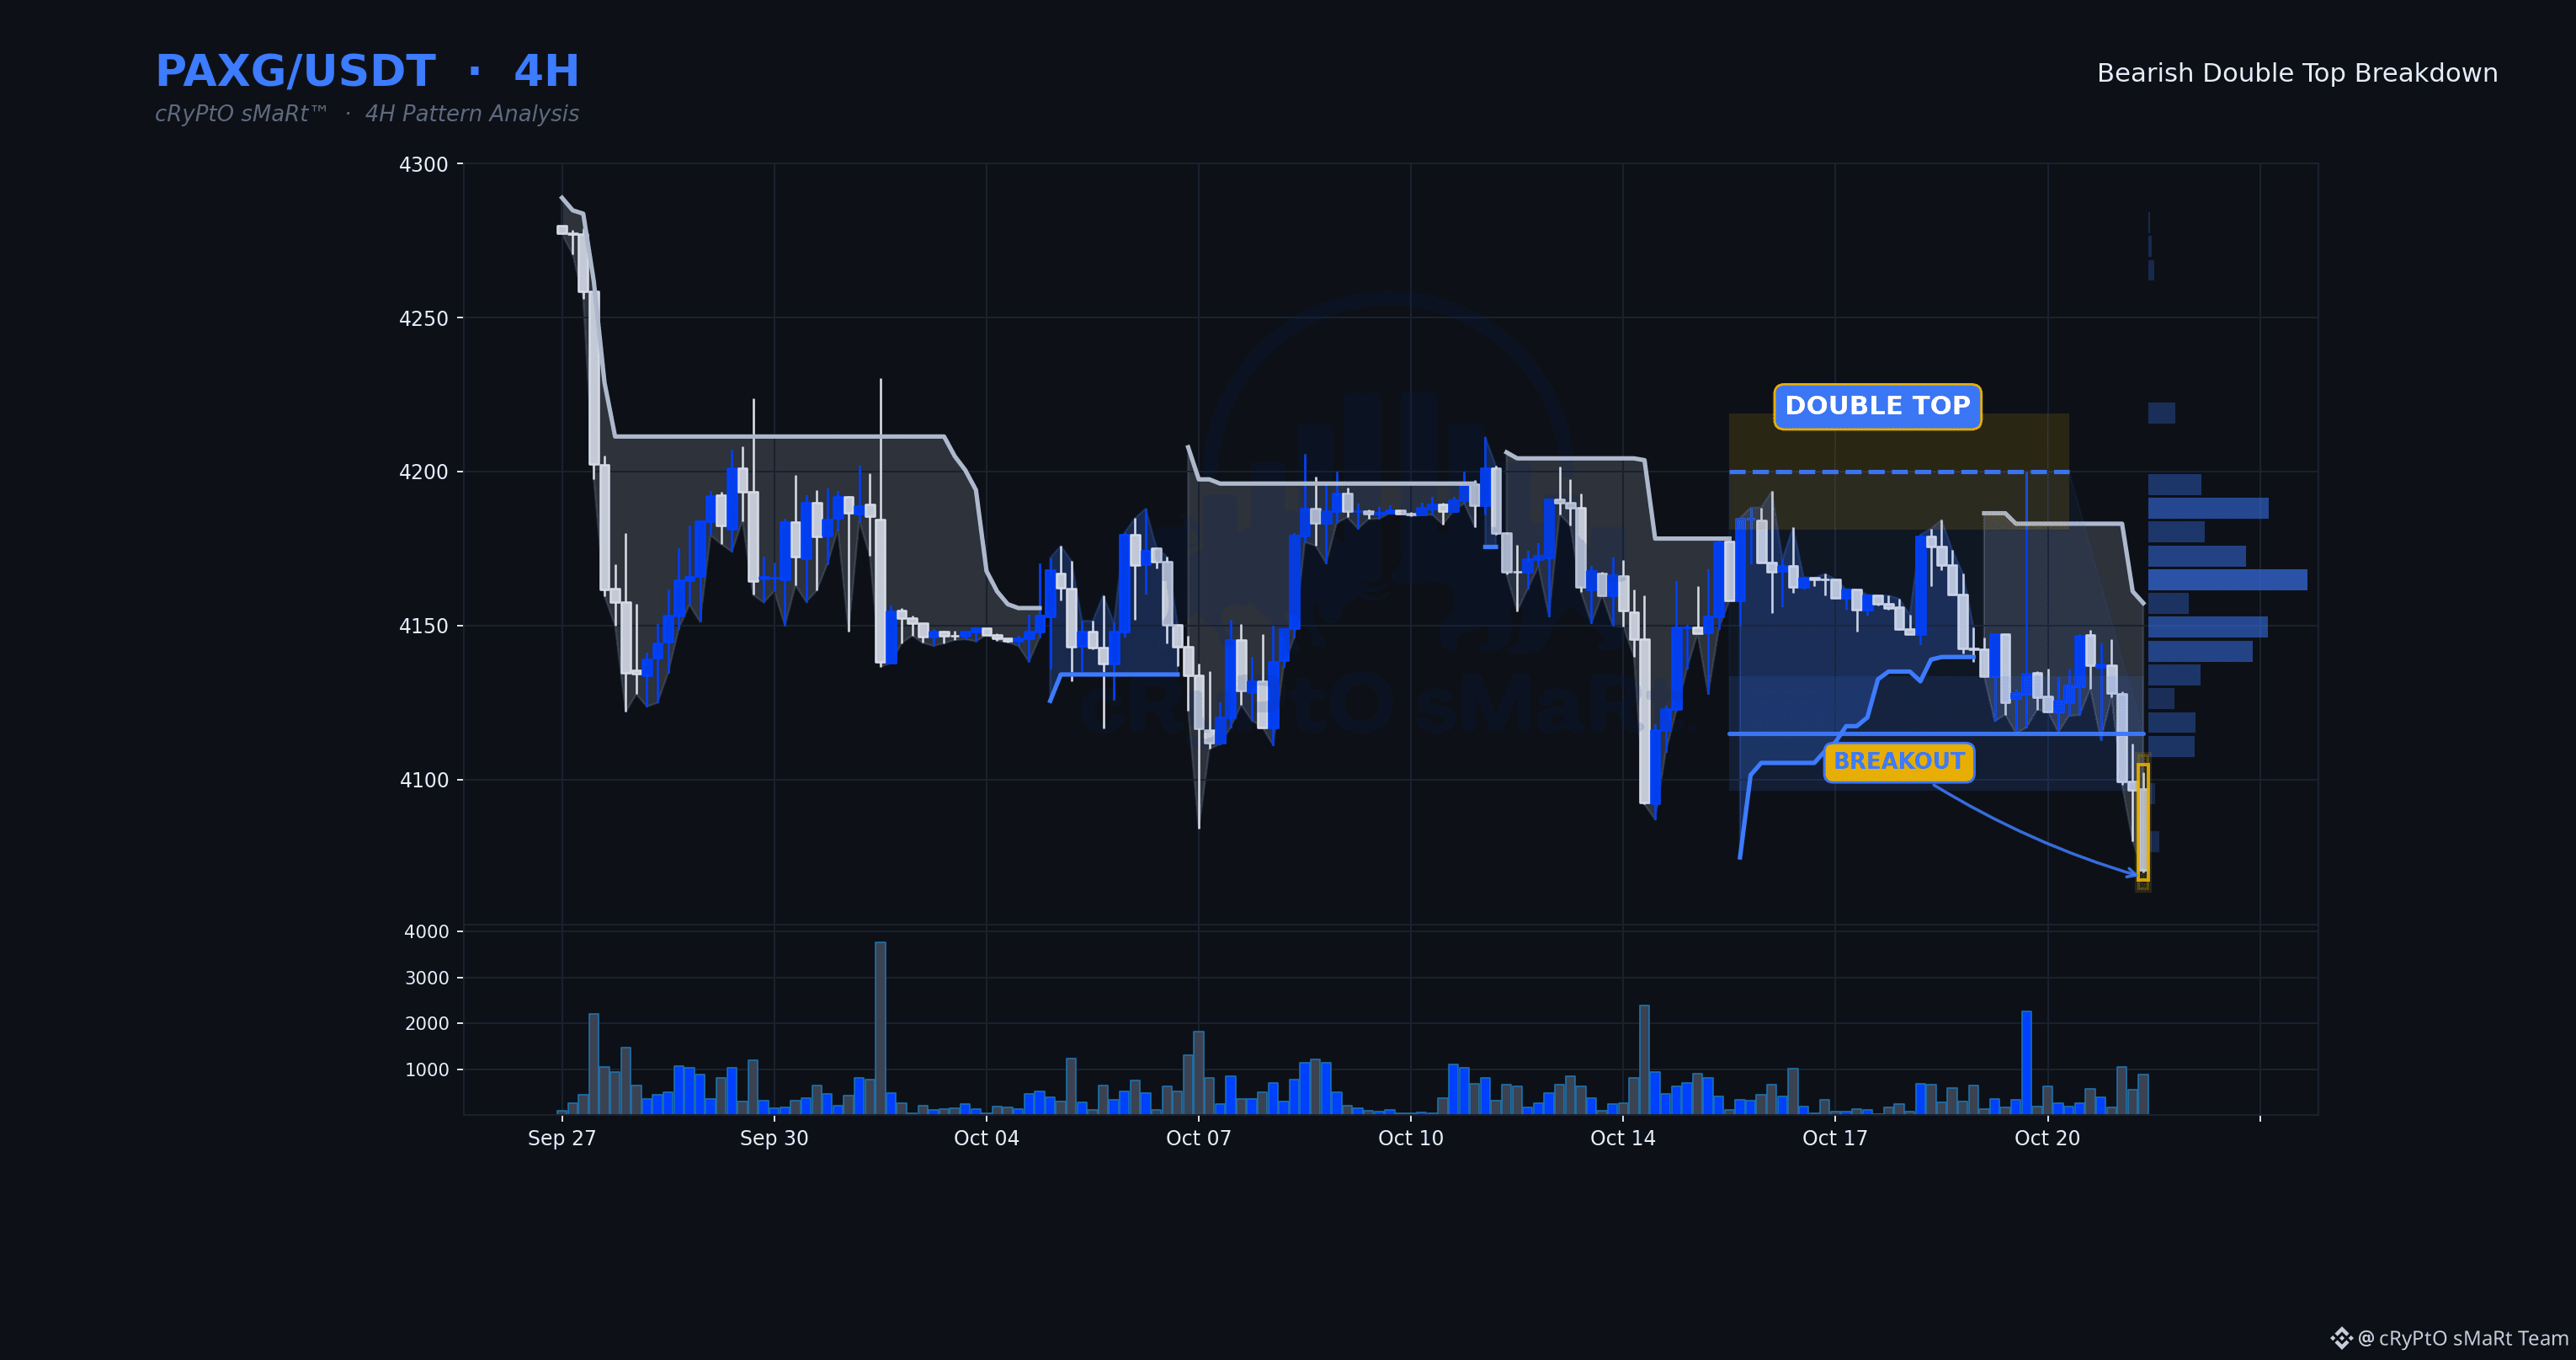
Sellers just took the neckline out with volume stepping up, not fading — that's the detail that separates a real breakdown from a trap. Two failed attempts at the top now read as distribution, and the decisive close through structure confirms sellers were in control the whole time.
🗓 Daily: Bearish — price below the daily Supertrend with a falling 50/200 EMA stack
⏱ 4H: Double Top · Bearish bias
⏳ 1H: the 1H is trading below the level with its trend down — the lower timeframe confirms the setup.
✅ Daily, 4H and 1H all point bearish.
📋 WHY IT QUALIFIES
✓ Double Top structure completed
✓ Decisive breakdown — closed 1.1% beyond the line
✓ Volume 1.7× its 20-bar average
✓ RSI 27 — momentum confirms, not yet exhausted
🧭 Bias: Bearish while price holds below $4,115.00
⚠️ Invalidation: 4H close back above $4,115.00
🔵 Support $4,115.00 🟡 Resistance $4,200.00
$PAXG $BTC #ChartPatterns
Education only, not financial advice.
Sellers just took the neckline out with volume stepping up, not fading — that's the detail that separates a real breakdown from a trap. Two failed attempts at the top now read as distribution, and the decisive close through structure confirms sellers were in control the whole time.
🗓 Daily: Bearish — price below the daily Supertrend with a falling 50/200 EMA stack
⏱ 4H: Double Top · Bearish bias
⏳ 1H: the 1H is trading below the level with its trend down — the lower timeframe confirms the setup.
✅ Daily, 4H and 1H all point bearish.
📋 WHY IT QUALIFIES
✓ Double Top structure completed
✓ Decisive breakdown — closed 1.1% beyond the line
✓ Volume 1.7× its 20-bar average
✓ RSI 27 — momentum confirms, not yet exhausted
🧭 Bias: Bearish while price holds below $4,115.00
⚠️ Invalidation: 4H close back above $4,115.00
🔵 Support $4,115.00 🟡 Resistance $4,200.00
$PAXG $BTC #ChartPatterns
Education only, not financial advice.
🗓 Daily: Bearish — price below the daily Supertrend with a falling 50/200 EMA stack
⏱ 4H: Double Top · Bearish bias
⏳ 1H: the 1H is trading below the level with its trend down — the lower timeframe confirms the setup.
✅ Daily, 4H and 1H all point bearish.
📋 WHY IT QUALIFIES
✓ Double Top structure completed
✓ Decisive breakdown — closed 1.1% beyond the line
✓ Volume 1.7× its 20-bar average
✓ RSI 27 — momentum confirms, not yet exhausted
🧭 Bias: Bearish while price holds below $4,115.00
⚠️ Invalidation: 4H close back above $4,115.00
🔵 Support $4,115.00 🟡 Resistance $4,200.00
$PAXG $BTC #ChartPatterns
Education only, not financial advice.
143

·
--
Article
📊 LEARNING CHART PATTERNS ON THE CHARTA practical guide to recognizing, confirming, and understanding chart patterns.
Learning Chart Patterns on the Chart
If you have ever opened someone else's breakdown, you have probably seen flags, triangles, head and shoulders, and more.
A beginner may think experienced traders know some secret.
No.
They recognize repeating shapes and understand what those shapes can tell us about market behaviour.
In this guide, we'll break down five useful chart patterns, how to confirm them, and where beginners commonly get them wrong.
THEORY
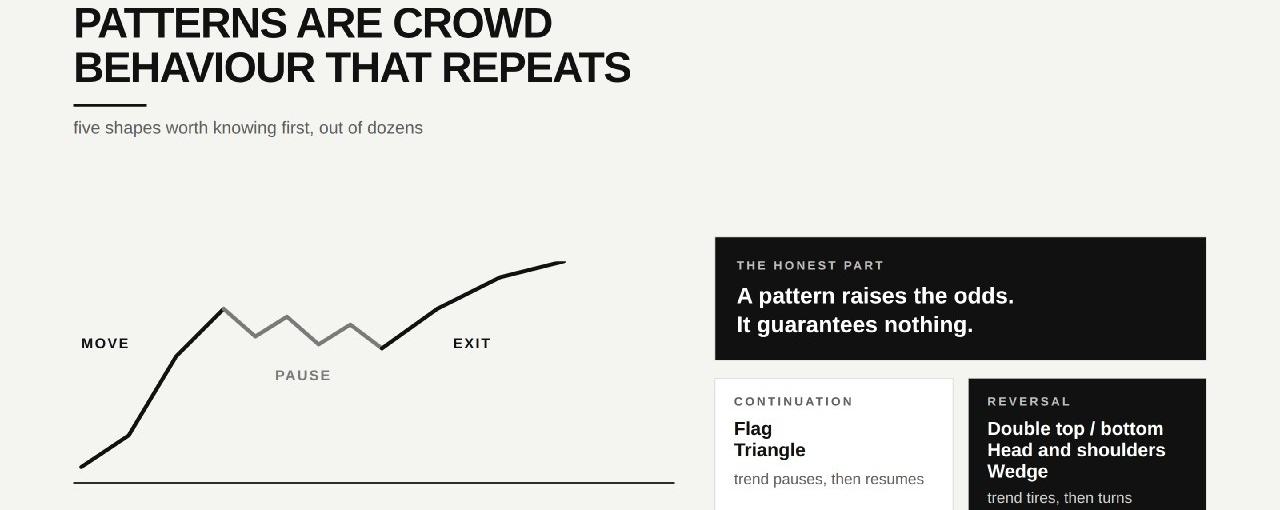
A pattern is a repeating form of crowd behaviour on the chart.
Most patterns can be understood through:
A MOVE → A PAUSE → A BREAKOUT
During the pause, buyers and sellers fight over price. The resulting shape can hint at which side is gaining strength.
A pattern raises the odds. It guarantees nothing.
The two main categories are:
Continuation Patterns
The current trend pauses and may continue.
Reversal Patterns
The existing trend loses momentum and may reverse.
THE FLAG
A flag starts with a sharp move known as the flagpole, followed by a short consolidation forming a small channel against the original trend.
After the pause, price may break out and continue in the original direction.
After a strong impulse, some traders take profits and price pulls back, but sellers may not have enough strength to reverse the market.
Volume inside the flag usually fades, while breakout volume can expand.
A bearish flag is the same structure in reverse: sharp drop → upward-sloping channel → potential continuation lower.
THE TRIANGLE
A triangle forms when price gets squeezed between two converging lines.
Ascending Triangle
Flat resistance + rising lows. Buyers repeatedly test the same level.
Descending Triangle
Flat support + falling highs. Sellers repeatedly pressure the same floor.
Symmetrical Triangle
Both trendlines converge, leaving the breakout direction to decide the next move.
Volume often decreases inside the triangle and increases when price breaks out.
DOUBLE TOP & DOUBLE BOTTOM
The idea is simple:
Two failed attempts to break the same level.
Double Top
Price reaches a high twice and fails both times. The dip between them creates the neckline.
A close below the neckline can confirm a bearish reversal.
Double Bottom
Price tests the same low twice and sellers fail to break it.
A close above the neckline can confirm a bullish reversal.
HEAD & SHOULDERS
The classic structure has three peaks:
LEFT SHOULDER → HEAD → RIGHT SHOULDER
The middle peak is the highest.
If buyers cannot push the right shoulder toward the head, bullish strength may be fading.
The neckline connects the lows beneath the structure.
A close below the neckline, preferably with increasing volume, strengthens the bearish confirmation.
The inverse Head and Shoulders can appear at market bottoms and signal a potential reversal upward.
THE WEDGE
A wedge forms when both trendlines slope in the same direction while gradually converging.
Rising Wedge
Price makes higher highs, but momentum weakens. It most often warns of a potential drop.
Falling Wedge
Price makes lower lows, but selling pressure fades. It most often signals a potential rally.
The interesting part is that a wedge can look like continuation while actually warning that the trend is becoming tired.
HOW TO CONFIRM A PATTERN
Until a pattern is confirmed, it's just a drawing on the chart.
Candle Close
A wick beyond the level isn't enough. Look for the candle body to close beyond the pattern line.
Volume
A breakout with stronger participation is generally more convincing. Weak-volume breakouts can reverse.
Retest
After breaking out, price may return to test the broken level from the other side.
Resistance → Breakout → Retest → Support
If the level holds, confirmation becomes stronger.
WHERE BEGINNERS MESS UP
False Breakouts
Crypto can push through a pattern line with a wick, trigger traders, and immediately reverse. Don't enter on the first poke.
Patterns Everywhere
Once you learn patterns, every chart can start looking like one. 😂
If you have to hunt for the formation, it probably isn't clear enough.
Lower Timeframe vs Higher Timeframe
A bullish hourly flag inside a strong daily downtrend may simply be a temporary move against the bigger trend.
Always check:
Higher timeframe → Market direction → Lower timeframe setup
WHAT TO STUDY NEXT
These five patterns are only the starting point.
Other formations include:
Pennants
Rectangles
Cup and HandleTriple Tops
Triple Bottoms
Broadening Formations
Recommended Study
📚 Thomas Bulkowski — Encyclopedia of Chart Patterns
A major reference with statistics on historical pattern performance.
📚 John Murphy — Technical Analysis of the Financial Markets
A classic technical-analysis resource covering chart patterns and market behaviour.
📚 Robert Edwards & John Magee — Technical Analysis of Stock Trends
A foundational work in traditional technical analysis, first published in 1948.
📚 BabyPips — School of Pipsology
A free, beginner-friendly resource for technical analysis.
FINAL THOUGHT
Theory without practice fades fast.
Study the pattern.
Find it on old charts.
Watch it form live.
Learn how it behaves.
Don't trade a pattern just because you can name it. Wait for confirmation.
And if you made it all the way here:
You're definitely not dumb. 😂📊
🔥 CHAINBALLER
Learn the chart. Understand the crowd. Wait for confirmation.
#ChainBaller #TradingEducation #ChartPatterns
$RLC $ZEC $SAND
📊 LEARNING CHART PATTERNS ON THE CHART
A practical guide to recognizing, confirming, and understanding chart patterns.
Learning Chart Patterns on the Chart
If you have ever opened someone else's breakdown, you have probably seen flags, triangles, head and shoulders, and more.
A beginner may think experienced traders know some secret.
No.
They recognize repeating shapes and understand what those shapes can tell us about market behaviour.
In this guide, we'll break down five useful chart patterns, how to confirm them, and where beginners commonly get them wrong.
THEORY
A pattern is a repeating form of crowd behaviour on the chart.
Most patterns can be understood through:
A MOVE → A PAUSE → A BREAKOUT
During the pause, buyers and sellers fight over price. The resulting shape can hint at which side is gaining strength.
A pattern raises the odds. It guarantees nothing.
The two main categories are:
Continuation Patterns
The current trend pauses and may continue.
Reversal Patterns
The existing trend loses momentum and may reverse.
THE FLAG
A flag starts with a sharp move known as the flagpole, followed by a short consolidation forming a small channel against the original trend.
After the pause, price may break out and continue in the original direction.
After a strong impulse, some traders take profits and price pulls back, but sellers may not have enough strength to reverse the market.
Volume inside the flag usually fades, while breakout volume can expand.
A bearish flag is the same structure in reverse: sharp drop → upward-sloping channel → potential continuation lower.
THE TRIANGLE
A triangle forms when price gets squeezed between two converging lines.
Ascending Triangle
Flat resistance + rising lows. Buyers repeatedly test the same level.
Descending Triangle
Flat support + falling highs. Sellers repeatedly pressure the same floor.
Symmetrical Triangle
Both trendlines converge, leaving the breakout direction to decide the next move.
Volume often decreases inside the triangle and increases when price breaks out.
DOUBLE TOP & DOUBLE BOTTOM
The idea is simple:
Two failed attempts to break the same level.
Double Top
Price reaches a high twice and fails both times. The dip between them creates the neckline.
A close below the neckline can confirm a bearish reversal.
Double Bottom
Price tests the same low twice and sellers fail to break it.
A close above the neckline can confirm a bullish reversal.
HEAD & SHOULDERS
The classic structure has three peaks:
LEFT SHOULDER → HEAD → RIGHT SHOULDER
The middle peak is the highest.
If buyers cannot push the right shoulder toward the head, bullish strength may be fading.
The neckline connects the lows beneath the structure.
A close below the neckline, preferably with increasing volume, strengthens the bearish confirmation.
The inverse Head and Shoulders can appear at market bottoms and signal a potential reversal upward.
THE WEDGE
A wedge forms when both trendlines slope in the same direction while gradually converging.
Rising Wedge
Price makes higher highs, but momentum weakens. It most often warns of a potential drop.
Falling Wedge
Price makes lower lows, but selling pressure fades. It most often signals a potential rally.
The interesting part is that a wedge can look like continuation while actually warning that the trend is becoming tired.
HOW TO CONFIRM A PATTERN
Until a pattern is confirmed, it's just a drawing on the chart.
Candle Close
A wick beyond the level isn't enough. Look for the candle body to close beyond the pattern line.
Volume
A breakout with stronger participation is generally more convincing. Weak-volume breakouts can reverse.
Retest
After breaking out, price may return to test the broken level from the other side.
Resistance → Breakout → Retest → Support
If the level holds, confirmation becomes stronger.
WHERE BEGINNERS MESS UP
False Breakouts
Crypto can push through a pattern line with a wick, trigger traders, and immediately reverse. Don't enter on the first poke.
Patterns Everywhere
Once you learn patterns, every chart can start looking like one. 😂
If you have to hunt for the formation, it probably isn't clear enough.
Lower Timeframe vs Higher Timeframe
A bullish hourly flag inside a strong daily downtrend may simply be a temporary move against the bigger trend.
Always check:
Higher timeframe → Market direction → Lower timeframe setup
WHAT TO STUDY NEXT
These five patterns are only the starting point.
Other formations include:
Pennants
Rectangles
Cup and HandleTriple Tops
Triple Bottoms
Broadening Formations
Recommended Study
📚 Thomas Bulkowski — Encyclopedia of Chart Patterns
A major reference with statistics on historical pattern performance.
📚 John Murphy — Technical Analysis of the Financial Markets
A classic technical-analysis resource covering chart patterns and market behaviour.
📚 Robert Edwards & John Magee — Technical Analysis of Stock Trends
A foundational work in traditional technical analysis, first published in 1948.
📚 BabyPips — School of Pipsology
A free, beginner-friendly resource for technical analysis.
FINAL THOUGHT
Theory without practice fades fast.
Study the pattern.
Find it on old charts.
Watch it form live.
Learn how it behaves.
Don't trade a pattern just because you can name it. Wait for confirmation.
And if you made it all the way here:
You're definitely not dumb. 😂📊
🔥 CHAINBALLER
Learn the chart. Understand the crowd. Wait for confirmation.
#ChainBaller #TradingEducation #ChartPatterns
$RLC $ZEC $SAND
Learning Chart Patterns on the Chart
If you have ever opened someone else's breakdown, you have probably seen flags, triangles, head and shoulders, and more.
A beginner may think experienced traders know some secret.
No.
They recognize repeating shapes and understand what those shapes can tell us about market behaviour.
In this guide, we'll break down five useful chart patterns, how to confirm them, and where beginners commonly get them wrong.
THEORY
A pattern is a repeating form of crowd behaviour on the chart.
Most patterns can be understood through:
A MOVE → A PAUSE → A BREAKOUT
During the pause, buyers and sellers fight over price. The resulting shape can hint at which side is gaining strength.
A pattern raises the odds. It guarantees nothing.
The two main categories are:
Continuation Patterns
The current trend pauses and may continue.
Reversal Patterns
The existing trend loses momentum and may reverse.
THE FLAG
A flag starts with a sharp move known as the flagpole, followed by a short consolidation forming a small channel against the original trend.
After the pause, price may break out and continue in the original direction.
After a strong impulse, some traders take profits and price pulls back, but sellers may not have enough strength to reverse the market.
Volume inside the flag usually fades, while breakout volume can expand.
A bearish flag is the same structure in reverse: sharp drop → upward-sloping channel → potential continuation lower.
THE TRIANGLE
A triangle forms when price gets squeezed between two converging lines.
Ascending Triangle
Flat resistance + rising lows. Buyers repeatedly test the same level.
Descending Triangle
Flat support + falling highs. Sellers repeatedly pressure the same floor.
Symmetrical Triangle
Both trendlines converge, leaving the breakout direction to decide the next move.
Volume often decreases inside the triangle and increases when price breaks out.
DOUBLE TOP & DOUBLE BOTTOM
The idea is simple:
Two failed attempts to break the same level.
Double Top
Price reaches a high twice and fails both times. The dip between them creates the neckline.
A close below the neckline can confirm a bearish reversal.
Double Bottom
Price tests the same low twice and sellers fail to break it.
A close above the neckline can confirm a bullish reversal.
HEAD & SHOULDERS
The classic structure has three peaks:
LEFT SHOULDER → HEAD → RIGHT SHOULDER
The middle peak is the highest.
If buyers cannot push the right shoulder toward the head, bullish strength may be fading.
The neckline connects the lows beneath the structure.
A close below the neckline, preferably with increasing volume, strengthens the bearish confirmation.
The inverse Head and Shoulders can appear at market bottoms and signal a potential reversal upward.
THE WEDGE
A wedge forms when both trendlines slope in the same direction while gradually converging.
Rising Wedge
Price makes higher highs, but momentum weakens. It most often warns of a potential drop.
Falling Wedge
Price makes lower lows, but selling pressure fades. It most often signals a potential rally.
The interesting part is that a wedge can look like continuation while actually warning that the trend is becoming tired.
HOW TO CONFIRM A PATTERN
Until a pattern is confirmed, it's just a drawing on the chart.
Candle Close
A wick beyond the level isn't enough. Look for the candle body to close beyond the pattern line.
Volume
A breakout with stronger participation is generally more convincing. Weak-volume breakouts can reverse.
Retest
After breaking out, price may return to test the broken level from the other side.
Resistance → Breakout → Retest → Support
If the level holds, confirmation becomes stronger.
WHERE BEGINNERS MESS UP
False Breakouts
Crypto can push through a pattern line with a wick, trigger traders, and immediately reverse. Don't enter on the first poke.
Patterns Everywhere
Once you learn patterns, every chart can start looking like one. 😂
If you have to hunt for the formation, it probably isn't clear enough.
Lower Timeframe vs Higher Timeframe
A bullish hourly flag inside a strong daily downtrend may simply be a temporary move against the bigger trend.
Always check:
Higher timeframe → Market direction → Lower timeframe setup
WHAT TO STUDY NEXT
These five patterns are only the starting point.
Other formations include:
Pennants
Rectangles
Cup and HandleTriple Tops
Triple Bottoms
Broadening Formations
Recommended Study
📚 Thomas Bulkowski — Encyclopedia of Chart Patterns
A major reference with statistics on historical pattern performance.
📚 John Murphy — Technical Analysis of the Financial Markets
A classic technical-analysis resource covering chart patterns and market behaviour.
📚 Robert Edwards & John Magee — Technical Analysis of Stock Trends
A foundational work in traditional technical analysis, first published in 1948.
📚 BabyPips — School of Pipsology
A free, beginner-friendly resource for technical analysis.
FINAL THOUGHT
Theory without practice fades fast.
Study the pattern.
Find it on old charts.
Watch it form live.
Learn how it behaves.
Don't trade a pattern just because you can name it. Wait for confirmation.
And if you made it all the way here:
You're definitely not dumb. 😂📊
🔥 CHAINBALLER
Learn the chart. Understand the crowd. Wait for confirmation.
#ChainBaller #TradingEducation #ChartPatterns
$RLC $ZEC $SAND
382

·
--
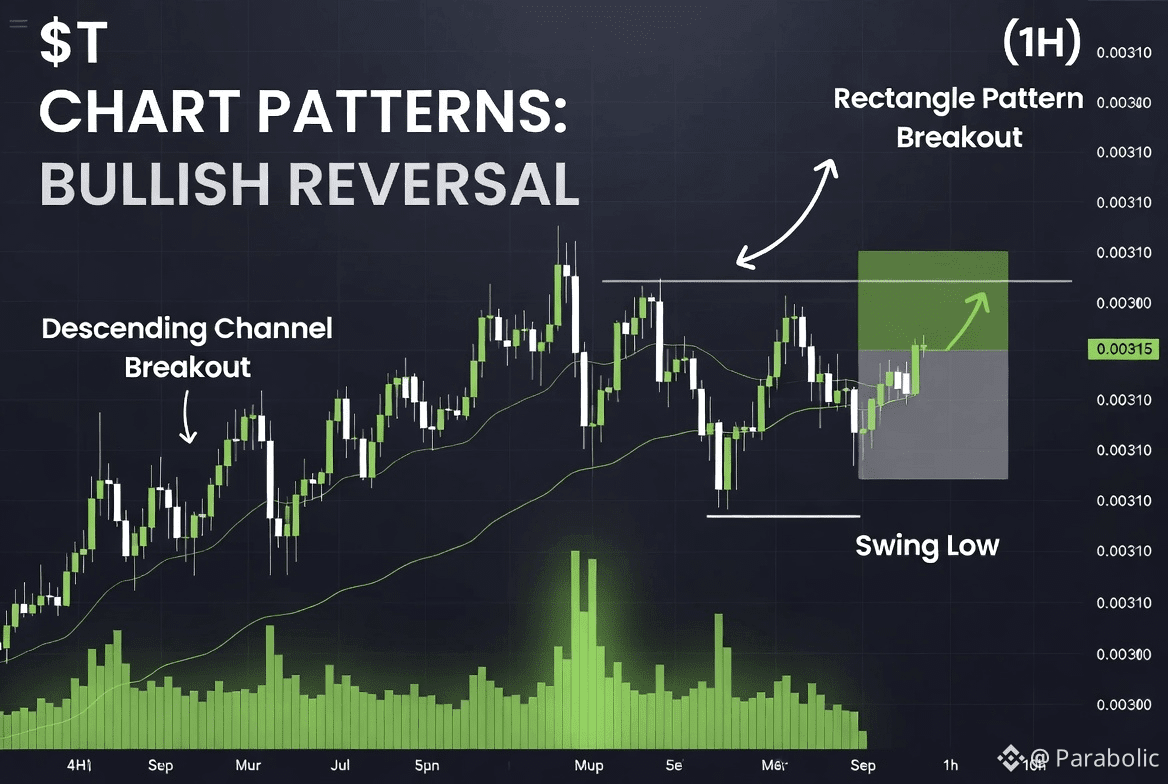
On the 4H timeframe, $T has broken out of a prolonged downtrend that bottomed near 0.00315. The latest 4H candle is a strong bullish breaker that has cleared previous resistance and the declining moving averages, forming a classic trend-reversal breakout. On the 1H chart, price has simultaneously broken out of a multi-week rectangular consolidation pattern. These dual-timeframe breakouts often produce measured moves equal to the height of the prior range or channel. X sentiment is strongly bullish, with multiple traders posting long setups targeting higher prices amid the ongoing pump. Trading Setup (Long – Pattern Breakout):
Entry: 0.00470 (confirmed close above resistance)
Take Profit 1: 0.00520
Take Profit 2: 0.00580
Take Profit 3: 0.00650
Stop Loss: 0.00430 (below 4H structure low)
#ChartPatterns #BreakoutTrading
trade here $T
{spot}(TUSDT)
On the 4H timeframe, $T has broken out of a prolonged downtrend that bottomed near 0.00315. The latest 4H candle is a strong bullish breaker that has cleared previous resistance and the declining moving averages, forming a classic trend-reversal breakout. On the 1H chart, price has simultaneously broken out of a multi-week rectangular consolidation pattern. These dual-timeframe breakouts often produce measured moves equal to the height of the prior range or channel. X sentiment is strongly bullish, with multiple traders posting long setups targeting higher prices amid the ongoing pump. Trading Setup (Long – Pattern Breakout):
Entry: 0.00470 (confirmed close above resistance)
Take Profit 1: 0.00520
Take Profit 2: 0.00580
Take Profit 3: 0.00650
Stop Loss: 0.00430 (below 4H structure low)
#ChartPatterns #BreakoutTrading
trade here $T
Entry: 0.00470 (confirmed close above resistance)
Take Profit 1: 0.00520
Take Profit 2: 0.00580
Take Profit 3: 0.00650
Stop Loss: 0.00430 (below 4H structure low)
#ChartPatterns #BreakoutTrading
trade here $T
178

·
--
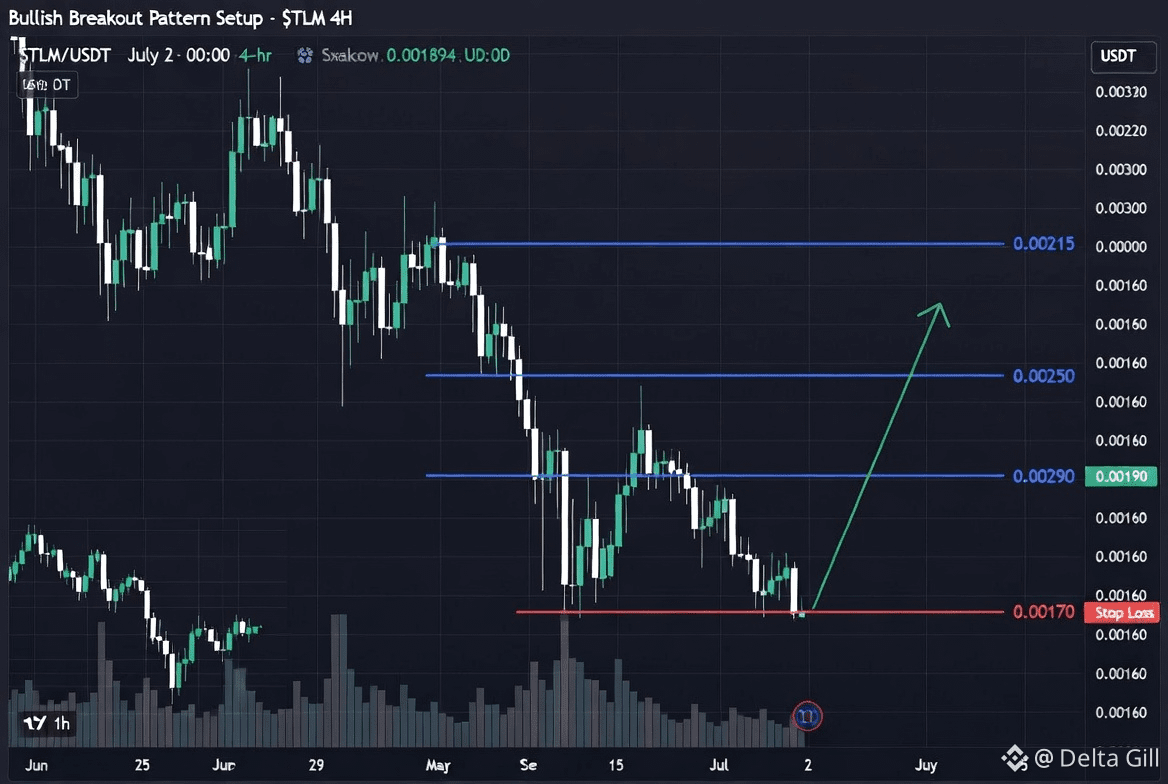
On the 4H chart, $TLM has broken out of a prolonged descending channel with a decisive bullish candle and heavy volume. The 1H timeframe shows a clear impulsive breakout structure after consolidation near the lows. This pattern resembles a falling wedge or descending channel breakout — classic bullish reversal signals. Combined with the latest data showing extreme volume spike and renewed trader interest in Alien Worlds, the breakout has strong conviction.Bullish Trading Setup Entry: 0.00190 (break and close above recent high or retest of breakout level)
Take Profit 1: 0.00215
Take Profit 2: 0.00250
Take Profit 3: 0.00300
Stop Loss: 0.00170 (below the breakout candle low)
Measured move targets suggest significant upside potential. #TLM #ChartPatterns
On the 4H chart, $TLM has broken out of a prolonged descending channel with a decisive bullish candle and heavy volume. The 1H timeframe shows a clear impulsive breakout structure after consolidation near the lows. This pattern resembles a falling wedge or descending channel breakout — classic bullish reversal signals. Combined with the latest data showing extreme volume spike and renewed trader interest in Alien Worlds, the breakout has strong conviction.Bullish Trading Setup Entry: 0.00190 (break and close above recent high or retest of breakout level)
Take Profit 1: 0.00215
Take Profit 2: 0.00250
Take Profit 3: 0.00300
Stop Loss: 0.00170 (below the breakout candle low)
Measured move targets suggest significant upside potential. #TLM #ChartPatterns
Take Profit 1: 0.00215
Take Profit 2: 0.00250
Take Profit 3: 0.00300
Stop Loss: 0.00170 (below the breakout candle low)
Measured move targets suggest significant upside potential. #TLM #ChartPatterns
182

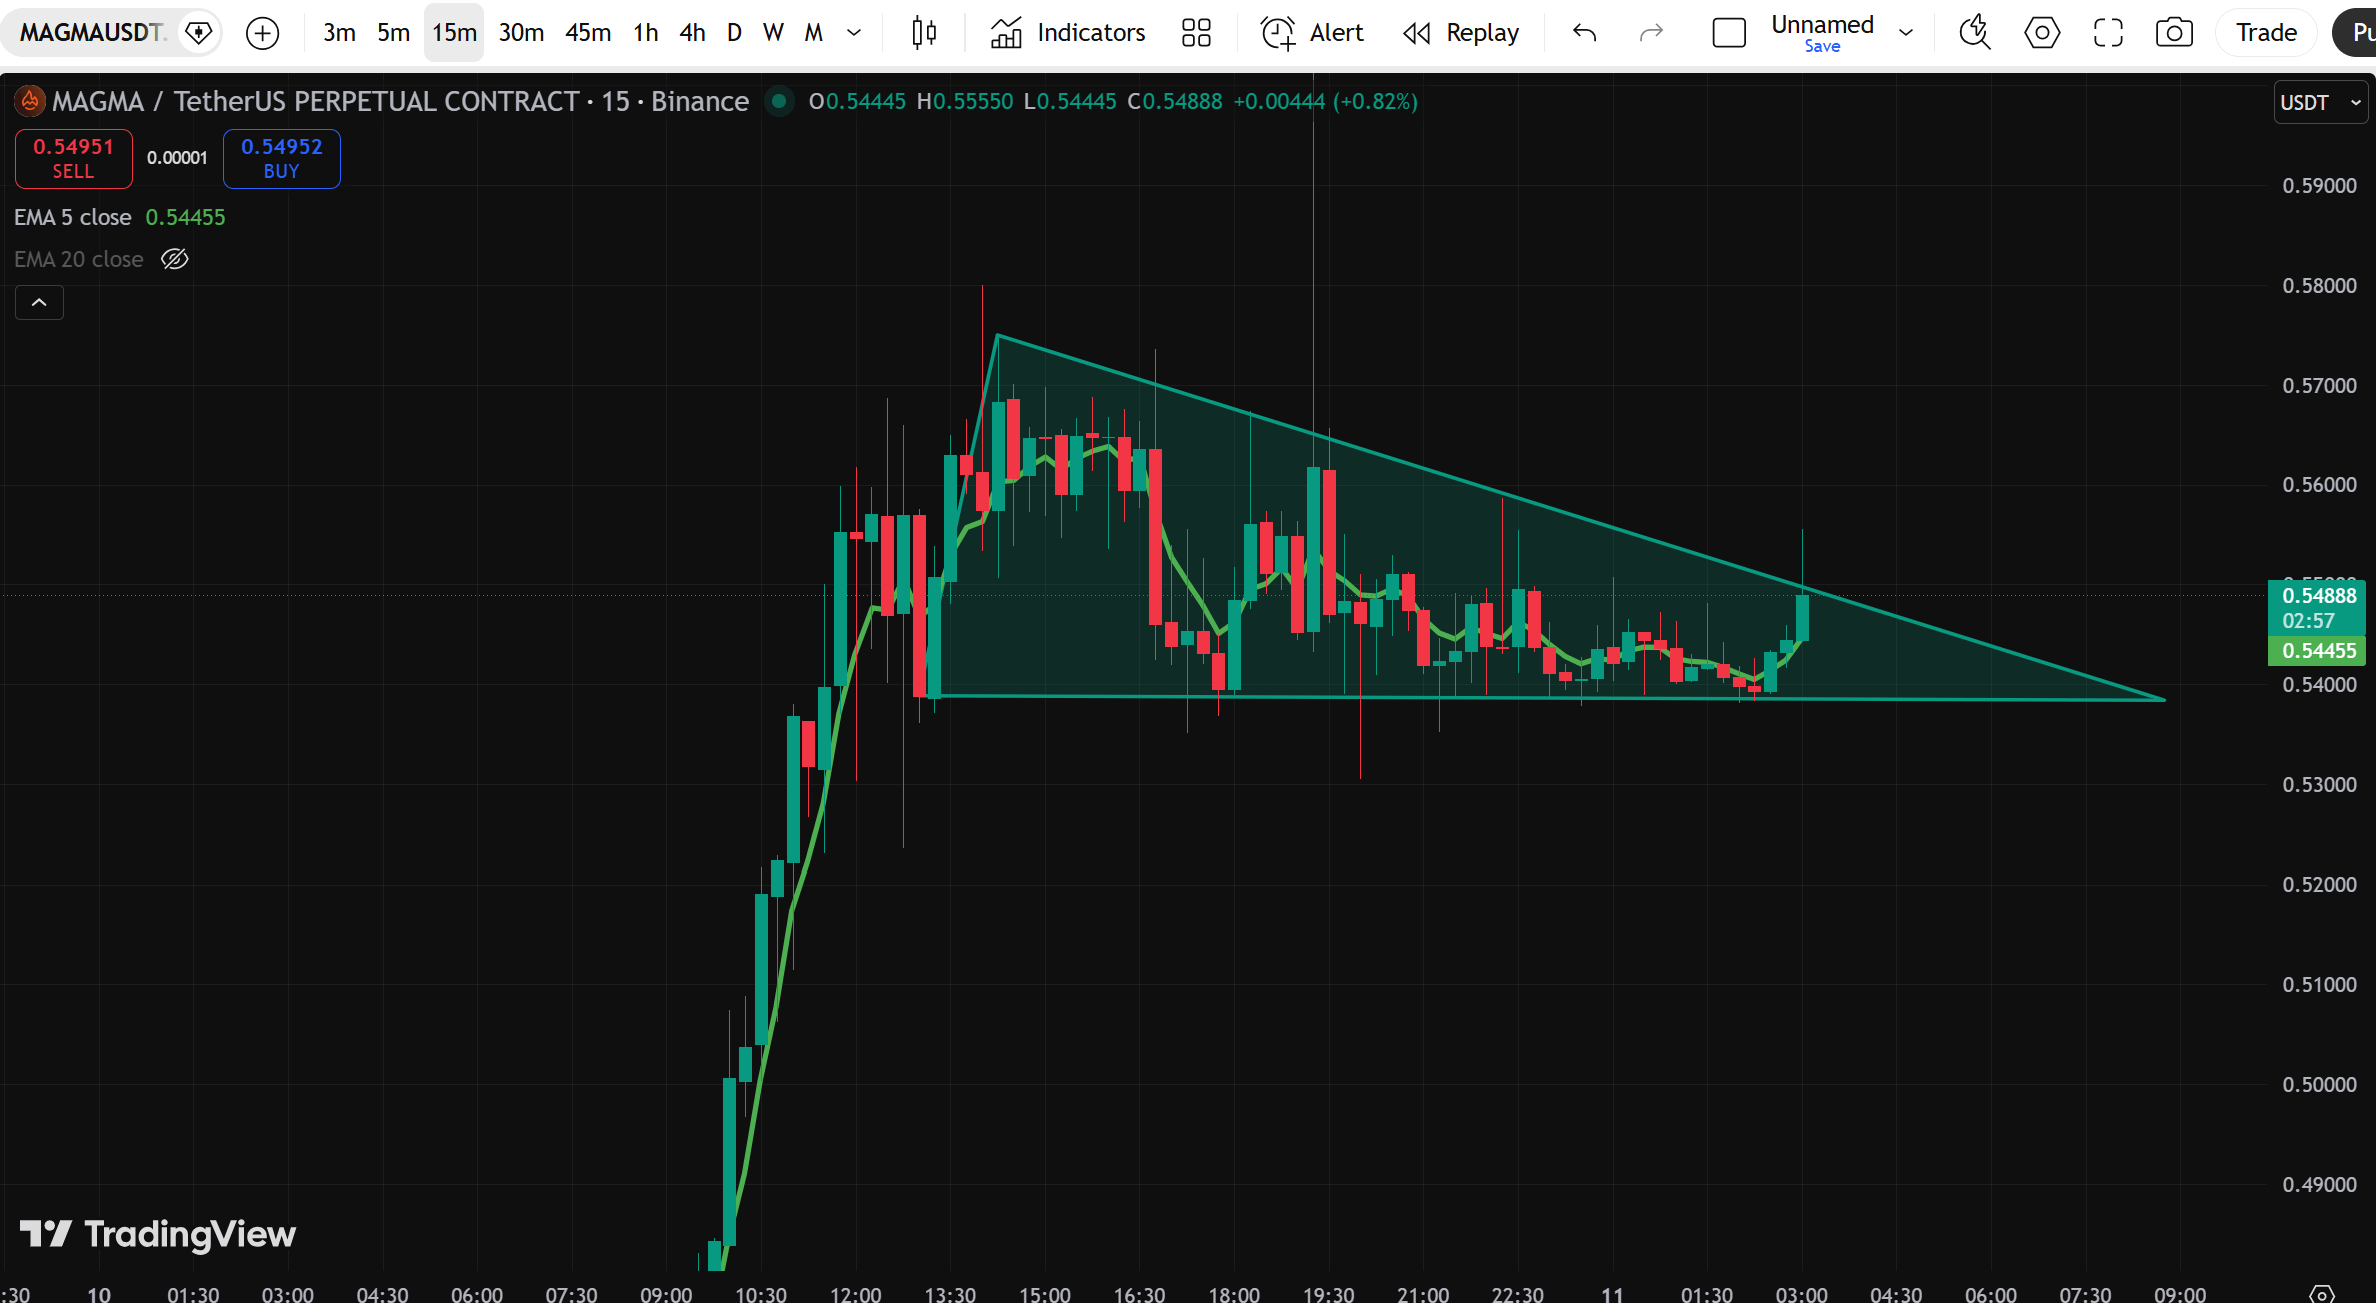
🚨 $MAGMA IS ABOUT TO ERUPT! MASSIVE SQUEEZE IN PROGRESS!
🚨If you are trading MAGMA/USDT, you need to be watching this 15-minute chart right now. After a phenomenal vertical rally, the price has entered a massive volatility squeeze, and the pressure is reaching a boiling point!
🌋📊 The Technical Setup:
The Squeeze:
We are looking at a textbook consolidation pattern. The bulls have built an unbreakable horizontal floor of support, while descending resistance has kept the price tightly compressed over the last several hours.The Breakout Attempt: Right now, the price is sitting at $0.54888 and aggressively pushing against the upper boundary of this triangle!Momentum:
$MAGMA just reclaimed the short-term 5 EMA (the green line), showing that buyers are waking up and applying serious pressure right at the exact moment it matters most.💡 The Play:The apex is getting incredibly tight, and volume is thinning out—this is the classic "calm before the storm." We are waiting for that single explosive 15m candle close above the descending trendline. Once that lid blows off, expect a violent expansion back toward the local highs!Set your alerts and keep your eyes glued to the chart. This coil is about to spring! 🚀📈
$MAGMA
{future}(MAGMAUSDT)
#MAGMAUSDT #cryptosignals #chartpatterns #BreakoutTrading
🚨 $MAGMA IS ABOUT TO ERUPT! MASSIVE SQUEEZE IN PROGRESS!
🚨If you are trading MAGMA/USDT, you need to be watching this 15-minute chart right now. After a phenomenal vertical rally, the price has entered a massive volatility squeeze, and the pressure is reaching a boiling point!
🌋📊 The Technical Setup:
The Squeeze:
We are looking at a textbook consolidation pattern. The bulls have built an unbreakable horizontal floor of support, while descending resistance has kept the price tightly compressed over the last several hours.The Breakout Attempt: Right now, the price is sitting at $0.54888 and aggressively pushing against the upper boundary of this triangle!Momentum:
$MAGMA just reclaimed the short-term 5 EMA (the green line), showing that buyers are waking up and applying serious pressure right at the exact moment it matters most.💡 The Play:The apex is getting incredibly tight, and volume is thinning out—this is the classic "calm before the storm." We are waiting for that single explosive 15m candle close above the descending trendline. Once that lid blows off, expect a violent expansion back toward the local highs!Set your alerts and keep your eyes glued to the chart. This coil is about to spring! 🚀📈
$MAGMA
#MAGMAUSDT #cryptosignals #chartpatterns #BreakoutTrading
🚨If you are trading MAGMA/USDT, you need to be watching this 15-minute chart right now. After a phenomenal vertical rally, the price has entered a massive volatility squeeze, and the pressure is reaching a boiling point!
🌋📊 The Technical Setup:
The Squeeze:
We are looking at a textbook consolidation pattern. The bulls have built an unbreakable horizontal floor of support, while descending resistance has kept the price tightly compressed over the last several hours.The Breakout Attempt: Right now, the price is sitting at $0.54888 and aggressively pushing against the upper boundary of this triangle!Momentum:
$MAGMA just reclaimed the short-term 5 EMA (the green line), showing that buyers are waking up and applying serious pressure right at the exact moment it matters most.💡 The Play:The apex is getting incredibly tight, and volume is thinning out—this is the classic "calm before the storm." We are waiting for that single explosive 15m candle close above the descending trendline. Once that lid blows off, expect a violent expansion back toward the local highs!Set your alerts and keep your eyes glued to the chart. This coil is about to spring! 🚀📈
$MAGMA
#MAGMAUSDT #cryptosignals #chartpatterns #BreakoutTrading
100

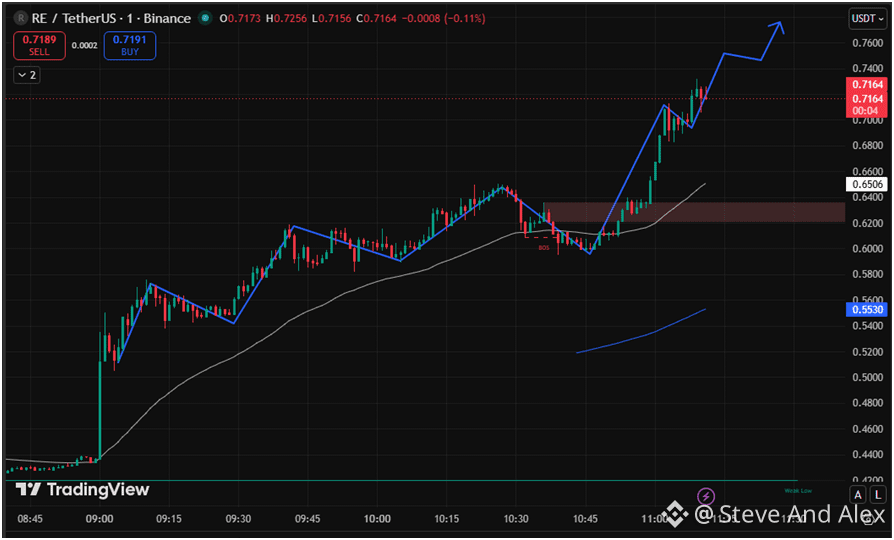
🚀 RE/USDT Technical Analysis: Bullish Momentum & Market Structure Break!
📈Looking at the 1-minute chart for RE/USDT on Binance, we are witnessing some incredibly clean price action and a strong textbook reversal.
Here is a breakdown of what the chart in image_a3335c.png is telling us:
🔹 The Setup: After an initial massive surge earlier in the session, the price entered a healthy correction phase, putting in a lower high and searching for a solid support floor.
🔹 Market Structure Shift: The price found strong buying interest around the 0.5800–0.6000 zone. Following a brief "Break of Structure" (BOS) signal, the bulls aggressively took over.
🔹 The Breakout: RE has completely invalidated the previous local resistance zone (highlighted by the red horizontal block around 0.6200–0.6400). It didn't just break it—it surged right through it with high volume, pushing past the 0.7200 mark!
🔹 Current State: The price is sitting strong at 0.7244 (+0.84% on the immediate candle), holding well above its moving averages. The blue pathing indicator suggests the asset is eyeing a continuation toward the 0.7600–0.7800 levels if this momentum sustains.
💡 Key Takeaway:When an asset breaks a key psychological and structural resistance zone with this kind of velocity, the old resistance frequently flips into a rock-solid support floor. Watching closely to see if it consolidates here before the next leg up!Are you holding or trading $RE today? What are your short-term price targets for this rally? Let me know your thoughts in the comments below! 👇
#TechnicalAnalysis $RE #ChartPatterns #BullishMomentum
{spot}(REUSDT)
TRADE NOW!!!
🚀 RE/USDT Technical Analysis: Bullish Momentum & Market Structure Break!
📈Looking at the 1-minute chart for RE/USDT on Binance, we are witnessing some incredibly clean price action and a strong textbook reversal.
Here is a breakdown of what the chart in image_a3335c.png is telling us:
🔹 The Setup: After an initial massive surge earlier in the session, the price entered a healthy correction phase, putting in a lower high and searching for a solid support floor.
🔹 Market Structure Shift: The price found strong buying interest around the 0.5800–0.6000 zone. Following a brief "Break of Structure" (BOS) signal, the bulls aggressively took over.
🔹 The Breakout: RE has completely invalidated the previous local resistance zone (highlighted by the red horizontal block around 0.6200–0.6400). It didn't just break it—it surged right through it with high volume, pushing past the 0.7200 mark!
🔹 Current State: The price is sitting strong at 0.7244 (+0.84% on the immediate candle), holding well above its moving averages. The blue pathing indicator suggests the asset is eyeing a continuation toward the 0.7600–0.7800 levels if this momentum sustains.
💡 Key Takeaway:When an asset breaks a key psychological and structural resistance zone with this kind of velocity, the old resistance frequently flips into a rock-solid support floor. Watching closely to see if it consolidates here before the next leg up!Are you holding or trading $RE today? What are your short-term price targets for this rally? Let me know your thoughts in the comments below! 👇
#TechnicalAnalysis $RE #ChartPatterns #BullishMomentum
TRADE NOW!!!
📈Looking at the 1-minute chart for RE/USDT on Binance, we are witnessing some incredibly clean price action and a strong textbook reversal.
Here is a breakdown of what the chart in image_a3335c.png is telling us:
🔹 The Setup: After an initial massive surge earlier in the session, the price entered a healthy correction phase, putting in a lower high and searching for a solid support floor.
🔹 Market Structure Shift: The price found strong buying interest around the 0.5800–0.6000 zone. Following a brief "Break of Structure" (BOS) signal, the bulls aggressively took over.
🔹 The Breakout: RE has completely invalidated the previous local resistance zone (highlighted by the red horizontal block around 0.6200–0.6400). It didn't just break it—it surged right through it with high volume, pushing past the 0.7200 mark!
🔹 Current State: The price is sitting strong at 0.7244 (+0.84% on the immediate candle), holding well above its moving averages. The blue pathing indicator suggests the asset is eyeing a continuation toward the 0.7600–0.7800 levels if this momentum sustains.
💡 Key Takeaway:When an asset breaks a key psychological and structural resistance zone with this kind of velocity, the old resistance frequently flips into a rock-solid support floor. Watching closely to see if it consolidates here before the next leg up!Are you holding or trading $RE today? What are your short-term price targets for this rally? Let me know your thoughts in the comments below! 👇
#TechnicalAnalysis $RE #ChartPatterns #BullishMomentum
TRADE NOW!!!
1
1
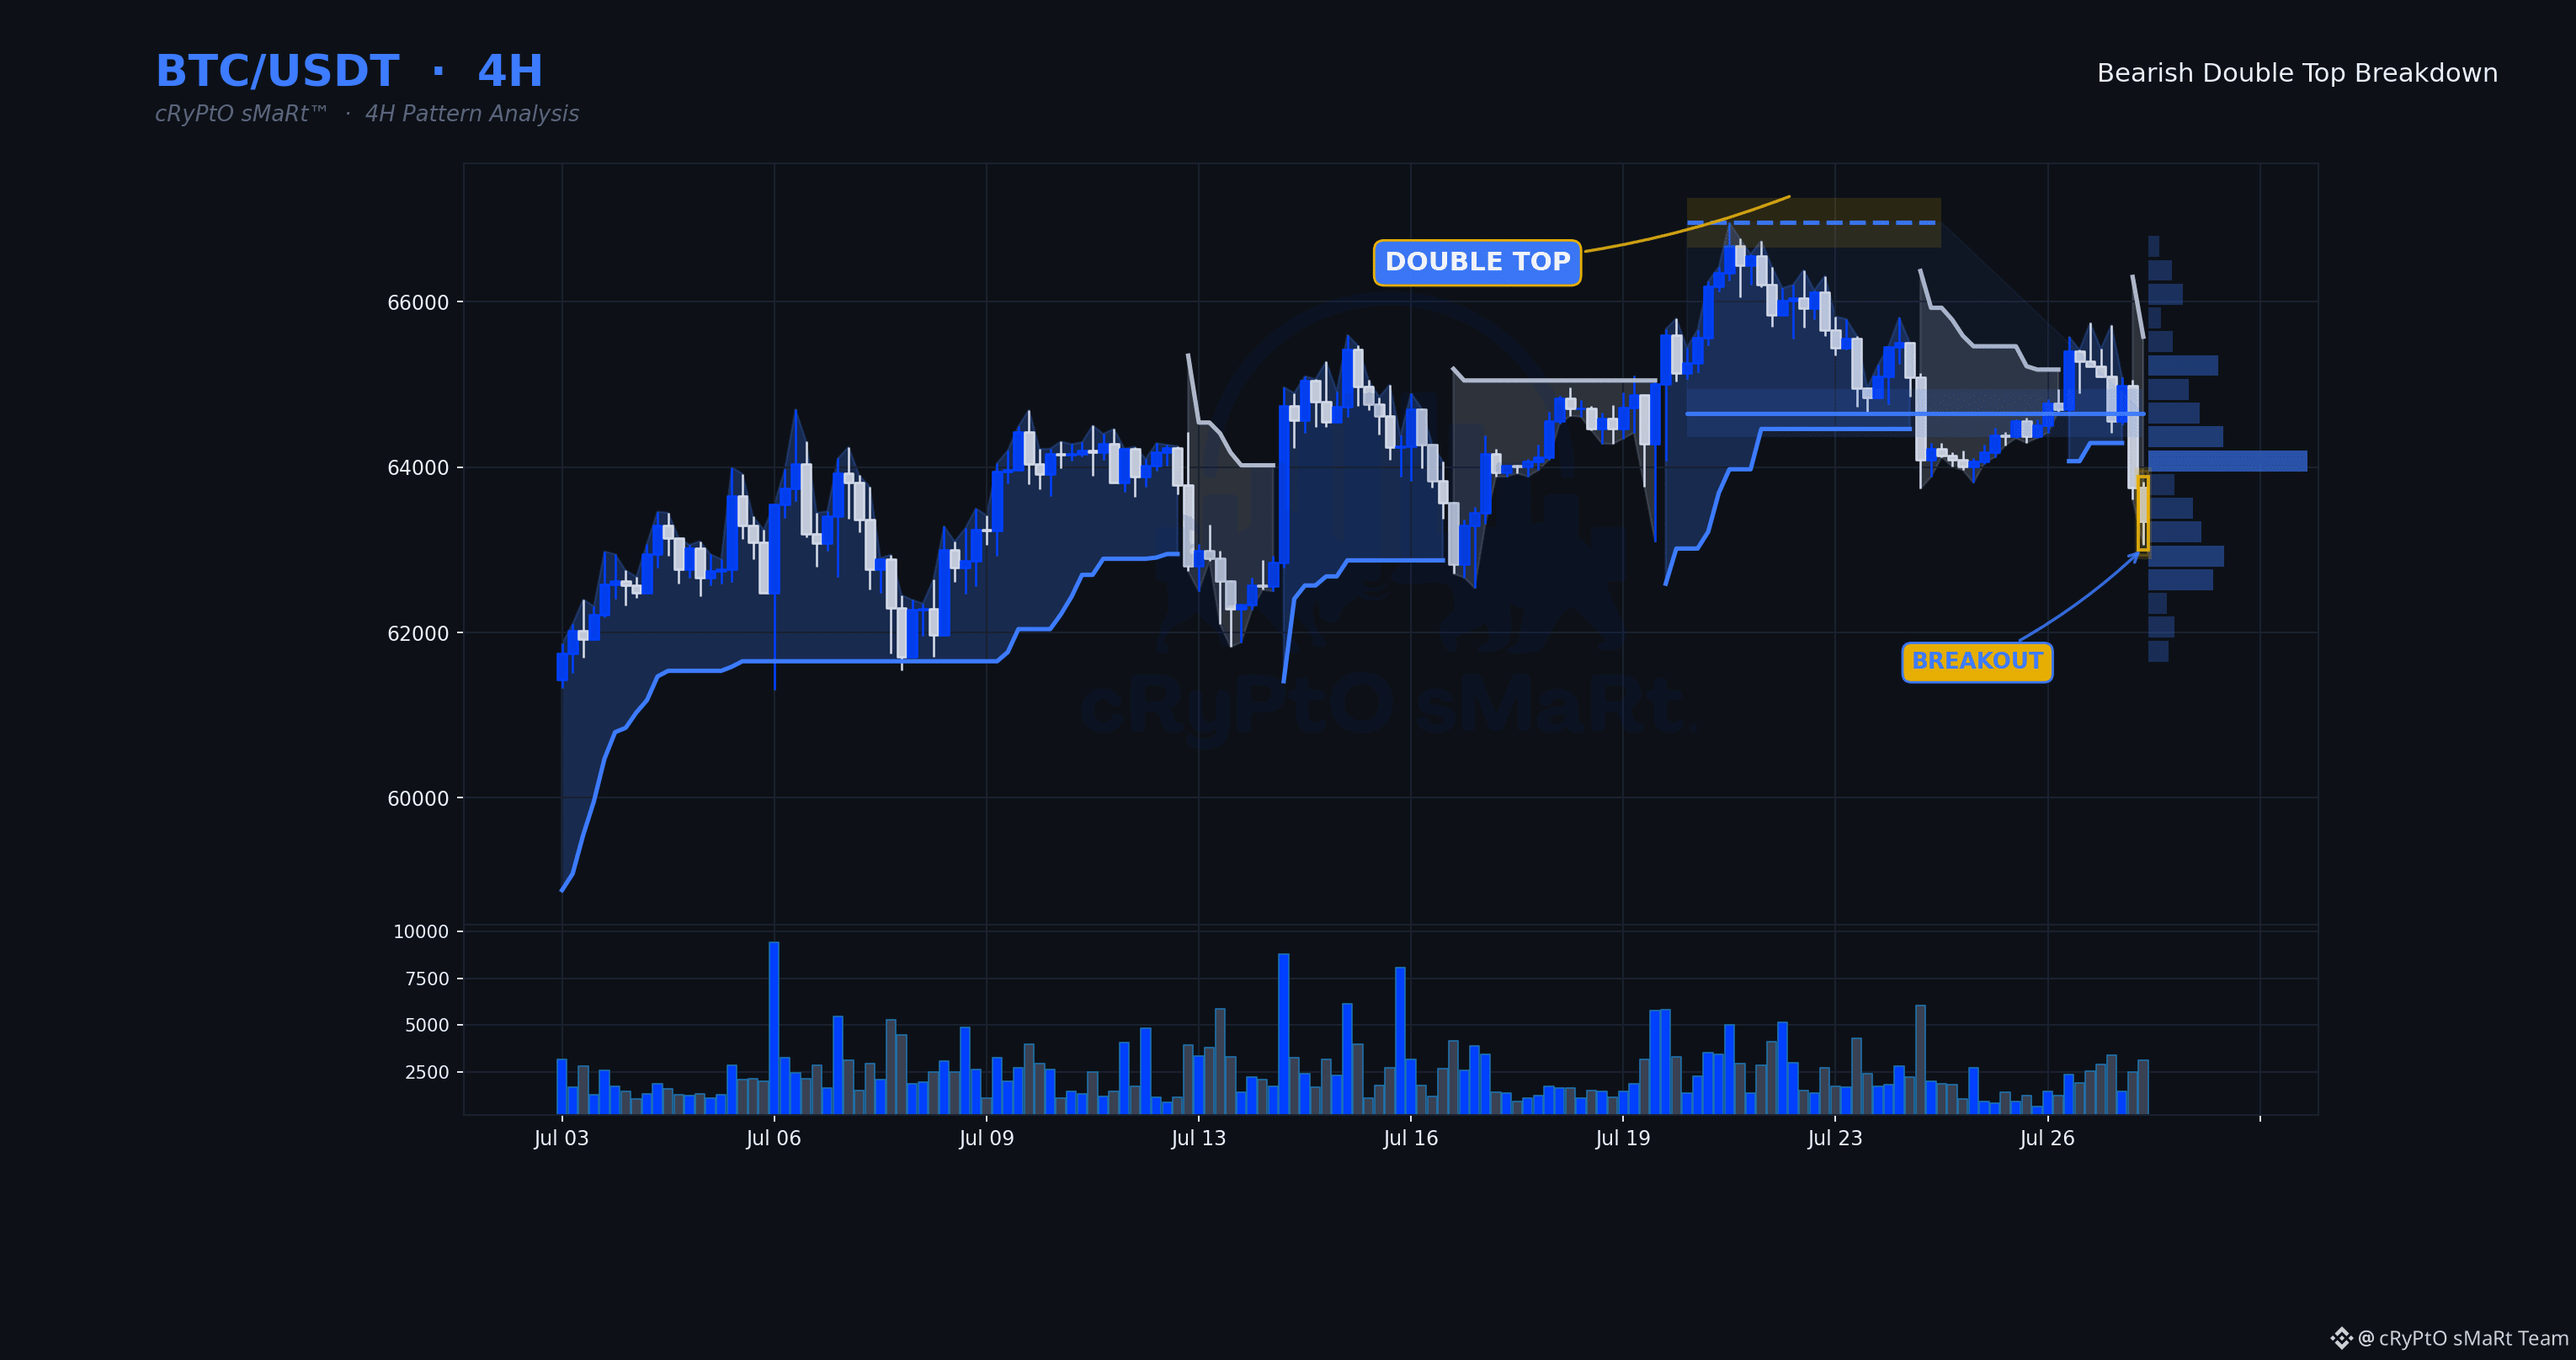
319
Sellers just took the neckline out with volume that actually backs the move — this isn't a drift lower, it's a decisive break with participation behind it. Momentum's got room left, which means the move isn't stretched or exhausted on this timeframe yet.
🗓 Daily: Neutral — daily is mixed — Supertrend and EMAs not aligned
⏱ 4H: Double Top · Bearish bias
⏳ 1H: the 1H is trading below the level with its trend down — the lower timeframe confirms the setup.
📋 WHY IT QUALIFIES
✓ Double Top structure completed
✓ Decisive breakdown — closed 2.0% beyond the line
✓ Volume 1.7× its 20-bar average
✓ RSI 34 — momentum confirms, not yet exhausted
🧭 Bias: Bearish while price holds below $64,650.00
⚠️ Invalidation: 4H close back above $64,650.00
🔵 Support $64,650.00 🟡 Resistance $66,956.15
$BTC #ChartPatterns
Education only, not financial advice.
Sellers just took the neckline out with volume that actually backs the move — this isn't a drift lower, it's a decisive break with participation behind it. Momentum's got room left, which means the move isn't stretched or exhausted on this timeframe yet.
🗓 Daily: Neutral — daily is mixed — Supertrend and EMAs not aligned
⏱ 4H: Double Top · Bearish bias
⏳ 1H: the 1H is trading below the level with its trend down — the lower timeframe confirms the setup.
📋 WHY IT QUALIFIES
✓ Double Top structure completed
✓ Decisive breakdown — closed 2.0% beyond the line
✓ Volume 1.7× its 20-bar average
✓ RSI 34 — momentum confirms, not yet exhausted
🧭 Bias: Bearish while price holds below $64,650.00
⚠️ Invalidation: 4H close back above $64,650.00
🔵 Support $64,650.00 🟡 Resistance $66,956.15
$BTC #ChartPatterns
Education only, not financial advice.
🗓 Daily: Neutral — daily is mixed — Supertrend and EMAs not aligned
⏱ 4H: Double Top · Bearish bias
⏳ 1H: the 1H is trading below the level with its trend down — the lower timeframe confirms the setup.
📋 WHY IT QUALIFIES
✓ Double Top structure completed
✓ Decisive breakdown — closed 2.0% beyond the line
✓ Volume 1.7× its 20-bar average
✓ RSI 34 — momentum confirms, not yet exhausted
🧭 Bias: Bearish while price holds below $64,650.00
⚠️ Invalidation: 4H close back above $64,650.00
🔵 Support $64,650.00 🟡 Resistance $66,956.15
$BTC #ChartPatterns
Education only, not financial advice.
58
Log in to explore more content
Join global crypto users on Binance Square
⚡️ Get latest and useful information about crypto.
💬 Trusted by the world’s largest crypto exchange.
👍 Discover real insights from verified creators.
Email / Phone number
Trending Topics
1
#XRPDropsToTwoYearLowNear87Cents
2,086 views
95 Discussing
2
#BitcoinFallsBelow$57KToTwoYearLow
1,206 views
20 Discussing
3
#NvidiaLoses$2.7TrillionInMonthAndAHalf
606 views
31 Discussing
4
#CanBTCReboundAfterFallingBelow60K?
513,571 views
2,251 Discussing
5
#GlobalStocksFaceLongestLosingStreakSince2023
177,458 views
1,564 Discussing
6
#BlackRockIBITPostsRecord$541MSingleDayOutflow
10,361 views
50 Discussing
7
#AnthropicPlungesTowardIPOPriceonDay2
86,469 views
895 Discussing
8
#TwentyOneCapitalAdds172.25BTC
36,020 views
414 Discussing
9
#HKBillWouldExcludeTokenizedDepositsFromVirtualAssets
3,176 views
41 Discussing
10
#BNBDropsBelow540USDTWith8.46%DailyDecline
50,322 views
463 Discussing