
#bitcoinpredictionnext
bitcoinpredictionnext
563 views
7 Discussing
Hot
Latest

·
--
Bearish
$BTC
{future}(BTCUSDT)
$BTC 🟠 HAPPY WEEKEND, CRYPTO TRADERS! 📉
₿ BITCOIN BEARISH OUTLOOK
BTC could potentially drop toward $79,000, where a possible bottom may form.
🎯 Key Level: $79,000
📉 Bias: Bearish
⚠️ Watch price action and liquidity before entering any trade.
Stay patient. Protect your capital. Trade with a plan.
*— WHALIX | Market Insights*
#Bitcoin #BTC #CryptoMarket #CryptoAnalysis #Whalix #BitcoinPredictionNext
$BTC
$BTC 🟠 HAPPY WEEKEND, CRYPTO TRADERS! 📉
₿ BITCOIN BEARISH OUTLOOK
BTC could potentially drop toward $79,000, where a possible bottom may form.
🎯 Key Level: $79,000
📉 Bias: Bearish
⚠️ Watch price action and liquidity before entering any trade.
Stay patient. Protect your capital. Trade with a plan.
*— WHALIX | Market Insights*
#Bitcoin #BTC #CryptoMarket #CryptoAnalysis #Whalix #BitcoinPredictionNext
$BTC 🟠 HAPPY WEEKEND, CRYPTO TRADERS! 📉
₿ BITCOIN BEARISH OUTLOOK
BTC could potentially drop toward $79,000, where a possible bottom may form.
🎯 Key Level: $79,000
📉 Bias: Bearish
⚠️ Watch price action and liquidity before entering any trade.
Stay patient. Protect your capital. Trade with a plan.
*— WHALIX | Market Insights*
#Bitcoin #BTC #CryptoMarket #CryptoAnalysis #Whalix #BitcoinPredictionNext

106

🚨🔥 BTC IS AT A CRITICAL LEVEL — WHAT HAPPENS NEXT? 👀
Bitcoin is showing a structure that traders should NOT ignore.
📌 Buyers are defending the key support zone
📌 Momentum is trying to turn bullish
📌 A clean breakout above resistance could trigger another strong move 📈
📌 But losing support could bring a deeper pullback before the next rally
🎯 My view: BTC remains bullish as long as the major support holds.
The real question is:
Are we about to see the next breakout… or one more shakeout before the move? 👀
👇 Comment your BTC target:
$100K / $110K / $120K / $150K?
#Bitcoin #BTC #Crypto #BitcoinAnalysis #BTCUSDT #CryptoTrading #Binance #Bullish #BitcoinPredictionNext #GrayscaleFilesFifthZECETFAmendment #USDollarFallsToThreeMonthLow #USThreeMajorIndexesPostWeeklyLosses #GoldReboundsNearly5%
🚨🔥 BTC IS AT A CRITICAL LEVEL — WHAT HAPPENS NEXT? 👀
Bitcoin is showing a structure that traders should NOT ignore.
📌 Buyers are defending the key support zone
📌 Momentum is trying to turn bullish
📌 A clean breakout above resistance could trigger another strong move 📈
📌 But losing support could bring a deeper pullback before the next rally
🎯 My view: BTC remains bullish as long as the major support holds.
The real question is:
Are we about to see the next breakout… or one more shakeout before the move? 👀
👇 Comment your BTC target:
$100K / $110K / $120K / $150K?
#Bitcoin #BTC #Crypto #BitcoinAnalysis #BTCUSDT #CryptoTrading #Binance #Bullish #BitcoinPredictionNext #GrayscaleFilesFifthZECETFAmendment #USDollarFallsToThreeMonthLow #USThreeMajorIndexesPostWeeklyLosses #GoldReboundsNearly5%
Bitcoin is showing a structure that traders should NOT ignore.
📌 Buyers are defending the key support zone
📌 Momentum is trying to turn bullish
📌 A clean breakout above resistance could trigger another strong move 📈
📌 But losing support could bring a deeper pullback before the next rally
🎯 My view: BTC remains bullish as long as the major support holds.
The real question is:
Are we about to see the next breakout… or one more shakeout before the move? 👀
👇 Comment your BTC target:
$100K / $110K / $120K / $150K?
#Bitcoin #BTC #Crypto #BitcoinAnalysis #BTCUSDT #CryptoTrading #Binance #Bullish #BitcoinPredictionNext #GrayscaleFilesFifthZECETFAmendment #USDollarFallsToThreeMonthLow #USThreeMajorIndexesPostWeeklyLosses #GoldReboundsNearly5%
41


Article
BITCOIN AT A CRITICAL TURNING POINT! BTC $64K — MORE DOWNSIDE OR A MASSIVE RELIEF BOUNCE?$BTC
{future}(BTCUSDT)
Bitcoin (BTC/USDT) Market Analysis | November 18, 2026
Bitcoin is facing significant selling pressure as the market continues to struggle below important support and resistance levels. After a sharp decline from the $80,000+ region, BTC is now trading around $64,379, and the daily chart suggests that sellers are still controlling the overall market structure.
However, with RSI entering deeply oversold territory, traders should also prepare for a possible short-term relief bounce.
Let's examine what could happen next.
📊 1. Bitcoin Technical Analysis
Current BTC Price: $64,379
Timeframe: 1D (Daily)
Daily Change: -0.83%
Daily High: $64,976
Daily Low: $64,100
Daily RSI: 23.17
Bitcoin has broken below its previous descending-channel support and experienced a strong bearish breakdown.
The price is now consolidating around the $64,000 region after a sharp sell-off.
Key observations:
BTC remains below its previous support structure.The daily trend continues to form lower highs and lower lows.Selling pressure remains dominant.RSI at 23.17 indicates deeply oversold conditions.A temporary recovery is possible, but a confirmed bullish reversal has not yet appeared.
My view: The broader trend remains bearish until Bitcoin reclaims important resistance levels.
🔍 2. Important Support Levels
These are the key downside levels I am watching:
$63,500: Immediate support and an important level for buyers.$63,000–$63,350: Critical support and liquidation-interest zone.$61,287: Next major downside target.$60,251: Important lower support zone.
If BTC loses $63,000 with strong selling volume, the market could experience another bearish expansion toward $61,287 and potentially $60,251.
🚀 3. Important Resistance Levels
Bitcoin needs to recover these levels before bulls can regain control.
$65,655: Important short-liquidation interest area.$66,325: Immediate major resistance.$67,500: Next recovery target.$70,000: Psychological resistance.$74,014: Major higher resistance.
A sustained daily close above $66,325 would improve the short-term outlook and could open the door toward $67,500–$70,000.
Until then, rallies may attract additional selling pressure.
📉 4. RSI & Market Momentum
One of the most important indicators right now is RSI.
According to the TradingView chart:
Daily RSI: 23.17The market is deeply oversold.Bearish momentum remains strong.
The daily RSI below 30 indicates extreme selling pressure. Historically, oversold conditions can create opportunities for short-term recovery.$SOL
However, remember:
Oversold does not automatically mean bullish.
Bitcoin can remain oversold for an extended period during a strong downtrend.$BNB
🐋 5. Market Sentiment & Institutional Data
The November 18 market report provides several important observations:
Crypto Fear & Greed Index: 11 (Extreme Fear).Crypto average RSI: 41.04.US Spot BTC ETF daily net flow: -$30.40 million.Bitcoin treasury weekly net inflow: +748 BTC.BTC Open Interest: $41.65 billion.BTC Funding Rate: 0.0038%.USDT Dominance: 8.061%.
These indicators show a cautious market environment.
ETF outflows and extreme fear suggest weak investor confidence, while positive Bitcoin treasury accumulation provides a contrasting longer-term signal.
The derivatives data also highlights important liquidation areas:
Long liquidation interest: Around $63,341.Short liquidation interest: Around $65,655.
These levels could become important during the next volatile move.
🎯 6. Bitcoin Next Move: Bullish or Bearish?
My current expectation is that Bitcoin remains bearish in the short term.
Scenario 1: Bearish Continuation
If BTC fails to recover above $65,655–$66,325 and sellers maintain control, another move toward $63,500 is possible.
A decisive breakdown below $63,000 could expose $61,287 and $60,251.
Scenario 2: Relief Bounce
If buyers successfully defend $63,000–$63,500, Bitcoin could attempt a recovery toward:
$65,655$66,325$67,500
A sustained recovery above $66,325 would be the first important sign of improving momentum.
My prediction: Bearish bias remains dominant, but oversold conditions increase the possibility of a temporary relief bounce.
🔥 7. BTC/USDT Trading Signal
Exchange: Binance
Pair: BTC/USDT Perpetual
Trade Setup: SHORT (Conditional)
Trading Style: Swing / Short-Term
Entry Zone: $64,800 – $65,600
Leverage: 3x–5x (Suggested maximum)
Take Profit 1: $63,500
Take Profit 2: $62,000
Take Profit 3: $61,300
Stop Loss: $66,500
Market Bias: Bearish
Confidence: Moderate (conditional setup)
Risk Management: Risk only 1% of trading capital per trade.
Entry Confirmation:
Wait for BTC to recover into the entry zone.Look for bearish rejection on the 1H or 4H timeframe.Confirm selling pressure before entering.Avoid chasing the price after a sharp red candle.
Important: If BTC breaks above $66,325 and holds that level, avoid forcing the short setup. Wait for a fresh market structure confirmation.
⚠️ 8. Final Thoughts
Bitcoin is currently at a critical decision point.
The daily chart remains bearish, market sentiment is extremely fearful, and the RSI indicates oversold conditions.
The most important level to watch is $63,000–$63,500.
If this support breaks, further downside becomes more likely. On the other hand, if buyers defend this zone and reclaim $66,325, we could see a meaningful short-term recovery.
My strategy is simple:
Don't chase the breakdown. Wait for confirmation, respect the key levels, and manage risk carefully.
The next major move could create significant opportunities for both bulls and bears.
What do you think? Will Bitcoin break below $63K, or are we approaching a strong recovery?
Share your thoughts in the comments!
Disclaimer: This analysis is for educational and informational purposes only, not financial advice. Cryptocurrency trading involves significant risk, especially when using leverage. Always conduct your own research (DYOR), use proper risk management, and never invest more than you can afford to lose.
#BTCUSDT.P #BTC🔥🔥🔥🔥🔥 #CryptoAnalysis📈📉🐋📅🚀 #BitcoinPredictionNext #BinanceSquareBTC
BITCOIN AT A CRITICAL TURNING POINT! BTC $64K — MORE DOWNSIDE OR A MASSIVE RELIEF BOUNCE?
$BTC
Bitcoin (BTC/USDT) Market Analysis | November 18, 2026
Bitcoin is facing significant selling pressure as the market continues to struggle below important support and resistance levels. After a sharp decline from the $80,000+ region, BTC is now trading around $64,379, and the daily chart suggests that sellers are still controlling the overall market structure.
However, with RSI entering deeply oversold territory, traders should also prepare for a possible short-term relief bounce.
Let's examine what could happen next.
📊 1. Bitcoin Technical Analysis
Current BTC Price: $64,379
Timeframe: 1D (Daily)
Daily Change: -0.83%
Daily High: $64,976
Daily Low: $64,100
Daily RSI: 23.17
Bitcoin has broken below its previous descending-channel support and experienced a strong bearish breakdown.
The price is now consolidating around the $64,000 region after a sharp sell-off.
Key observations:
BTC remains below its previous support structure.The daily trend continues to form lower highs and lower lows.Selling pressure remains dominant.RSI at 23.17 indicates deeply oversold conditions.A temporary recovery is possible, but a confirmed bullish reversal has not yet appeared.
My view: The broader trend remains bearish until Bitcoin reclaims important resistance levels.
🔍 2. Important Support Levels
These are the key downside levels I am watching:
$63,500: Immediate support and an important level for buyers.$63,000–$63,350: Critical support and liquidation-interest zone.$61,287: Next major downside target.$60,251: Important lower support zone.
If BTC loses $63,000 with strong selling volume, the market could experience another bearish expansion toward $61,287 and potentially $60,251.
🚀 3. Important Resistance Levels
Bitcoin needs to recover these levels before bulls can regain control.
$65,655: Important short-liquidation interest area.$66,325: Immediate major resistance.$67,500: Next recovery target.$70,000: Psychological resistance.$74,014: Major higher resistance.
A sustained daily close above $66,325 would improve the short-term outlook and could open the door toward $67,500–$70,000.
Until then, rallies may attract additional selling pressure.
📉 4. RSI & Market Momentum
One of the most important indicators right now is RSI.
According to the TradingView chart:
Daily RSI: 23.17The market is deeply oversold.Bearish momentum remains strong.
The daily RSI below 30 indicates extreme selling pressure. Historically, oversold conditions can create opportunities for short-term recovery.$SOL
However, remember:
Oversold does not automatically mean bullish.
Bitcoin can remain oversold for an extended period during a strong downtrend.$BNB
🐋 5. Market Sentiment & Institutional Data
The November 18 market report provides several important observations:
Crypto Fear & Greed Index: 11 (Extreme Fear).Crypto average RSI: 41.04.US Spot BTC ETF daily net flow: -$30.40 million.Bitcoin treasury weekly net inflow: +748 BTC.BTC Open Interest: $41.65 billion.BTC Funding Rate: 0.0038%.USDT Dominance: 8.061%.
These indicators show a cautious market environment.
ETF outflows and extreme fear suggest weak investor confidence, while positive Bitcoin treasury accumulation provides a contrasting longer-term signal.
The derivatives data also highlights important liquidation areas:
Long liquidation interest: Around $63,341.Short liquidation interest: Around $65,655.
These levels could become important during the next volatile move.
🎯 6. Bitcoin Next Move: Bullish or Bearish?
My current expectation is that Bitcoin remains bearish in the short term.
Scenario 1: Bearish Continuation
If BTC fails to recover above $65,655–$66,325 and sellers maintain control, another move toward $63,500 is possible.
A decisive breakdown below $63,000 could expose $61,287 and $60,251.
Scenario 2: Relief Bounce
If buyers successfully defend $63,000–$63,500, Bitcoin could attempt a recovery toward:
$65,655$66,325$67,500
A sustained recovery above $66,325 would be the first important sign of improving momentum.
My prediction: Bearish bias remains dominant, but oversold conditions increase the possibility of a temporary relief bounce.
🔥 7. BTC/USDT Trading Signal
Exchange: Binance
Pair: BTC/USDT Perpetual
Trade Setup: SHORT (Conditional)
Trading Style: Swing / Short-Term
Entry Zone: $64,800 – $65,600
Leverage: 3x–5x (Suggested maximum)
Take Profit 1: $63,500
Take Profit 2: $62,000
Take Profit 3: $61,300
Stop Loss: $66,500
Market Bias: Bearish
Confidence: Moderate (conditional setup)
Risk Management: Risk only 1% of trading capital per trade.
Entry Confirmation:
Wait for BTC to recover into the entry zone.Look for bearish rejection on the 1H or 4H timeframe.Confirm selling pressure before entering.Avoid chasing the price after a sharp red candle.
Important: If BTC breaks above $66,325 and holds that level, avoid forcing the short setup. Wait for a fresh market structure confirmation.
⚠️ 8. Final Thoughts
Bitcoin is currently at a critical decision point.
The daily chart remains bearish, market sentiment is extremely fearful, and the RSI indicates oversold conditions.
The most important level to watch is $63,000–$63,500.
If this support breaks, further downside becomes more likely. On the other hand, if buyers defend this zone and reclaim $66,325, we could see a meaningful short-term recovery.
My strategy is simple:
Don't chase the breakdown. Wait for confirmation, respect the key levels, and manage risk carefully.
The next major move could create significant opportunities for both bulls and bears.
What do you think? Will Bitcoin break below $63K, or are we approaching a strong recovery?
Share your thoughts in the comments!
Disclaimer: This analysis is for educational and informational purposes only, not financial advice. Cryptocurrency trading involves significant risk, especially when using leverage. Always conduct your own research (DYOR), use proper risk management, and never invest more than you can afford to lose.
#BTCUSDT.P #BTC🔥🔥🔥🔥🔥 #CryptoAnalysis📈📉🐋📅🚀 #BitcoinPredictionNext #BinanceSquareBTC
Bitcoin (BTC/USDT) Market Analysis | November 18, 2026
Bitcoin is facing significant selling pressure as the market continues to struggle below important support and resistance levels. After a sharp decline from the $80,000+ region, BTC is now trading around $64,379, and the daily chart suggests that sellers are still controlling the overall market structure.
However, with RSI entering deeply oversold territory, traders should also prepare for a possible short-term relief bounce.
Let's examine what could happen next.
📊 1. Bitcoin Technical Analysis
Current BTC Price: $64,379
Timeframe: 1D (Daily)
Daily Change: -0.83%
Daily High: $64,976
Daily Low: $64,100
Daily RSI: 23.17
Bitcoin has broken below its previous descending-channel support and experienced a strong bearish breakdown.
The price is now consolidating around the $64,000 region after a sharp sell-off.
Key observations:
BTC remains below its previous support structure.The daily trend continues to form lower highs and lower lows.Selling pressure remains dominant.RSI at 23.17 indicates deeply oversold conditions.A temporary recovery is possible, but a confirmed bullish reversal has not yet appeared.
My view: The broader trend remains bearish until Bitcoin reclaims important resistance levels.
🔍 2. Important Support Levels
These are the key downside levels I am watching:
$63,500: Immediate support and an important level for buyers.$63,000–$63,350: Critical support and liquidation-interest zone.$61,287: Next major downside target.$60,251: Important lower support zone.
If BTC loses $63,000 with strong selling volume, the market could experience another bearish expansion toward $61,287 and potentially $60,251.
🚀 3. Important Resistance Levels
Bitcoin needs to recover these levels before bulls can regain control.
$65,655: Important short-liquidation interest area.$66,325: Immediate major resistance.$67,500: Next recovery target.$70,000: Psychological resistance.$74,014: Major higher resistance.
A sustained daily close above $66,325 would improve the short-term outlook and could open the door toward $67,500–$70,000.
Until then, rallies may attract additional selling pressure.
📉 4. RSI & Market Momentum
One of the most important indicators right now is RSI.
According to the TradingView chart:
Daily RSI: 23.17The market is deeply oversold.Bearish momentum remains strong.
The daily RSI below 30 indicates extreme selling pressure. Historically, oversold conditions can create opportunities for short-term recovery.$SOL
However, remember:
Oversold does not automatically mean bullish.
Bitcoin can remain oversold for an extended period during a strong downtrend.$BNB
🐋 5. Market Sentiment & Institutional Data
The November 18 market report provides several important observations:
Crypto Fear & Greed Index: 11 (Extreme Fear).Crypto average RSI: 41.04.US Spot BTC ETF daily net flow: -$30.40 million.Bitcoin treasury weekly net inflow: +748 BTC.BTC Open Interest: $41.65 billion.BTC Funding Rate: 0.0038%.USDT Dominance: 8.061%.
These indicators show a cautious market environment.
ETF outflows and extreme fear suggest weak investor confidence, while positive Bitcoin treasury accumulation provides a contrasting longer-term signal.
The derivatives data also highlights important liquidation areas:
Long liquidation interest: Around $63,341.Short liquidation interest: Around $65,655.
These levels could become important during the next volatile move.
🎯 6. Bitcoin Next Move: Bullish or Bearish?
My current expectation is that Bitcoin remains bearish in the short term.
Scenario 1: Bearish Continuation
If BTC fails to recover above $65,655–$66,325 and sellers maintain control, another move toward $63,500 is possible.
A decisive breakdown below $63,000 could expose $61,287 and $60,251.
Scenario 2: Relief Bounce
If buyers successfully defend $63,000–$63,500, Bitcoin could attempt a recovery toward:
$65,655$66,325$67,500
A sustained recovery above $66,325 would be the first important sign of improving momentum.
My prediction: Bearish bias remains dominant, but oversold conditions increase the possibility of a temporary relief bounce.
🔥 7. BTC/USDT Trading Signal
Exchange: Binance
Pair: BTC/USDT Perpetual
Trade Setup: SHORT (Conditional)
Trading Style: Swing / Short-Term
Entry Zone: $64,800 – $65,600
Leverage: 3x–5x (Suggested maximum)
Take Profit 1: $63,500
Take Profit 2: $62,000
Take Profit 3: $61,300
Stop Loss: $66,500
Market Bias: Bearish
Confidence: Moderate (conditional setup)
Risk Management: Risk only 1% of trading capital per trade.
Entry Confirmation:
Wait for BTC to recover into the entry zone.Look for bearish rejection on the 1H or 4H timeframe.Confirm selling pressure before entering.Avoid chasing the price after a sharp red candle.
Important: If BTC breaks above $66,325 and holds that level, avoid forcing the short setup. Wait for a fresh market structure confirmation.
⚠️ 8. Final Thoughts
Bitcoin is currently at a critical decision point.
The daily chart remains bearish, market sentiment is extremely fearful, and the RSI indicates oversold conditions.
The most important level to watch is $63,000–$63,500.
If this support breaks, further downside becomes more likely. On the other hand, if buyers defend this zone and reclaim $66,325, we could see a meaningful short-term recovery.
My strategy is simple:
Don't chase the breakdown. Wait for confirmation, respect the key levels, and manage risk carefully.
The next major move could create significant opportunities for both bulls and bears.
What do you think? Will Bitcoin break below $63K, or are we approaching a strong recovery?
Share your thoughts in the comments!
Disclaimer: This analysis is for educational and informational purposes only, not financial advice. Cryptocurrency trading involves significant risk, especially when using leverage. Always conduct your own research (DYOR), use proper risk management, and never invest more than you can afford to lose.
#BTCUSDT.P #BTC🔥🔥🔥🔥🔥 #CryptoAnalysis📈📉🐋📅🚀 #BitcoinPredictionNext #BinanceSquareBTC
66

·
--
🚨 BTC BIG MOVE INCOMING! 🐻📉
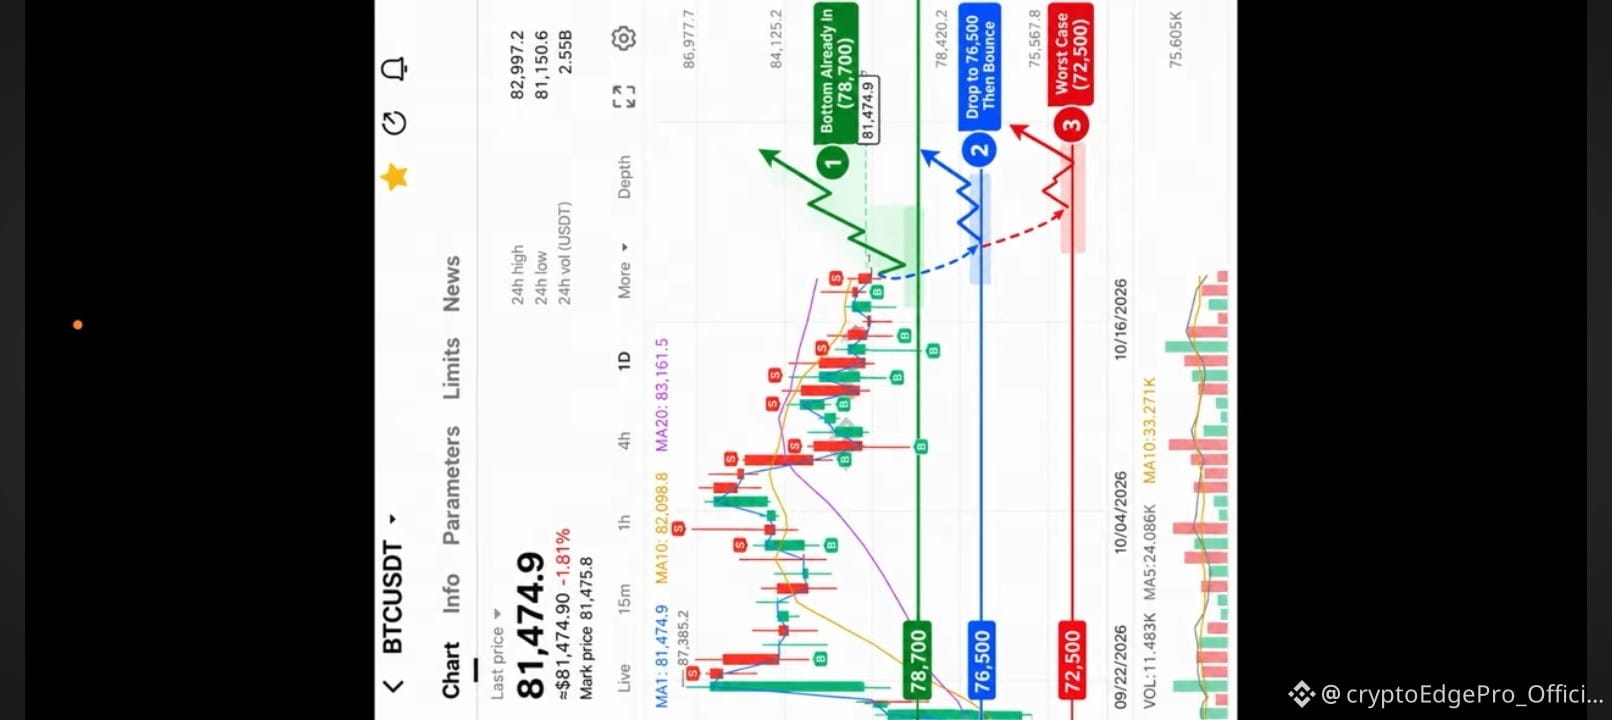
Bitcoin is trading around $81,474 and the next move could be VERY important! ⚠️
🎯 My BTC Prediction:
🟢 Scenario 1: If BTC holds the $78,700 support, we could see a strong bounce toward $84K–$86K.
🔵 Scenario 2: If BTC breaks below $78,700, the next support zone could be around $76,500.
🔴 Worst Case: If selling pressure increases, BTC could drop toward $72,500.
👀 I'm watching these levels closely. The market can change fast, so don't trade blindly!
💬 What's your prediction? 🚀 BTC BOUNCE or 📉 BTC CRASH?
#bitcoin #BTC走势分析 #CryptoMarket #BinanceSquareFamily #BitcoinPredictionNext #CryptoTrading #BTCUSDT
🚨 BTC BIG MOVE INCOMING! 🐻📉
Bitcoin is trading around $81,474 and the next move could be VERY important! ⚠️
🎯 My BTC Prediction:
🟢 Scenario 1: If BTC holds the $78,700 support, we could see a strong bounce toward $84K–$86K.
🔵 Scenario 2: If BTC breaks below $78,700, the next support zone could be around $76,500.
🔴 Worst Case: If selling pressure increases, BTC could drop toward $72,500.
👀 I'm watching these levels closely. The market can change fast, so don't trade blindly!
💬 What's your prediction? 🚀 BTC BOUNCE or 📉 BTC CRASH?
#bitcoin #BTC走势分析 #CryptoMarket #BinanceSquareFamily #BitcoinPredictionNext #CryptoTrading #BTCUSDT
Bitcoin is trading around $81,474 and the next move could be VERY important! ⚠️
🎯 My BTC Prediction:
🟢 Scenario 1: If BTC holds the $78,700 support, we could see a strong bounce toward $84K–$86K.
🔵 Scenario 2: If BTC breaks below $78,700, the next support zone could be around $76,500.
🔴 Worst Case: If selling pressure increases, BTC could drop toward $72,500.
👀 I'm watching these levels closely. The market can change fast, so don't trade blindly!
💬 What's your prediction? 🚀 BTC BOUNCE or 📉 BTC CRASH?
#bitcoin #BTC走势分析 #CryptoMarket #BinanceSquareFamily #BitcoinPredictionNext #CryptoTrading #BTCUSDT
7
2
1k
Log in to explore more content
Join global crypto users on Binance Square
⚡️ Get latest and useful information about crypto.
💬 Trusted by the world’s largest crypto exchange.
👍 Discover real insights from verified creators.
Email / Phone number
Trending Topics
1
#NvidiaBeatsEstimatesWith$130BQ4Outlook
6,748 views
114 Discussing
2
#AnthropicIPOPriceCouldExceed$80
12,499 views
108 Discussing
3
#CanNvidia’sDataCenterGrowthContinue?
34,969 views
514 Discussing
4
#CanadaAndUSLaunchOperationNiagaraAgainstApprovalPhishing
15 views
5 Discussing
5
#BankOfEnglandUnveilsClearingHousePathwayCoveringDLTFirms
1,062 views
22 Discussing
6
#DBSAndCirclePartnerToExpandAsianInstitutionsUSDCAccess
2,481 views
43 Discussing
7
#LedgerHardwareImplantReportsExtendToDubai
6,693 views
170 Discussing
8
#NvidiaBoardNotConsideringHuang’sReturnasCEO
197,748 views
1,442 Discussing
9
#KOSPIFalls2.59%ToLowestCloseSinceFebruary
56,091 views
636 Discussing
10
#AnthropicClearedToListOnNasdaqAsANT
49,419 views
512 Discussing