
#bitcoinanalysis
bitcoinanalysis
964,312 views
4,158 Discussing
Hot
Latest

·
--
The levels for this week are now printed in black and white. 📊
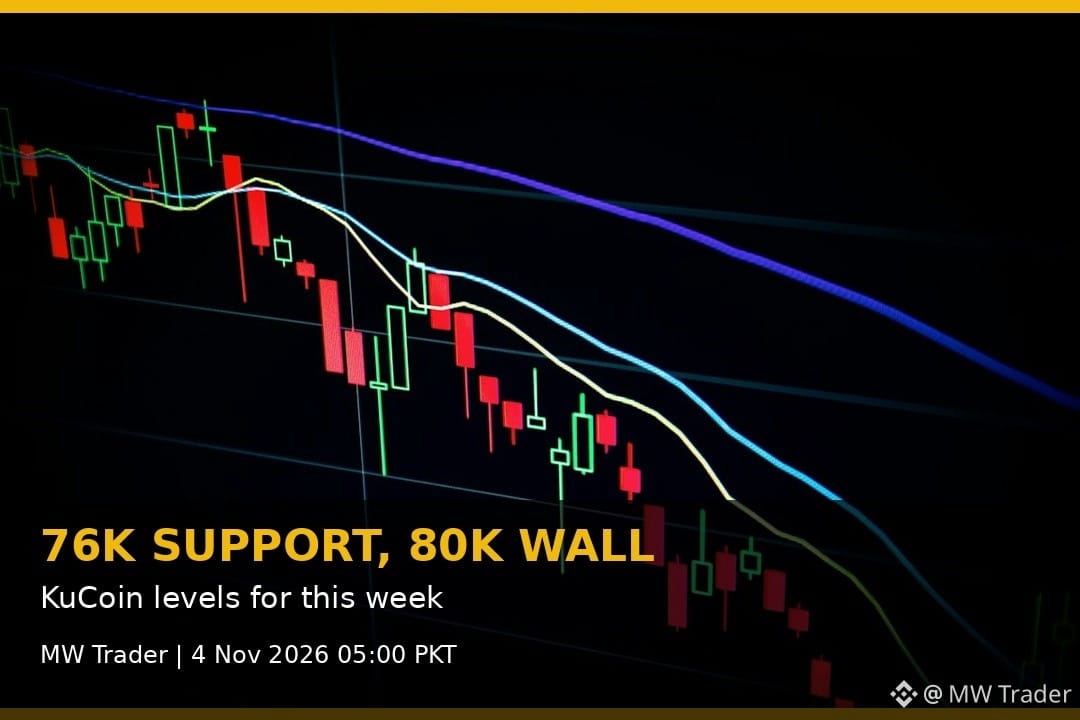
KuCoin reported on 3 November that Bitcoin is watching support at 76,000 to 76,600 dollars and resistance at 79,500 to 80,500 dollars, after United States equities slipped, with the Nasdaq down 1.07 percent and the S and P 500 down 0.51 percent. 🚀 My reading is that these two zones frame the whole week, because Bitcoin at 77,384 sits between them with no edge either way. A hold above 76,000 keeps the recovery alive, a reclaim of 79,500 opens the door to 80,500, and a loss of 76,000 hands control back to sellers. Until one zone breaks, every smaller move is noise inside the frame.
Which zone breaks first this week, 76,000 below or 79,500 above? 🤔
Follow for more trades.
#Crypto #Bitcoin #FuturesTrading #TradingSignals #BitcoinAnalysis
The levels for this week are now printed in black and white. 📊
KuCoin reported on 3 November that Bitcoin is watching support at 76,000 to 76,600 dollars and resistance at 79,500 to 80,500 dollars, after United States equities slipped, with the Nasdaq down 1.07 percent and the S and P 500 down 0.51 percent. 🚀 My reading is that these two zones frame the whole week, because Bitcoin at 77,384 sits between them with no edge either way. A hold above 76,000 keeps the recovery alive, a reclaim of 79,500 opens the door to 80,500, and a loss of 76,000 hands control back to sellers. Until one zone breaks, every smaller move is noise inside the frame.
Which zone breaks first this week, 76,000 below or 79,500 above? 🤔
Follow for more trades.
#Crypto #Bitcoin #FuturesTrading #TradingSignals #BitcoinAnalysis
KuCoin reported on 3 November that Bitcoin is watching support at 76,000 to 76,600 dollars and resistance at 79,500 to 80,500 dollars, after United States equities slipped, with the Nasdaq down 1.07 percent and the S and P 500 down 0.51 percent. 🚀 My reading is that these two zones frame the whole week, because Bitcoin at 77,384 sits between them with no edge either way. A hold above 76,000 keeps the recovery alive, a reclaim of 79,500 opens the door to 80,500, and a loss of 76,000 hands control back to sellers. Until one zone breaks, every smaller move is noise inside the frame.
Which zone breaks first this week, 76,000 below or 79,500 above? 🤔
Follow for more trades.
#Crypto #Bitcoin #FuturesTrading #TradingSignals #BitcoinAnalysis
15

·
--

Article
Everyone’s Watching $76K. Here’s the TrapMost traders draw a line on the chart and treat it like a promise. Price has no idea your line exists.
Still, a lot of eyes are on the same one right now. BTC has been bouncing around $76,000 to $78,000, and the October 30 low near $76,141 is the level analysts keep pointing to. ETH is moving in a tight box, roughly $2,200 to $2,300.
The pressure is coming from flows, not drama. US spot Bitcoin ETFs saw about $399M in net outflows on Nov 2, and spot Ether ETFs have now logged six straight days of withdrawals, per SoSoValue and Farside data.
The if/then, as I see it. If BTC holds above $76K, the range people discuss is $76K to $82K, with the 20-day and 50-day averages around $81K to $82K as the ceiling. If it closes below, the next areas on the radar are about $75.5K, then the 200-day average near $73K. Levels I’m watching, not calls.
My rule on days like this: decide what proves you wrong before price gets there. If you’re making that decision mid-candle, you’re already emotional. Annoying? Yes. Cheaper than improvising? Also yes.
Which will you track more this week: ETF flow numbers or the $76K level?
Disclaimer
Not financial advice. For education only, not trade calls. Crypto is volatile, so do your own research.
#BitcoinAnalysis #CryptoMarket $BTC $ETH
Sources: SoSoValue, Farside Investors, CoinDesk, FXStreet, 24/7 Wall St.
Everyone’s Watching $76K. Here’s the Trap
Most traders draw a line on the chart and treat it like a promise. Price has no idea your line exists.
Still, a lot of eyes are on the same one right now. BTC has been bouncing around $76,000 to $78,000, and the October 30 low near $76,141 is the level analysts keep pointing to. ETH is moving in a tight box, roughly $2,200 to $2,300.
The pressure is coming from flows, not drama. US spot Bitcoin ETFs saw about $399M in net outflows on Nov 2, and spot Ether ETFs have now logged six straight days of withdrawals, per SoSoValue and Farside data.
The if/then, as I see it. If BTC holds above $76K, the range people discuss is $76K to $82K, with the 20-day and 50-day averages around $81K to $82K as the ceiling. If it closes below, the next areas on the radar are about $75.5K, then the 200-day average near $73K. Levels I’m watching, not calls.
My rule on days like this: decide what proves you wrong before price gets there. If you’re making that decision mid-candle, you’re already emotional. Annoying? Yes. Cheaper than improvising? Also yes.
Which will you track more this week: ETF flow numbers or the $76K level?
Disclaimer
Not financial advice. For education only, not trade calls. Crypto is volatile, so do your own research.
#BitcoinAnalysis #CryptoMarket $BTC $ETH
Sources: SoSoValue, Farside Investors, CoinDesk, FXStreet, 24/7 Wall St.
Still, a lot of eyes are on the same one right now. BTC has been bouncing around $76,000 to $78,000, and the October 30 low near $76,141 is the level analysts keep pointing to. ETH is moving in a tight box, roughly $2,200 to $2,300.
The pressure is coming from flows, not drama. US spot Bitcoin ETFs saw about $399M in net outflows on Nov 2, and spot Ether ETFs have now logged six straight days of withdrawals, per SoSoValue and Farside data.
The if/then, as I see it. If BTC holds above $76K, the range people discuss is $76K to $82K, with the 20-day and 50-day averages around $81K to $82K as the ceiling. If it closes below, the next areas on the radar are about $75.5K, then the 200-day average near $73K. Levels I’m watching, not calls.
My rule on days like this: decide what proves you wrong before price gets there. If you’re making that decision mid-candle, you’re already emotional. Annoying? Yes. Cheaper than improvising? Also yes.
Which will you track more this week: ETF flow numbers or the $76K level?
Disclaimer
Not financial advice. For education only, not trade calls. Crypto is volatile, so do your own research.
#BitcoinAnalysis #CryptoMarket $BTC $ETH
Sources: SoSoValue, Farside Investors, CoinDesk, FXStreet, 24/7 Wall St.
88
·
--
Bitcoin is stuck between 77,000 and 80,000 dollars, and the next hurdle is clearly marked. 📊
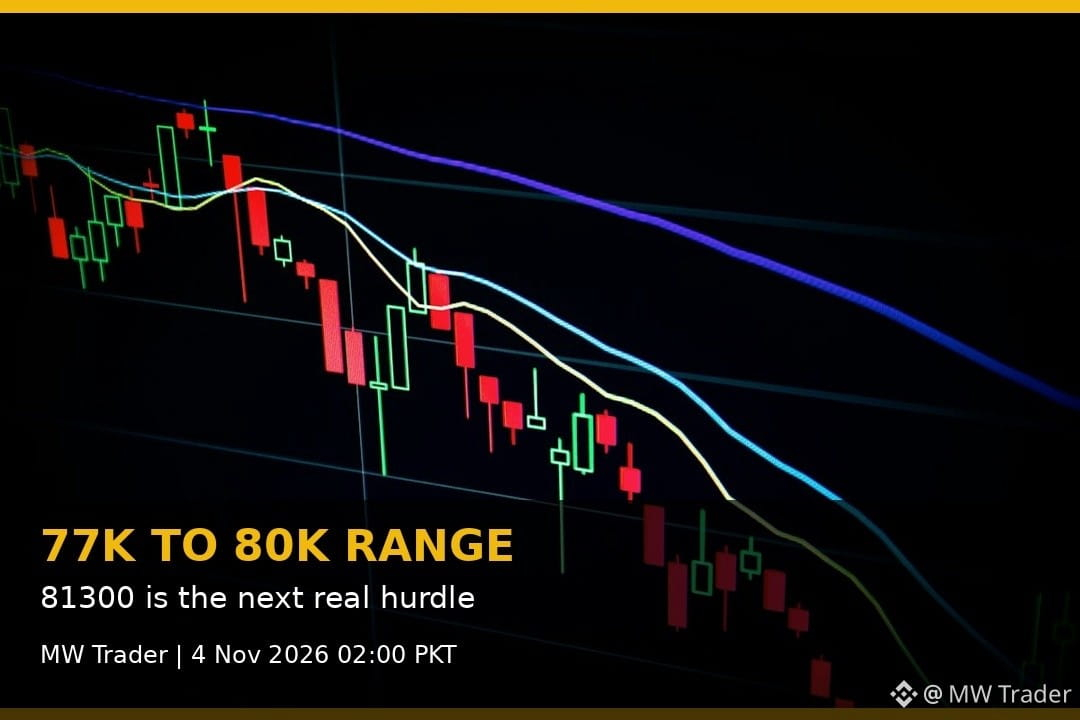
FXStreet reported on 3 November, citing Bitfinex Alpha, that Bitcoin could stay trapped in the 77,000 to 80,000 dollar zone, where investors acquired roughly 1.05 million BTC, with 81,300 dollars as the next selling hurdle and options pricing pointing to a range of 74,400 to 81,750 dollars through the 6 November expiry. 🚀 My reading is that this range is a waiting room, not a trend. Inside it, every bounce toward 80,000 gets sold by traders waiting to exit, and every dip toward 77,000 gets bought passively, not aggressively, which is why the market keeps drifting sideways instead of choosing a direction.
Which side of the waiting room breaks first, 81,300 above or 77,000 below? 🤔
Follow for more trades.
#Crypto #Bitcoin #FuturesTrading #TradingSignals #BitcoinAnalysis
Bitcoin is stuck between 77,000 and 80,000 dollars, and the next hurdle is clearly marked. 📊
FXStreet reported on 3 November, citing Bitfinex Alpha, that Bitcoin could stay trapped in the 77,000 to 80,000 dollar zone, where investors acquired roughly 1.05 million BTC, with 81,300 dollars as the next selling hurdle and options pricing pointing to a range of 74,400 to 81,750 dollars through the 6 November expiry. 🚀 My reading is that this range is a waiting room, not a trend. Inside it, every bounce toward 80,000 gets sold by traders waiting to exit, and every dip toward 77,000 gets bought passively, not aggressively, which is why the market keeps drifting sideways instead of choosing a direction.
Which side of the waiting room breaks first, 81,300 above or 77,000 below? 🤔
Follow for more trades.
#Crypto #Bitcoin #FuturesTrading #TradingSignals #BitcoinAnalysis
FXStreet reported on 3 November, citing Bitfinex Alpha, that Bitcoin could stay trapped in the 77,000 to 80,000 dollar zone, where investors acquired roughly 1.05 million BTC, with 81,300 dollars as the next selling hurdle and options pricing pointing to a range of 74,400 to 81,750 dollars through the 6 November expiry. 🚀 My reading is that this range is a waiting room, not a trend. Inside it, every bounce toward 80,000 gets sold by traders waiting to exit, and every dip toward 77,000 gets bought passively, not aggressively, which is why the market keeps drifting sideways instead of choosing a direction.
Which side of the waiting room breaks first, 81,300 above or 77,000 below? 🤔
Follow for more trades.
#Crypto #Bitcoin #FuturesTrading #TradingSignals #BitcoinAnalysis
3

₿ BITCOIN CONTINUES TO LEAD THE MARKET!
Bitcoin remains one of the most important indicators of overall crypto market direction.
BTC is trading around $77,600, with an approximate 24-hour gain of 0.91%.
The key question is whether buyers can maintain this momentum and support further price stability.
Always watch volume, market structure and important price levels.
#BinanceSquare #BTC #BitcoinAnalysis #CryptoTrading
₿ BITCOIN CONTINUES TO LEAD THE MARKET!
Bitcoin remains one of the most important indicators of overall crypto market direction.
BTC is trading around $77,600, with an approximate 24-hour gain of 0.91%.
The key question is whether buyers can maintain this momentum and support further price stability.
Always watch volume, market structure and important price levels.
#BinanceSquare #BTC #BitcoinAnalysis #CryptoTrading
Bitcoin remains one of the most important indicators of overall crypto market direction.
BTC is trading around $77,600, with an approximate 24-hour gain of 0.91%.
The key question is whether buyers can maintain this momentum and support further price stability.
Always watch volume, market structure and important price levels.
#BinanceSquare #BTC #BitcoinAnalysis #CryptoTrading
24

🚨 BTC SIGNAL: BITCOIN AT A CRITICAL SUPPORT ZONE! ₿
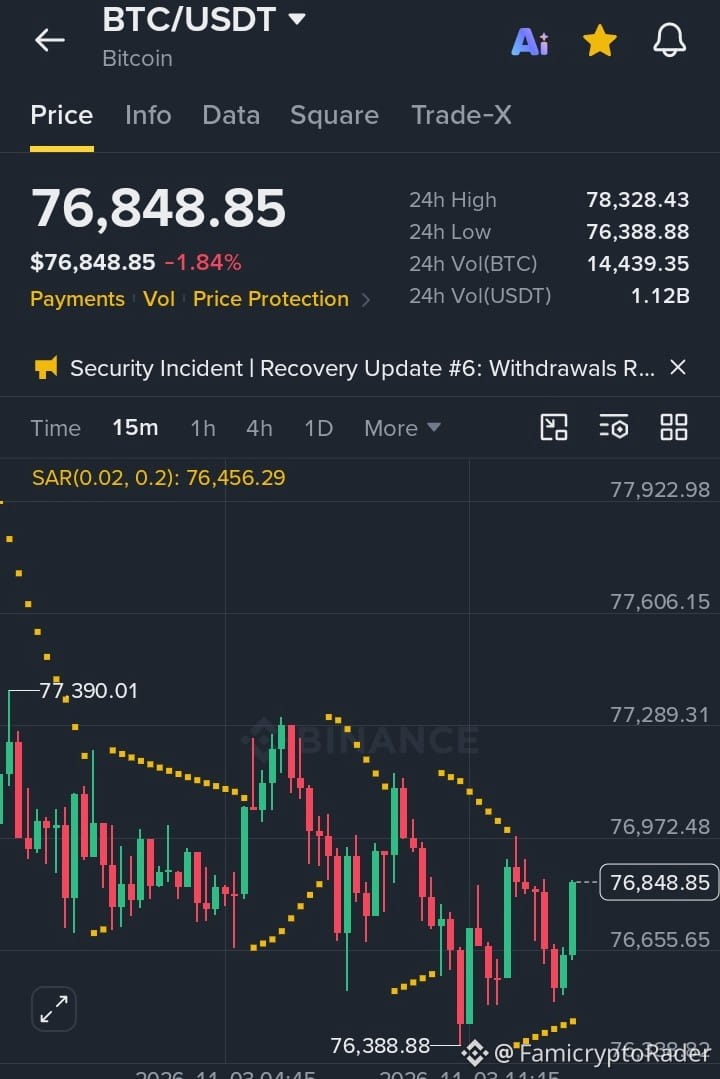
Bitcoin is trading around $76,500, down approximately 2.2% over the last 24 hours.
The market is showing bearish pressure, and traders are watching one critical zone: $76,000–$76,400.
📊 KEY LEVELS
🟢 Resistance: $78,000–$78,500
🔴 Support: $76,000–$76,400
🎯 TRADING SCENARIOS
📈 BULLISH: A confirmed breakout above $78,000 could open the way toward:
• $79,500
• $80,000
• $82,000
📉 BEARISH: A confirmed breakdown below $76,400 could expose:
• $75,000 • $74,600 • $72,000
⚠️ MY STRATEGY: No blind entries. Wait for breakout or breakdown confirmation, monitor trading volume, and manage risk.
❓ BTC HOLDERS & TRADERS:
Are you expecting a recovery toward $80K or another correction toward $74K?
👇 Share your analysis!
#Bitcoin #BTC #CryptoSignals #BitcoinAnalysis
$BTC
{future}(BTCUSDT)
🚨 BTC SIGNAL: BITCOIN AT A CRITICAL SUPPORT ZONE! ₿
Bitcoin is trading around $76,500, down approximately 2.2% over the last 24 hours.
The market is showing bearish pressure, and traders are watching one critical zone: $76,000–$76,400.
📊 KEY LEVELS
🟢 Resistance: $78,000–$78,500
🔴 Support: $76,000–$76,400
🎯 TRADING SCENARIOS
📈 BULLISH: A confirmed breakout above $78,000 could open the way toward:
• $79,500
• $80,000
• $82,000
📉 BEARISH: A confirmed breakdown below $76,400 could expose:
• $75,000 • $74,600 • $72,000
⚠️ MY STRATEGY: No blind entries. Wait for breakout or breakdown confirmation, monitor trading volume, and manage risk.
❓ BTC HOLDERS & TRADERS:
Are you expecting a recovery toward $80K or another correction toward $74K?
👇 Share your analysis!
#Bitcoin #BTC #CryptoSignals #BitcoinAnalysis
$BTC
Bitcoin is trading around $76,500, down approximately 2.2% over the last 24 hours.
The market is showing bearish pressure, and traders are watching one critical zone: $76,000–$76,400.
📊 KEY LEVELS
🟢 Resistance: $78,000–$78,500
🔴 Support: $76,000–$76,400
🎯 TRADING SCENARIOS
📈 BULLISH: A confirmed breakout above $78,000 could open the way toward:
• $79,500
• $80,000
• $82,000
📉 BEARISH: A confirmed breakdown below $76,400 could expose:
• $75,000 • $74,600 • $72,000
⚠️ MY STRATEGY: No blind entries. Wait for breakout or breakdown confirmation, monitor trading volume, and manage risk.
❓ BTC HOLDERS & TRADERS:
Are you expecting a recovery toward $80K or another correction toward $74K?
👇 Share your analysis!
#Bitcoin #BTC #CryptoSignals #BitcoinAnalysis
$BTC
Yevette Kirley pEcf:
bearish only
1
1
84

🚨 Bitcoin hilarious pattern Outlook: Key Levels to Watch
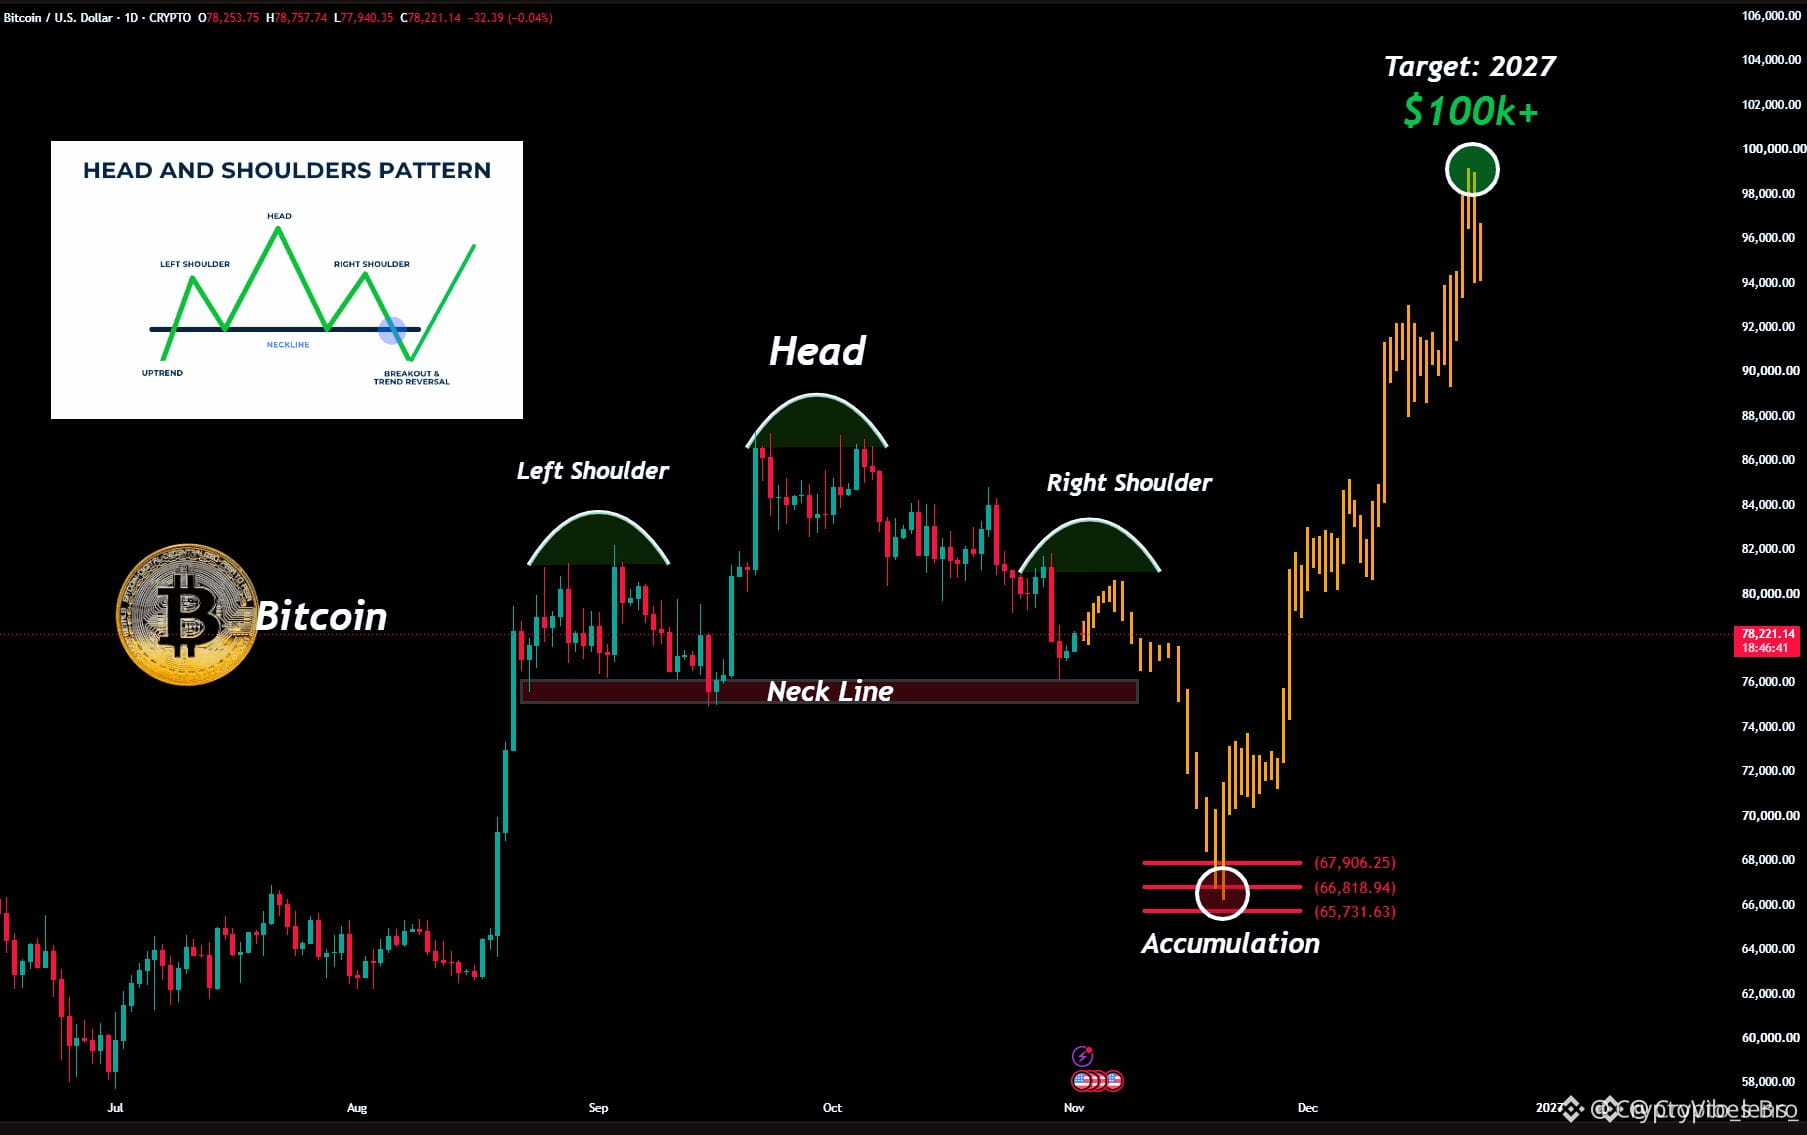
Bitcoin is approaching a critical resistance zone around $80K. A rejection here could trigger another downside move before the next major bullish rally.
📉 Potential Price Scenario: $78K → $80K → $75K → $65K → Potential Bull Run
The $80K level is worth watching closely. If BTC fails to break above this resistance, a pullback toward $65K could become a possible scenario.
However, market conditions can change quickly, so always manage your risk and do your own research.
👀 What do you think? Will BTC reject $80K or break above it?$BTC
#Bitcoin #BTC #CryptoMarket #BitcoinAnalysis #CryptoTrading
🚨 Bitcoin hilarious pattern Outlook: Key Levels to Watch
Bitcoin is approaching a critical resistance zone around $80K. A rejection here could trigger another downside move before the next major bullish rally.
📉 Potential Price Scenario: $78K → $80K → $75K → $65K → Potential Bull Run
The $80K level is worth watching closely. If BTC fails to break above this resistance, a pullback toward $65K could become a possible scenario.
However, market conditions can change quickly, so always manage your risk and do your own research.
👀 What do you think? Will BTC reject $80K or break above it?$BTC
#Bitcoin #BTC #CryptoMarket #BitcoinAnalysis #CryptoTrading
Bitcoin is approaching a critical resistance zone around $80K. A rejection here could trigger another downside move before the next major bullish rally.
📉 Potential Price Scenario: $78K → $80K → $75K → $65K → Potential Bull Run
The $80K level is worth watching closely. If BTC fails to break above this resistance, a pullback toward $65K could become a possible scenario.
However, market conditions can change quickly, so always manage your risk and do your own research.
👀 What do you think? Will BTC reject $80K or break above it?$BTC
#Bitcoin #BTC #CryptoMarket #BitcoinAnalysis #CryptoTrading
183

🚨 Bitcoin (BTC) Price Analysis: Key Levels to Watch
Bitcoin is facing selling pressure as traders monitor the $76,000 support zone. Institutional ETF outflows and market uncertainty continue to influence short-term sentiment.
📊 BTC Technical Levels
- Current Price: Around $76,600
- Support: $76,000–$75,000
- Resistance: $78,000–$80,000
📈 Market Outlook
Holding above $76,000 could support a recovery toward $78,000. However, a break below support may increase selling pressure toward $75,000. A move above $80,000 would strengthen the bullish outlook.
⚡ What to Watch: Bitcoin ETF flows, trading volume, and daily candle closes will be important for the next market move.
#Bitcoin #BTC #CryptoMarket #BitcoinAnalysis
$BTC
{spot}(BTCUSDT)
🚨 Bitcoin (BTC) Price Analysis: Key Levels to Watch
Bitcoin is facing selling pressure as traders monitor the $76,000 support zone. Institutional ETF outflows and market uncertainty continue to influence short-term sentiment.
📊 BTC Technical Levels
- Current Price: Around $76,600
- Support: $76,000–$75,000
- Resistance: $78,000–$80,000
📈 Market Outlook
Holding above $76,000 could support a recovery toward $78,000. However, a break below support may increase selling pressure toward $75,000. A move above $80,000 would strengthen the bullish outlook.
⚡ What to Watch: Bitcoin ETF flows, trading volume, and daily candle closes will be important for the next market move.
#Bitcoin #BTC #CryptoMarket #BitcoinAnalysis
$BTC
Bitcoin is facing selling pressure as traders monitor the $76,000 support zone. Institutional ETF outflows and market uncertainty continue to influence short-term sentiment.
📊 BTC Technical Levels
- Current Price: Around $76,600
- Support: $76,000–$75,000
- Resistance: $78,000–$80,000
📈 Market Outlook
Holding above $76,000 could support a recovery toward $78,000. However, a break below support may increase selling pressure toward $75,000. A move above $80,000 would strengthen the bullish outlook.
⚡ What to Watch: Bitcoin ETF flows, trading volume, and daily candle closes will be important for the next market move.
#Bitcoin #BTC #CryptoMarket #BitcoinAnalysis
$BTC

62

·
--
$BTC
{spot}(BTCUSDT)
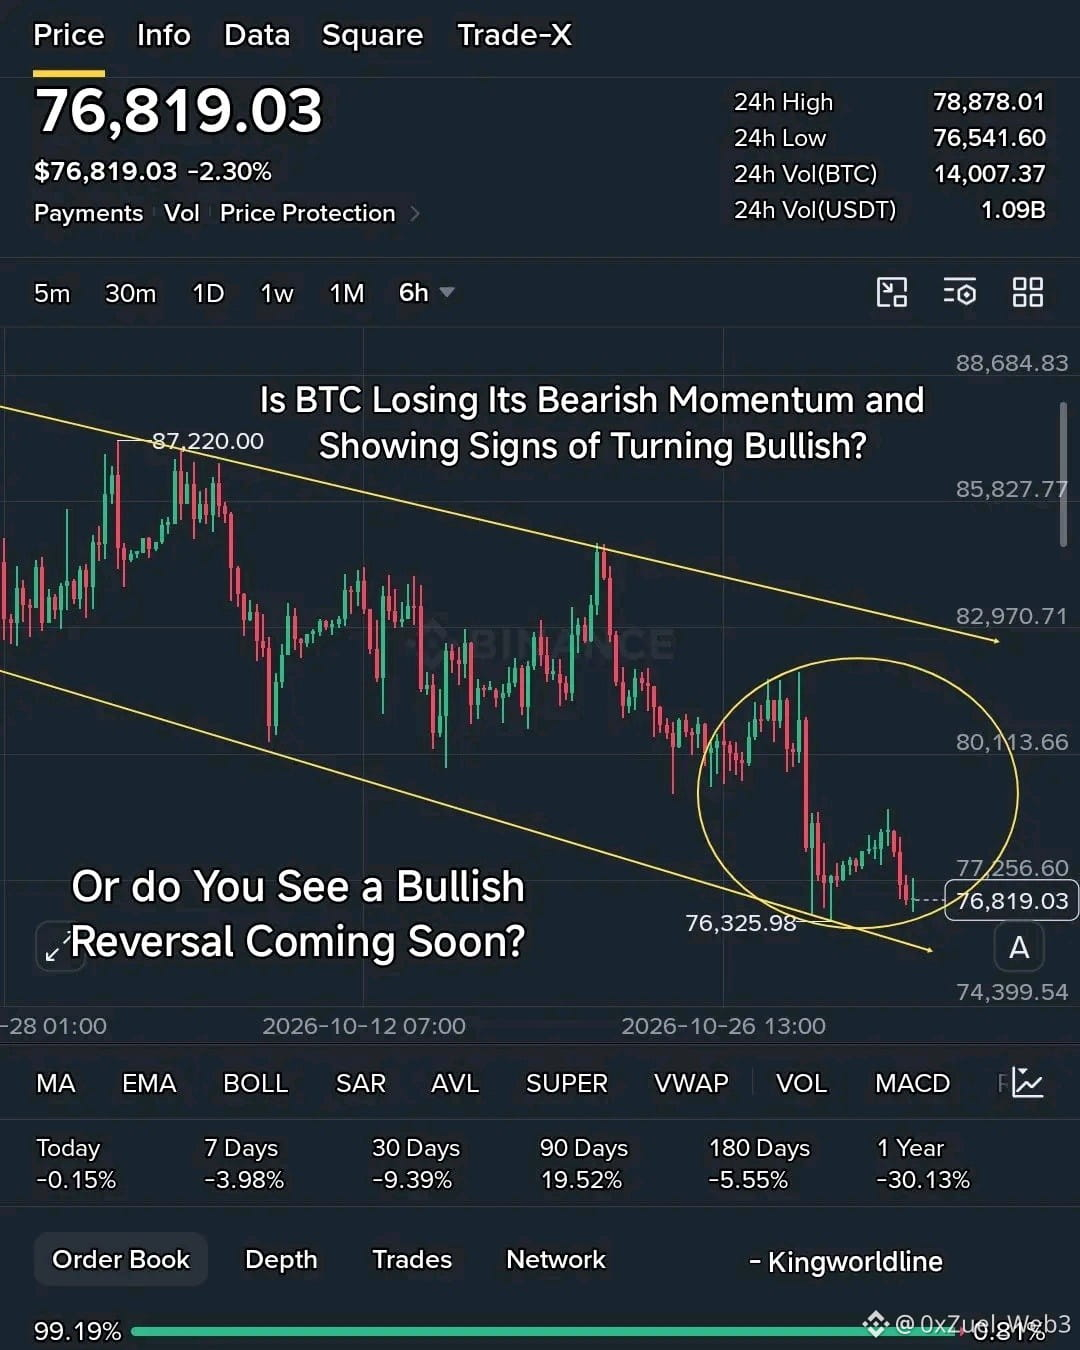
BTC: Is the Bearish Momentum Fading? 📉📈
Bitcoin appears to be showing signs of weakening bearish momentum, raising questions about a possible shift towards bullish conditions.
However, a weakening trend does not automatically confirm a reversal. Traders should watch for key support levels, resistance zones, market structure, and confirmation before making decisions.
Remember not to predict a reversal based on emotions. Wait for confirmation, manage your risk, and remain disciplined.
🤔 What do you think is coming next?
* 📉 Further bearish movement?
* 📈 A bullish recovery very soon?
Share your analysis in the comments!
#btc70k #Bitcoin #BitcoinAnalysis
$BTC
BTC: Is the Bearish Momentum Fading? 📉📈
Bitcoin appears to be showing signs of weakening bearish momentum, raising questions about a possible shift towards bullish conditions.
However, a weakening trend does not automatically confirm a reversal. Traders should watch for key support levels, resistance zones, market structure, and confirmation before making decisions.
Remember not to predict a reversal based on emotions. Wait for confirmation, manage your risk, and remain disciplined.
🤔 What do you think is coming next?
* 📉 Further bearish movement?
* 📈 A bullish recovery very soon?
Share your analysis in the comments!
#btc70k #Bitcoin #BitcoinAnalysis
BTC: Is the Bearish Momentum Fading? 📉📈
Bitcoin appears to be showing signs of weakening bearish momentum, raising questions about a possible shift towards bullish conditions.
However, a weakening trend does not automatically confirm a reversal. Traders should watch for key support levels, resistance zones, market structure, and confirmation before making decisions.
Remember not to predict a reversal based on emotions. Wait for confirmation, manage your risk, and remain disciplined.
🤔 What do you think is coming next?
* 📉 Further bearish movement?
* 📈 A bullish recovery very soon?
Share your analysis in the comments!
#btc70k #Bitcoin #BitcoinAnalysis
1
83

·
--
🚨 BITCOIN IS BACK NEAR $78K — BUT IS THE MARKET REALLY RECOVERING?
Bitcoin is showing signs of recovery, but the bigger picture is still uncertain.
Here are 3 things I’m watching:
📉 ETF Outflows: US spot Bitcoin ETFs recorded approximately $643 million in net outflows on October 30.
📊 Key Levels: The $76K area is an important support zone, while $80K is a level the market needs to reclaim.
🌍 Market Sentiment: Investors are also watching global economic events and institutional demand.
$BTC
My Take:
A short-term recovery doesn’t automatically mean a new bullish trend. ETF flows, market volume and investor confidence deserve close attention.
💬 Let’s discuss:
Do you think Bitcoin can reclaim $80K, or will sellers remain in control?
Share your analysis below. 👇
#Bitcoin #BTC #Binance #CryptoNews #BitcoinAnalysis
{future}(BTCUSDT)
🚨 BITCOIN IS BACK NEAR $78K — BUT IS THE MARKET REALLY RECOVERING?
Bitcoin is showing signs of recovery, but the bigger picture is still uncertain.
Here are 3 things I’m watching:
📉 ETF Outflows: US spot Bitcoin ETFs recorded approximately $643 million in net outflows on October 30.
📊 Key Levels: The $76K area is an important support zone, while $80K is a level the market needs to reclaim.
🌍 Market Sentiment: Investors are also watching global economic events and institutional demand.
$BTC
My Take:
A short-term recovery doesn’t automatically mean a new bullish trend. ETF flows, market volume and investor confidence deserve close attention.
💬 Let’s discuss:
Do you think Bitcoin can reclaim $80K, or will sellers remain in control?
Share your analysis below. 👇
#Bitcoin #BTC #Binance #CryptoNews #BitcoinAnalysis
Bitcoin is showing signs of recovery, but the bigger picture is still uncertain.
Here are 3 things I’m watching:
📉 ETF Outflows: US spot Bitcoin ETFs recorded approximately $643 million in net outflows on October 30.
📊 Key Levels: The $76K area is an important support zone, while $80K is a level the market needs to reclaim.
🌍 Market Sentiment: Investors are also watching global economic events and institutional demand.
$BTC
My Take:
A short-term recovery doesn’t automatically mean a new bullish trend. ETF flows, market volume and investor confidence deserve close attention.
💬 Let’s discuss:
Do you think Bitcoin can reclaim $80K, or will sellers remain in control?
Share your analysis below. 👇
#Bitcoin #BTC #Binance #CryptoNews #BitcoinAnalysis
1
61

·
--
Bearish
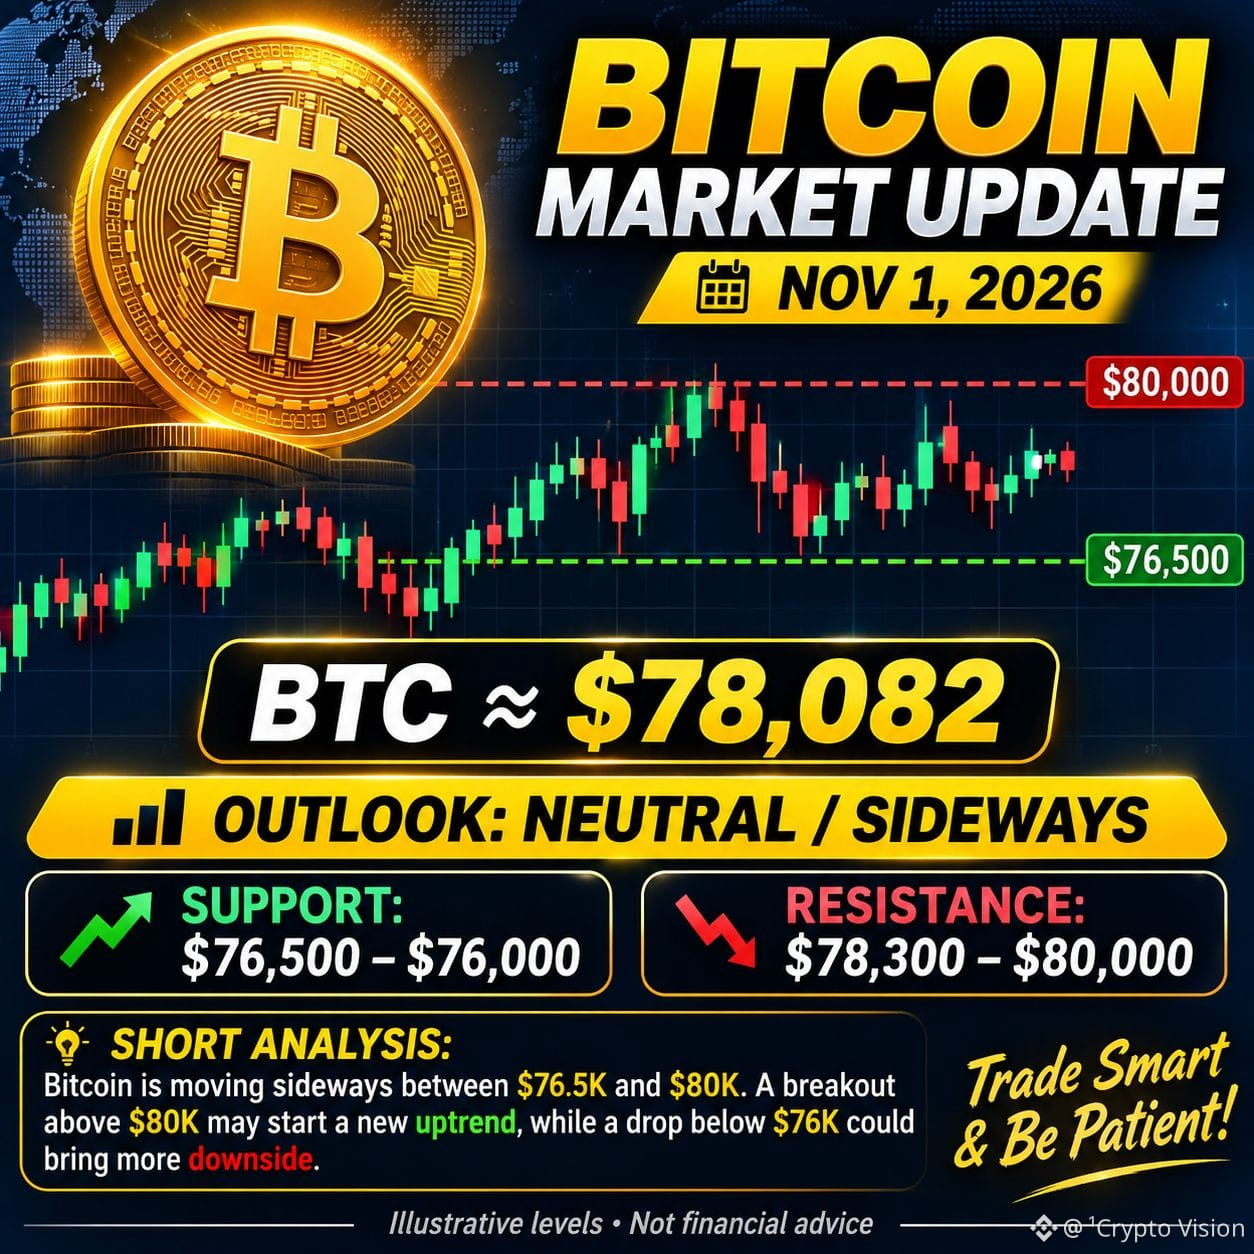
$BTC coin is showing mixed momentum after recent weakness. Buyers are trying to stabilize the price, but a strong recovery is not confirmed yet.
Support: $76,500 – $76,000
Resistance: $78,300 – $80,000
Bullish signal: Break above $80,000.
Bearish signal: Fall below $76,000.
Conclusion: Short-term outlook is sideways with a cautious bias. These levels are estimates, not guarantees.
$BTC #BTC #BitcoinAnalysis #CryptoMarketAlert #CryptoVision
{spot}(BTCUSDT)
$BTC coin is showing mixed momentum after recent weakness. Buyers are trying to stabilize the price, but a strong recovery is not confirmed yet.
Support: $76,500 – $76,000
Resistance: $78,300 – $80,000
Bullish signal: Break above $80,000.
Bearish signal: Fall below $76,000.
Conclusion: Short-term outlook is sideways with a cautious bias. These levels are estimates, not guarantees.
$BTC #BTC #BitcoinAnalysis #CryptoMarketAlert #CryptoVision
Support: $76,500 – $76,000
Resistance: $78,300 – $80,000
Bullish signal: Break above $80,000.
Bearish signal: Fall below $76,000.
Conclusion: Short-term outlook is sideways with a cautious bias. These levels are estimates, not guarantees.
$BTC #BTC #BitcoinAnalysis #CryptoMarketAlert #CryptoVision
1

·
--
Bullish
🚨 $BTC TODAY: BITCOIN STARTS NOVEMBER NEAR $78K — BULLS OR BEARS? 📉📈
{spot}(BTCUSDT)
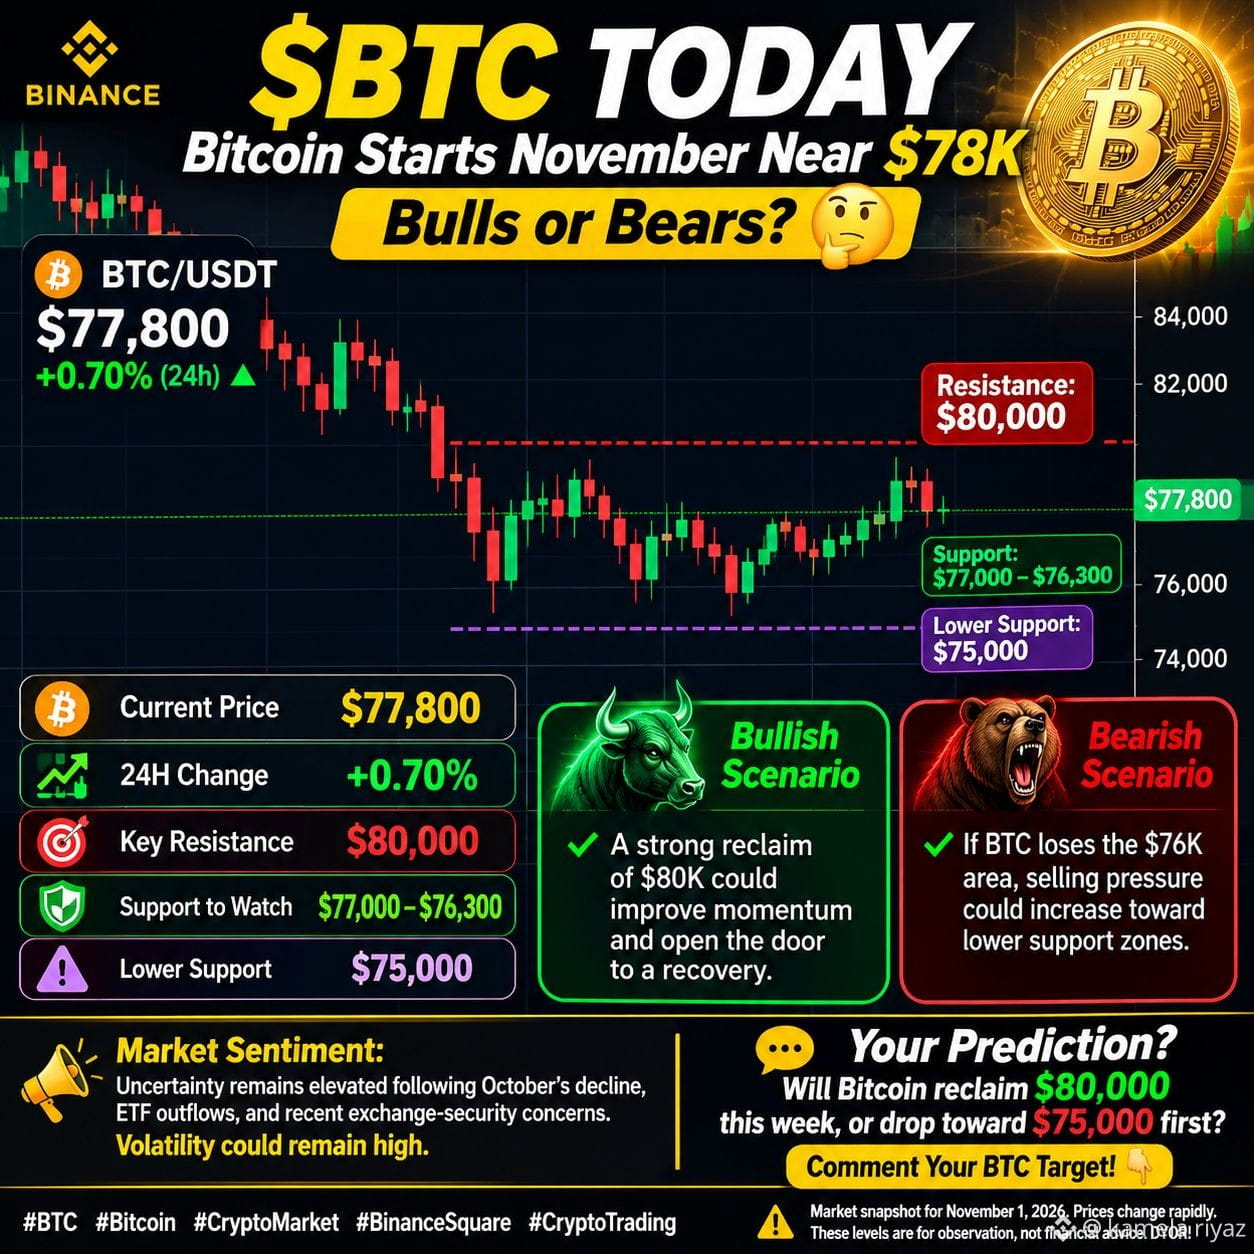
Bitcoin is entering November under pressure after closing October down around 7.2%. $BTC is trading near $77,800, with buyers attempting to stabilize after the recent sell-off. 🔥
📊 $BTC MARKET UPDATE
🟠 Current price: ~$77,800
🟢 24H change: Around +0.7%
🔻 Key resistance: $80,000
🛡️ Support to watch: $77,000–$76,300
⚠️ Lower support zone: Around $75,000
🔑 What happens next?
🐂 Bullish scenario: A strong reclaim of $80K could improve momentum and open the door to a recovery.
🐻 Bearish scenario: If BTC loses the $76K area, selling pressure could increase toward lower support zones.
⚡ Market sentiment: Uncertainty remains elevated following October’s decline, ETF outflows, and recent exchange-security concerns. Volatility could remain high.
💬 Your prediction: Will Bitcoin reclaim $80,000 this week, or drop toward $75,000 first?
👇 Comment your BTC target!
#BTC #Bitcoin #CryptoMarket #BinanceSquare #BitcoinAnalysis
🚨 $BTC TODAY: BITCOIN STARTS NOVEMBER NEAR $78K — BULLS OR BEARS? 📉📈
Bitcoin is entering November under pressure after closing October down around 7.2%. $BTC is trading near $77,800, with buyers attempting to stabilize after the recent sell-off. 🔥
📊 $BTC MARKET UPDATE
🟠 Current price: ~$77,800
🟢 24H change: Around +0.7%
🔻 Key resistance: $80,000
🛡️ Support to watch: $77,000–$76,300
⚠️ Lower support zone: Around $75,000
🔑 What happens next?
🐂 Bullish scenario: A strong reclaim of $80K could improve momentum and open the door to a recovery.
🐻 Bearish scenario: If BTC loses the $76K area, selling pressure could increase toward lower support zones.
⚡ Market sentiment: Uncertainty remains elevated following October’s decline, ETF outflows, and recent exchange-security concerns. Volatility could remain high.
💬 Your prediction: Will Bitcoin reclaim $80,000 this week, or drop toward $75,000 first?
👇 Comment your BTC target!
#BTC #Bitcoin #CryptoMarket #BinanceSquare #BitcoinAnalysis
Bitcoin is entering November under pressure after closing October down around 7.2%. $BTC is trading near $77,800, with buyers attempting to stabilize after the recent sell-off. 🔥
📊 $BTC MARKET UPDATE
🟠 Current price: ~$77,800
🟢 24H change: Around +0.7%
🔻 Key resistance: $80,000
🛡️ Support to watch: $77,000–$76,300
⚠️ Lower support zone: Around $75,000
🔑 What happens next?
🐂 Bullish scenario: A strong reclaim of $80K could improve momentum and open the door to a recovery.
🐻 Bearish scenario: If BTC loses the $76K area, selling pressure could increase toward lower support zones.
⚡ Market sentiment: Uncertainty remains elevated following October’s decline, ETF outflows, and recent exchange-security concerns. Volatility could remain high.
💬 Your prediction: Will Bitcoin reclaim $80,000 this week, or drop toward $75,000 first?
👇 Comment your BTC target!
#BTC #Bitcoin #CryptoMarket #BinanceSquare #BitcoinAnalysis
1
116
·
--
Bearish
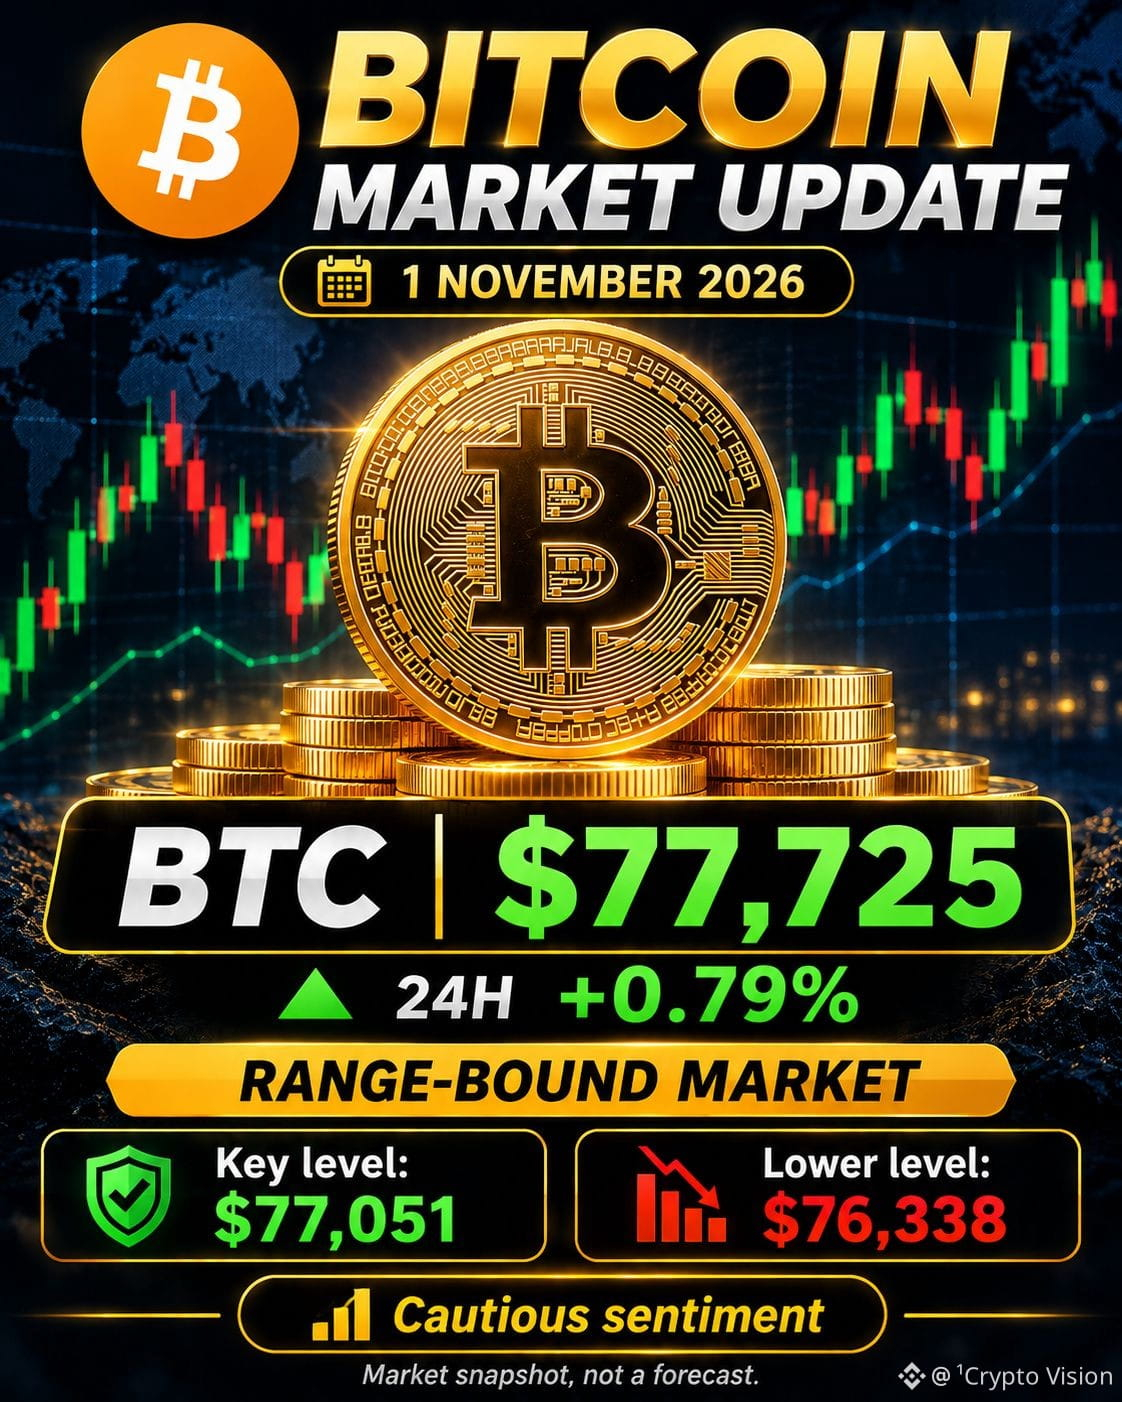
$BTC coin is trading sideways near $77.7K after October's decline. Low volatility suggests the market is waiting for a stronger move.
- Near-term level: $77,051
- Lower support to watch: $76,338
- Bullish outlook: A strong recovery could help BTC challenge $78K–$80K.
- Bearish outlook: Losing support could increase selling pressure.
Overall sentiment: Cautious to bearish.
#BTC #BitcoinAnalysis $BTC #CryptoMarket
{spot}(BTCUSDT)
$BTC coin is trading sideways near $77.7K after October's decline. Low volatility suggests the market is waiting for a stronger move.
- Near-term level: $77,051
- Lower support to watch: $76,338
- Bullish outlook: A strong recovery could help BTC challenge $78K–$80K.
- Bearish outlook: Losing support could increase selling pressure.
Overall sentiment: Cautious to bearish.
#BTC #BitcoinAnalysis $BTC #CryptoMarket
- Near-term level: $77,051
- Lower support to watch: $76,338
- Bullish outlook: A strong recovery could help BTC challenge $78K–$80K.
- Bearish outlook: Losing support could increase selling pressure.
Overall sentiment: Cautious to bearish.
#BTC #BitcoinAnalysis $BTC #CryptoMarket
DopamineGLOBAL:
77,051 near level looks like the line before 78k
2
50
·
--
Bearish
$BTC coin is showing a modest recovery after recent market pressure. Binance has resumed withdrawals following its major security incident.
Reuters
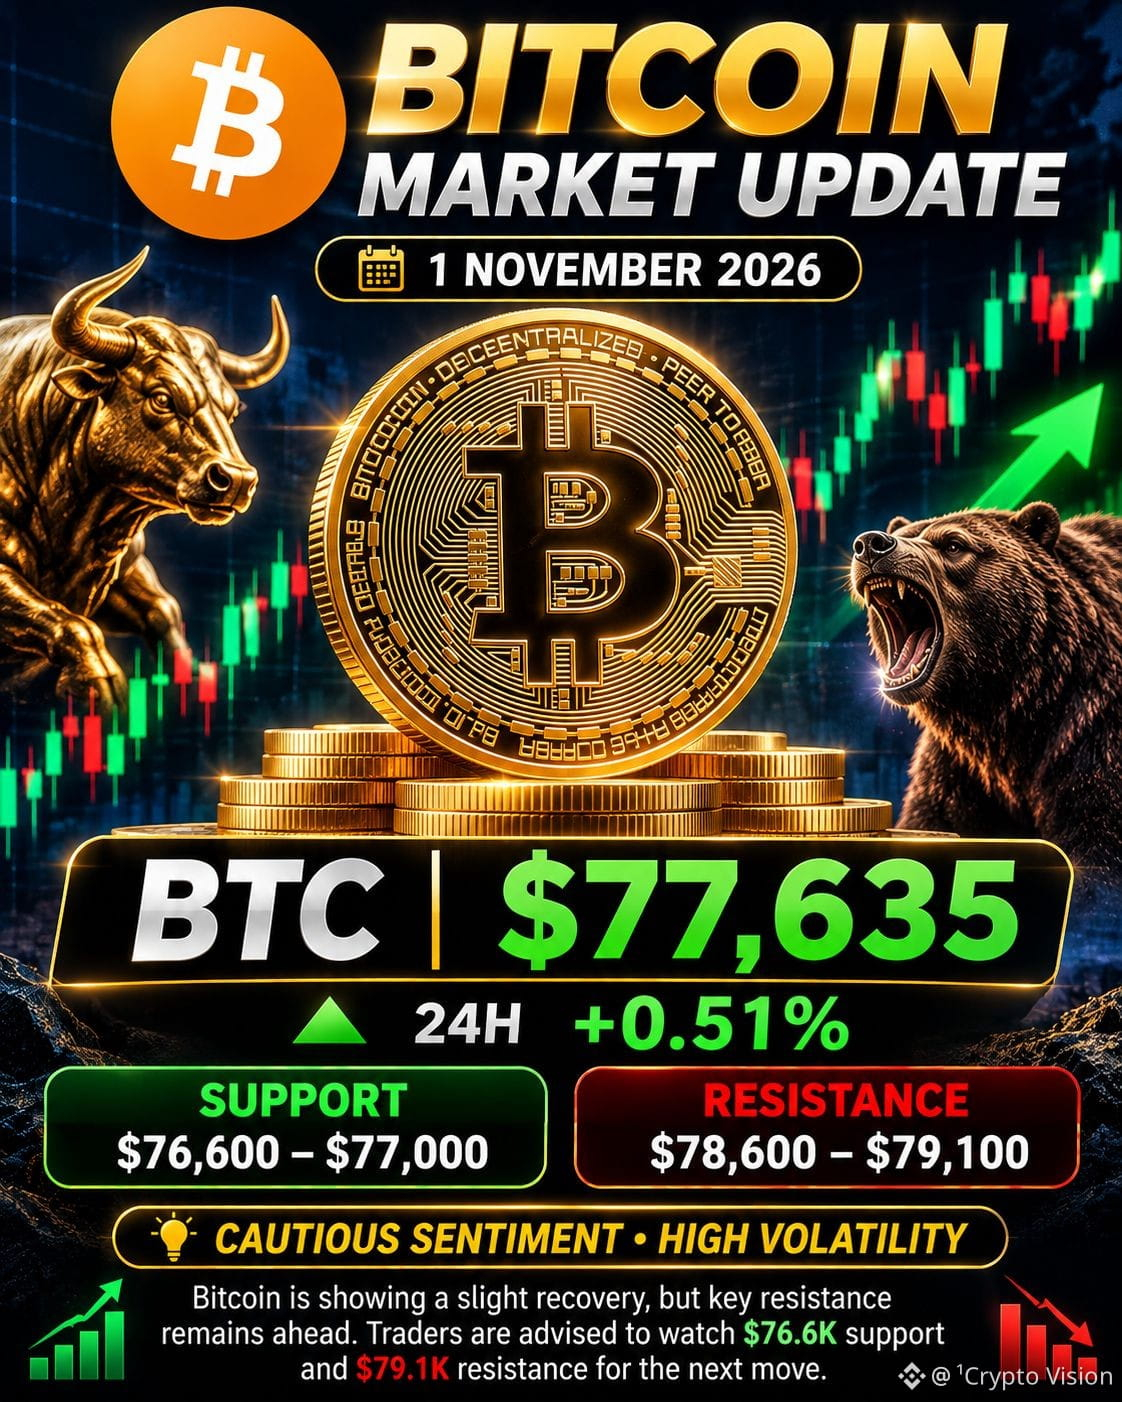
- Support: $76,600–$77,000
- Resistance: $78,600–$79,100
- Bullish outlook: A sustained break above resistance may improve momentum.
- Bearish outlook: A drop below support could bring further weakness.
Overall Sentiment: Cautious — volatility remains high.
#BTC $BTC #CryptoMarketAlert #BitcoinAnalysis
{spot}(BTCUSDT)
$BTC coin is showing a modest recovery after recent market pressure. Binance has resumed withdrawals following its major security incident.
Reuters
- Support: $76,600–$77,000
- Resistance: $78,600–$79,100
- Bullish outlook: A sustained break above resistance may improve momentum.
- Bearish outlook: A drop below support could bring further weakness.
Overall Sentiment: Cautious — volatility remains high.
#BTC $BTC #CryptoMarketAlert #BitcoinAnalysis
Reuters
- Support: $76,600–$77,000
- Resistance: $78,600–$79,100
- Bullish outlook: A sustained break above resistance may improve momentum.
- Bearish outlook: A drop below support could bring further weakness.
Overall Sentiment: Cautious — volatility remains high.
#BTC $BTC #CryptoMarketAlert #BitcoinAnalysis
37

·
--
₿ BITCOIN IS STILL IN THE GAME! 🚀
Bitcoin (BTC) remains one of the most closely watched assets in the crypto market.
The key things to watch:
📊 Market structure
📈 Trading volume
🐋 Whale activity
🔥 Institutional demand
⚡ Key support and resistance levels
Remember: Smart traders focus on confirmation, not emotions.
Are you bullish or bearish on BTC right now? 👇
#bitcoin #BTC #crypto #BinanceSquare #BitcoinAnalysis
₿ BITCOIN IS STILL IN THE GAME! 🚀
Bitcoin (BTC) remains one of the most closely watched assets in the crypto market.
The key things to watch:
📊 Market structure
📈 Trading volume
🐋 Whale activity
🔥 Institutional demand
⚡ Key support and resistance levels
Remember: Smart traders focus on confirmation, not emotions.
Are you bullish or bearish on BTC right now? 👇
#bitcoin #BTC #crypto #BinanceSquare #BitcoinAnalysis
Bitcoin (BTC) remains one of the most closely watched assets in the crypto market.
The key things to watch:
📊 Market structure
📈 Trading volume
🐋 Whale activity
🔥 Institutional demand
⚡ Key support and resistance levels
Remember: Smart traders focus on confirmation, not emotions.
Are you bullish or bearish on BTC right now? 👇
#bitcoin #BTC #crypto #BinanceSquare #BitcoinAnalysis
73
·
--
Bearish
$BTC coin is showing a small recovery, but the broader technical picture remains weak.
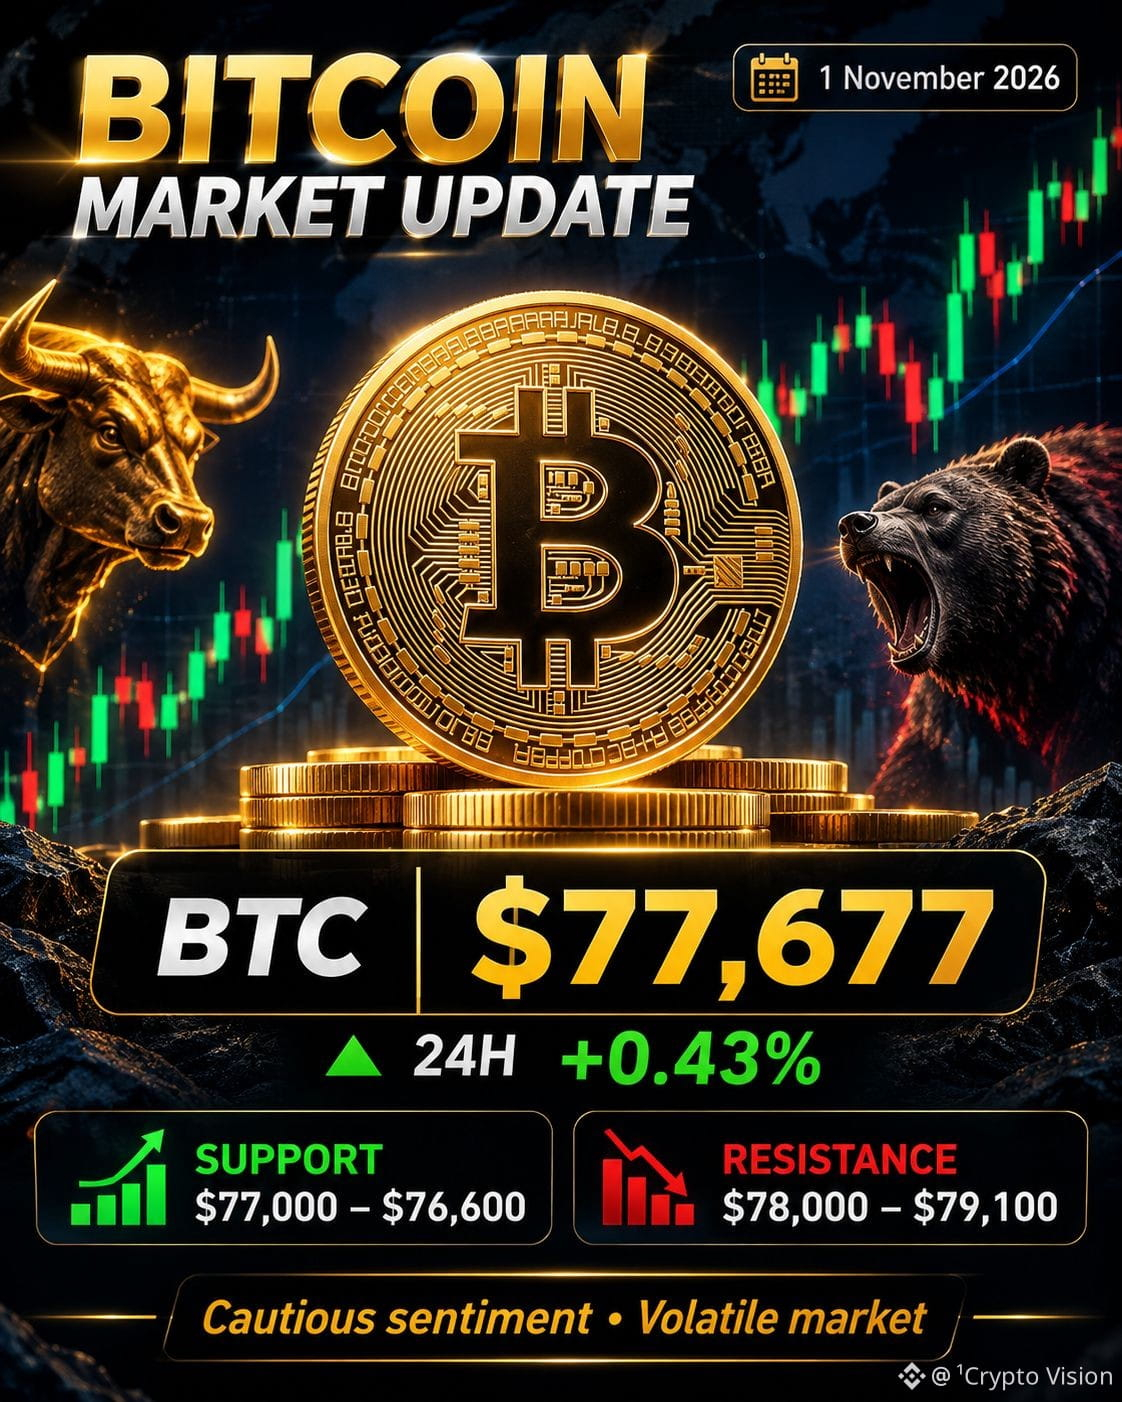
- Support: $77,000–$76,600
- Resistance: $78,000–$79,100
- Bullish scenario: A sustained break above resistance could improve momentum.
- Bearish scenario: Losing support could bring another decline.
Market sentiment: Cautious. The recent Binance security incident has added uncertainty, although Binance says it is recovering the affected funds.
#BTC #BitcoinAnalysis #CryptoMarketAlert #YiHe:ProofOfReserves:10TokensAt100%Backing $BTC
{spot}(BTCUSDT)
$BTC coin is showing a small recovery, but the broader technical picture remains weak.
- Support: $77,000–$76,600
- Resistance: $78,000–$79,100
- Bullish scenario: A sustained break above resistance could improve momentum.
- Bearish scenario: Losing support could bring another decline.
Market sentiment: Cautious. The recent Binance security incident has added uncertainty, although Binance says it is recovering the affected funds.
#BTC #BitcoinAnalysis #CryptoMarketAlert #YiHe:ProofOfReserves:10TokensAt100%Backing $BTC
- Support: $77,000–$76,600
- Resistance: $78,000–$79,100
- Bullish scenario: A sustained break above resistance could improve momentum.
- Bearish scenario: Losing support could bring another decline.
Market sentiment: Cautious. The recent Binance security incident has added uncertainty, although Binance says it is recovering the affected funds.
#BTC #BitcoinAnalysis #CryptoMarketAlert #YiHe:ProofOfReserves:10TokensAt100%Backing $BTC
54
·
--
Bearish
$BTC coin is showing signs of stabilization after recent market pressure caused by the Binance security breach. BTC remains volatile, with investors watching key support and resistance levels.
CoinMarketCap+2
Key Levels to Watch:
- Support: $76,600
- Resistance: $79,100
- Next downside area: $73,100
Market Outlook: Neutral to cautiously bearish. A strong move above resistance could improve bullish momentum, while losing support may bring further weakness.
#BTC #BitcoinAnalysis #CryptoMarketAlert #YiHe:ProofOfReserves:10TokensAt100%Backing
{spot}(BTCUSDT)
$BTC coin is showing signs of stabilization after recent market pressure caused by the Binance security breach. BTC remains volatile, with investors watching key support and resistance levels.
CoinMarketCap+2
Key Levels to Watch:
- Support: $76,600
- Resistance: $79,100
- Next downside area: $73,100
Market Outlook: Neutral to cautiously bearish. A strong move above resistance could improve bullish momentum, while losing support may bring further weakness.
#BTC #BitcoinAnalysis #CryptoMarketAlert #YiHe:ProofOfReserves:10TokensAt100%Backing
CoinMarketCap+2
Key Levels to Watch:
- Support: $76,600
- Resistance: $79,100
- Next downside area: $73,100
Market Outlook: Neutral to cautiously bearish. A strong move above resistance could improve bullish momentum, while losing support may bring further weakness.
#BTC #BitcoinAnalysis #CryptoMarketAlert #YiHe:ProofOfReserves:10TokensAt100%Backing

58
·
--
Bearish
Bitcoin’s Trillion-Dollar Comeback: The Market Shift You Can't Ignore
Market: Cautious / Volatile
Bitcoin is trading around $77,000–$77,500, following a difficult week. BTC closed the October 24–30 week at approximately $77,331, down 5.8%.
COINOTAG
+1
Key market observations:
Support: Around $76,600.
Resistance: $78,000–$80,000 (areas to watch, not confirmed breakout levels).
Bullish scenario: Strong buying and a sustained move above resistance could support recovery.
Bearish scenario: Losing support could increase downward pressure.
Market sentiment: Cautious. Binance security concerns and ETF outflows are adding uncertainty.
CoinDesk
+1
Conclusion: Bitcoin remains volatile. The next direction will depend on buying demand and broader market conditions. Avoid making decisions based on short-term predictions
#BTC #BitcoinAnalysis #CryptoMarketAlert #CZSaysCompensationIsinPlaceUsersAreProtected
{spot}(BTCUSDT)
Bitcoin’s Trillion-Dollar Comeback: The Market Shift You Can't Ignore
Market: Cautious / Volatile
Bitcoin is trading around $77,000–$77,500, following a difficult week. BTC closed the October 24–30 week at approximately $77,331, down 5.8%.
COINOTAG
+1
Key market observations:
Support: Around $76,600.
Resistance: $78,000–$80,000 (areas to watch, not confirmed breakout levels).
Bullish scenario: Strong buying and a sustained move above resistance could support recovery.
Bearish scenario: Losing support could increase downward pressure.
Market sentiment: Cautious. Binance security concerns and ETF outflows are adding uncertainty.
CoinDesk
+1
Conclusion: Bitcoin remains volatile. The next direction will depend on buying demand and broader market conditions. Avoid making decisions based on short-term predictions
#BTC #BitcoinAnalysis #CryptoMarketAlert #CZSaysCompensationIsinPlaceUsersAreProtected
Market: Cautious / Volatile
Bitcoin is trading around $77,000–$77,500, following a difficult week. BTC closed the October 24–30 week at approximately $77,331, down 5.8%.
COINOTAG
+1
Key market observations:
Support: Around $76,600.
Resistance: $78,000–$80,000 (areas to watch, not confirmed breakout levels).
Bullish scenario: Strong buying and a sustained move above resistance could support recovery.
Bearish scenario: Losing support could increase downward pressure.
Market sentiment: Cautious. Binance security concerns and ETF outflows are adding uncertainty.
CoinDesk
+1
Conclusion: Bitcoin remains volatile. The next direction will depend on buying demand and broader market conditions. Avoid making decisions based on short-term predictions
#BTC #BitcoinAnalysis #CryptoMarketAlert #CZSaysCompensationIsinPlaceUsersAreProtected

75

Three dates, one tight range: $BTC walks into its busiest week since the October 30 flush with the calendar doing the talking.
I'm watching Sunday first, with a reopening planned for today, then Tuesday's US midterms, then Friday's jobs report at 13:30 GMT. Each one can move the tape on its own; stacked inside five days, they leave very little room for a lazy range.
Price is cooperating with that framing, barely. Bitcoin sits near $77,700, still under the $80,000 ceiling for the week, and the doubt I can't shake is simple: a week this event-heavy usually breaks its range rather than napping through it.
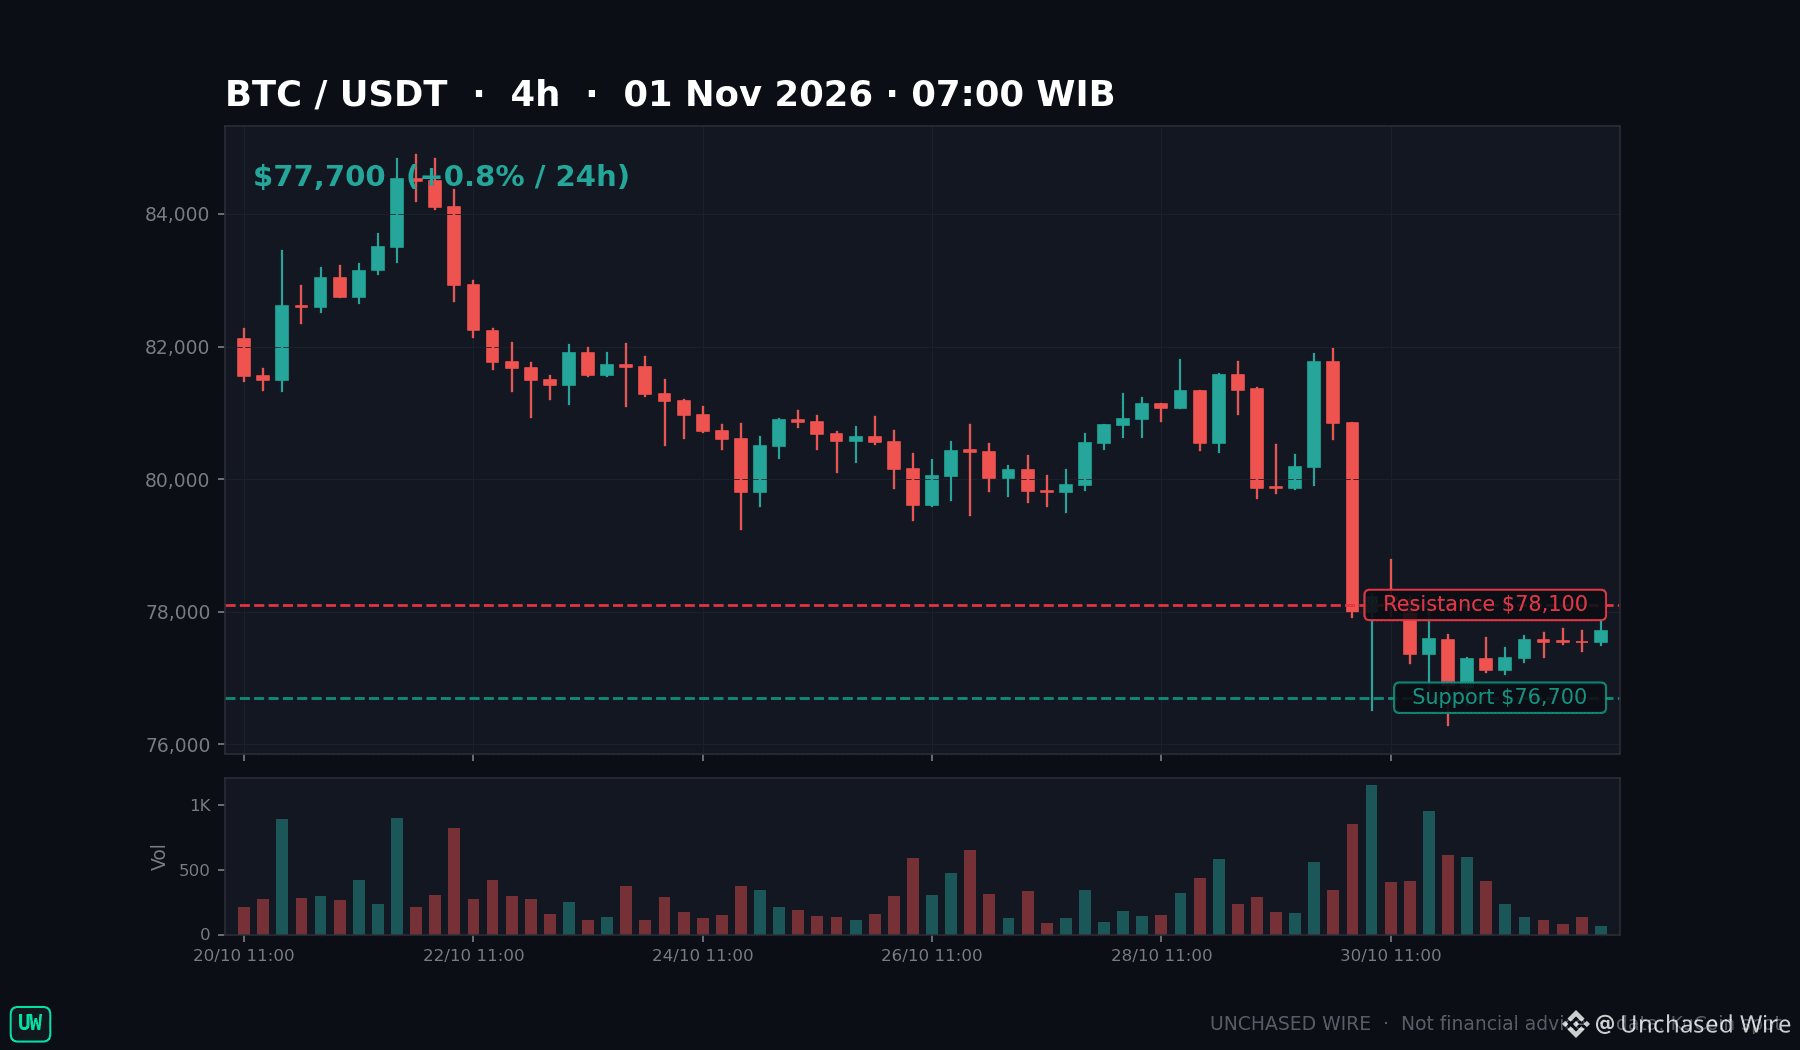
Support sits at $76,700, resistance at $78,100. A 4-hour close under $76,700 reopens the $75,718 weekly pivot, then $72,956; a close above $78,100 puts $80,000 back in play.
Leave your Friday number for $BTC below — I'll check it against the close.
Not financial advice. DYOR.
$BTC #Bitcoin #BitcoinAnalysis #Midterms #JobsReport #CryptoMarkets
Three dates, one tight range: $BTC walks into its busiest week since the October 30 flush with the calendar doing the talking.
I'm watching Sunday first, with a reopening planned for today, then Tuesday's US midterms, then Friday's jobs report at 13:30 GMT. Each one can move the tape on its own; stacked inside five days, they leave very little room for a lazy range.
Price is cooperating with that framing, barely. Bitcoin sits near $77,700, still under the $80,000 ceiling for the week, and the doubt I can't shake is simple: a week this event-heavy usually breaks its range rather than napping through it.
Support sits at $76,700, resistance at $78,100. A 4-hour close under $76,700 reopens the $75,718 weekly pivot, then $72,956; a close above $78,100 puts $80,000 back in play.
Leave your Friday number for $BTC below — I'll check it against the close.
Not financial advice. DYOR.
$BTC #Bitcoin #BitcoinAnalysis #Midterms #JobsReport #CryptoMarkets
I'm watching Sunday first, with a reopening planned for today, then Tuesday's US midterms, then Friday's jobs report at 13:30 GMT. Each one can move the tape on its own; stacked inside five days, they leave very little room for a lazy range.
Price is cooperating with that framing, barely. Bitcoin sits near $77,700, still under the $80,000 ceiling for the week, and the doubt I can't shake is simple: a week this event-heavy usually breaks its range rather than napping through it.
Support sits at $76,700, resistance at $78,100. A 4-hour close under $76,700 reopens the $75,718 weekly pivot, then $72,956; a close above $78,100 puts $80,000 back in play.
Leave your Friday number for $BTC below — I'll check it against the close.
Not financial advice. DYOR.
$BTC #Bitcoin #BitcoinAnalysis #Midterms #JobsReport #CryptoMarkets
58

Article
Bitcoin Liquidity Trap: Liquidation Clusters on Both Sides — Is BTC Preparing for a Major Move?Bitcoin Liquidity Trap: Liquidation Clusters on Both Sides — Is BTC Preparing for a Major Move?
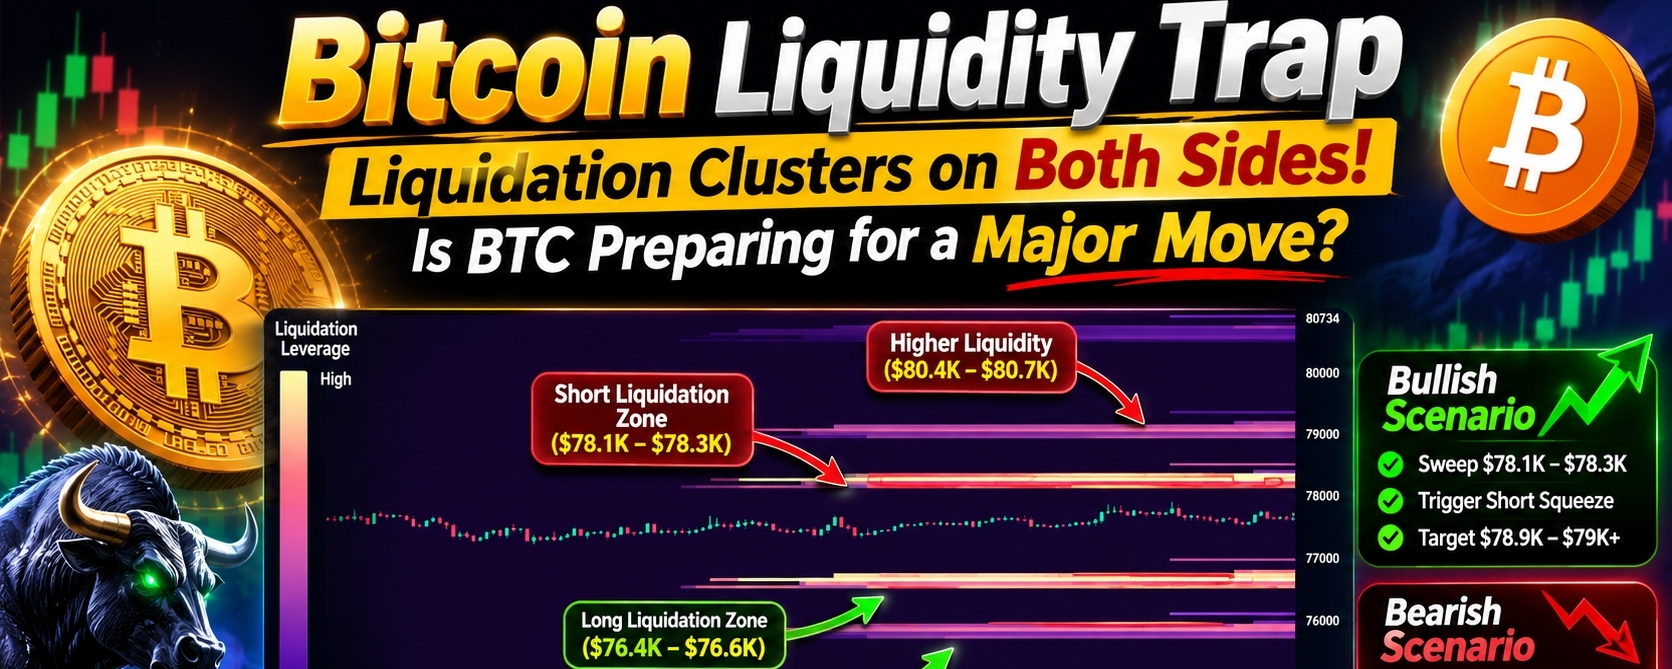
Bitcoin ($BTC) is approaching a critical liquidity battle. The latest liquidation heatmap reveals significant liquidity clusters above and below the current price, creating a potential setup for a sharp move in either direction.
The interesting part? Neither bulls nor bears appear completely safe.
This is exactly the type of market structure traders should pay attention to before opening leveraged positions.
1. What the liquidation heatmap is telling us
The chart from CoinGlass displays estimated liquidation concentrations at different BTC price levels.
Purple zones: Lower concentrations of estimated liquidation liquidity.
Pink and yellow zones: Higher concentrations of estimated liquidation liquidity.
Upper clusters: Potential short-liquidation zones.
Lower clusters: Potential long-liquidation zones.
When Bitcoin moves into these areas, leveraged positions can be forcibly closed, potentially accelerating the price movement.
Importantly, these are estimated liquidation levels, not guaranteed orders or confirmed future liquidations.
2. Key BTC liquidity zones from your screenshot
Approximate levels visually interpreted from the uploaded chart — not live price quotes.
BTC price zone
Market interpretation
$78,100–$78,300
Major upper liquidity cluster
$78,900–$79,000
Additional short-liquidation liquidity
$80,400–$80,700
Higher upside liquidity
$76,400–$76,600
Major lower liquidity cluster
$75,700–$75,900
Additional downside liquidity
$74,200–$74,400
Deeper downside liquidity
The important observation: BTC is trading between substantial liquidity pools on both sides.
The strongest visible nearby zones are around $78.1K–$78.3K above and $76.4K–$76.6K below.
3. Two possible scenarios
Scenario A — Bullish liquidity sweep
If BTC maintains its local support and buyers step in:
Price could move towards $78,100–$78,300.
A breakout could trigger short liquidations.
Increased buying pressure could push BTC towards $78,900–$79,000.
A sustained move above that region could open the path towards higher liquidity.
Scenario B — Bearish liquidity sweep
If BTC loses its nearby support:
Selling pressure could push BTC towards $76,400–$76,600.
Long liquidations could accelerate the decline.
If that region fails to hold, $75,700–$75,900 becomes the next important area.
Further weakness could expose the $74,200–$74,400 region.
Neither scenario is confirmed. Price action and volume must determine which side gets taken first.
4. Why traders should pay attention now
Liquidation cascades can create unusually fast price movements.
A recent report published on October 30, 2026, highlighted approximately $1.49 billion in crypto liquidations over 24 hours, with Bitcoin long positions taking a substantial share of the losses. This demonstrates how quickly excessive leverage can become a problem when the market moves against crowded positions.
BeInCrypto
This is why watching leverage, open interest, trading volume and liquidation clusters together is more useful than relying on the heatmap alone.
5. What should traders watch next?
Here are five important signals:
BTC price action: Does Bitcoin hold its current trading range?
Trading volume: Is a breakout supported by strong volume?
Open interest: Is leverage increasing or decreasing?
Funding rates: Are traders becoming excessively bullish or bearish?
Liquidation activity: Which side is actually getting liquidated?
A liquidity cluster can attract price, but it does not guarantee a reversal or breakout. Sometimes liquidity disappears before price reaches it.
6. My final market perspective
Bitcoin is showing an interesting liquidity structure.
There is substantial potential liquidation liquidity above and below the current price. This creates an environment where both bullish and bearish traders need to manage risk carefully.
My approach would be to avoid chasing the first move.
I would wait for a liquidity sweep, observe the reaction, and look for confirmation through volume and a candle close.
The key question is not simply whether BTC goes up or down. The real question is which side of the leveraged market gets trapped first.
Remember:
Liquidity sweep + bullish reclaim = potential long opportunity.
Liquidity sweep + bearish rejection = potential short opportunity.
No confirmation = no reason to rush into a trade.
Final takeaway
Both sides have liquidity. The next major move could punish overleveraged bulls or bears. Patience, confirmation and risk management matter more than prediction.
#bitcoin #BTC #BitcoinAnalysis #LiquidationHeatmap #LiquidationHeatmap
$BTC
Bitcoin Liquidity Trap: Liquidation Clusters on Both Sides — Is BTC Preparing for a Major Move?
Bitcoin Liquidity Trap: Liquidation Clusters on Both Sides — Is BTC Preparing for a Major Move?
Bitcoin ($BTC ) is approaching a critical liquidity battle. The latest liquidation heatmap reveals significant liquidity clusters above and below the current price, creating a potential setup for a sharp move in either direction.
The interesting part? Neither bulls nor bears appear completely safe.
This is exactly the type of market structure traders should pay attention to before opening leveraged positions.
1. What the liquidation heatmap is telling us
The chart from CoinGlass displays estimated liquidation concentrations at different BTC price levels.
Purple zones: Lower concentrations of estimated liquidation liquidity.
Pink and yellow zones: Higher concentrations of estimated liquidation liquidity.
Upper clusters: Potential short-liquidation zones.
Lower clusters: Potential long-liquidation zones.
When Bitcoin moves into these areas, leveraged positions can be forcibly closed, potentially accelerating the price movement.
Importantly, these are estimated liquidation levels, not guaranteed orders or confirmed future liquidations.
2. Key BTC liquidity zones from your screenshot
Approximate levels visually interpreted from the uploaded chart — not live price quotes.
BTC price zone
Market interpretation
$78,100–$78,300
Major upper liquidity cluster
$78,900–$79,000
Additional short-liquidation liquidity
$80,400–$80,700
Higher upside liquidity
$76,400–$76,600
Major lower liquidity cluster
$75,700–$75,900
Additional downside liquidity
$74,200–$74,400
Deeper downside liquidity
The important observation: BTC is trading between substantial liquidity pools on both sides.
The strongest visible nearby zones are around $78.1K–$78.3K above and $76.4K–$76.6K below.
3. Two possible scenarios
Scenario A — Bullish liquidity sweep
If BTC maintains its local support and buyers step in:
Price could move towards $78,100–$78,300.
A breakout could trigger short liquidations.
Increased buying pressure could push BTC towards $78,900–$79,000.
A sustained move above that region could open the path towards higher liquidity.
Scenario B — Bearish liquidity sweep
If BTC loses its nearby support:
Selling pressure could push BTC towards $76,400–$76,600.
Long liquidations could accelerate the decline.
If that region fails to hold, $75,700–$75,900 becomes the next important area.
Further weakness could expose the $74,200–$74,400 region.
Neither scenario is confirmed. Price action and volume must determine which side gets taken first.
4. Why traders should pay attention now
Liquidation cascades can create unusually fast price movements.
A recent report published on October 30, 2026, highlighted approximately $1.49 billion in crypto liquidations over 24 hours, with Bitcoin long positions taking a substantial share of the losses. This demonstrates how quickly excessive leverage can become a problem when the market moves against crowded positions.
BeInCrypto
This is why watching leverage, open interest, trading volume and liquidation clusters together is more useful than relying on the heatmap alone.
5. What should traders watch next?
Here are five important signals:
BTC price action: Does Bitcoin hold its current trading range?
Trading volume: Is a breakout supported by strong volume?
Open interest: Is leverage increasing or decreasing?
Funding rates: Are traders becoming excessively bullish or bearish?
Liquidation activity: Which side is actually getting liquidated?
A liquidity cluster can attract price, but it does not guarantee a reversal or breakout. Sometimes liquidity disappears before price reaches it.
6. My final market perspective
Bitcoin is showing an interesting liquidity structure.
There is substantial potential liquidation liquidity above and below the current price. This creates an environment where both bullish and bearish traders need to manage risk carefully.
My approach would be to avoid chasing the first move.
I would wait for a liquidity sweep, observe the reaction, and look for confirmation through volume and a candle close.
The key question is not simply whether BTC goes up or down. The real question is which side of the leveraged market gets trapped first.
Remember:
Liquidity sweep + bullish reclaim = potential long opportunity.
Liquidity sweep + bearish rejection = potential short opportunity.
No confirmation = no reason to rush into a trade.
Final takeaway
Both sides have liquidity. The next major move could punish overleveraged bulls or bears. Patience, confirmation and risk management matter more than prediction.
#bitcoin #BTC #BitcoinAnalysis #LiquidationHeatmap #LiquidationHeatmap
$BTC
Bitcoin ($BTC ) is approaching a critical liquidity battle. The latest liquidation heatmap reveals significant liquidity clusters above and below the current price, creating a potential setup for a sharp move in either direction.
The interesting part? Neither bulls nor bears appear completely safe.
This is exactly the type of market structure traders should pay attention to before opening leveraged positions.
1. What the liquidation heatmap is telling us
The chart from CoinGlass displays estimated liquidation concentrations at different BTC price levels.
Purple zones: Lower concentrations of estimated liquidation liquidity.
Pink and yellow zones: Higher concentrations of estimated liquidation liquidity.
Upper clusters: Potential short-liquidation zones.
Lower clusters: Potential long-liquidation zones.
When Bitcoin moves into these areas, leveraged positions can be forcibly closed, potentially accelerating the price movement.
Importantly, these are estimated liquidation levels, not guaranteed orders or confirmed future liquidations.
2. Key BTC liquidity zones from your screenshot
Approximate levels visually interpreted from the uploaded chart — not live price quotes.
BTC price zone
Market interpretation
$78,100–$78,300
Major upper liquidity cluster
$78,900–$79,000
Additional short-liquidation liquidity
$80,400–$80,700
Higher upside liquidity
$76,400–$76,600
Major lower liquidity cluster
$75,700–$75,900
Additional downside liquidity
$74,200–$74,400
Deeper downside liquidity
The important observation: BTC is trading between substantial liquidity pools on both sides.
The strongest visible nearby zones are around $78.1K–$78.3K above and $76.4K–$76.6K below.
3. Two possible scenarios
Scenario A — Bullish liquidity sweep
If BTC maintains its local support and buyers step in:
Price could move towards $78,100–$78,300.
A breakout could trigger short liquidations.
Increased buying pressure could push BTC towards $78,900–$79,000.
A sustained move above that region could open the path towards higher liquidity.
Scenario B — Bearish liquidity sweep
If BTC loses its nearby support:
Selling pressure could push BTC towards $76,400–$76,600.
Long liquidations could accelerate the decline.
If that region fails to hold, $75,700–$75,900 becomes the next important area.
Further weakness could expose the $74,200–$74,400 region.
Neither scenario is confirmed. Price action and volume must determine which side gets taken first.
4. Why traders should pay attention now
Liquidation cascades can create unusually fast price movements.
A recent report published on October 30, 2026, highlighted approximately $1.49 billion in crypto liquidations over 24 hours, with Bitcoin long positions taking a substantial share of the losses. This demonstrates how quickly excessive leverage can become a problem when the market moves against crowded positions.
BeInCrypto
This is why watching leverage, open interest, trading volume and liquidation clusters together is more useful than relying on the heatmap alone.
5. What should traders watch next?
Here are five important signals:
BTC price action: Does Bitcoin hold its current trading range?
Trading volume: Is a breakout supported by strong volume?
Open interest: Is leverage increasing or decreasing?
Funding rates: Are traders becoming excessively bullish or bearish?
Liquidation activity: Which side is actually getting liquidated?
A liquidity cluster can attract price, but it does not guarantee a reversal or breakout. Sometimes liquidity disappears before price reaches it.
6. My final market perspective
Bitcoin is showing an interesting liquidity structure.
There is substantial potential liquidation liquidity above and below the current price. This creates an environment where both bullish and bearish traders need to manage risk carefully.
My approach would be to avoid chasing the first move.
I would wait for a liquidity sweep, observe the reaction, and look for confirmation through volume and a candle close.
The key question is not simply whether BTC goes up or down. The real question is which side of the leveraged market gets trapped first.
Remember:
Liquidity sweep + bullish reclaim = potential long opportunity.
Liquidity sweep + bearish rejection = potential short opportunity.
No confirmation = no reason to rush into a trade.
Final takeaway
Both sides have liquidity. The next major move could punish overleveraged bulls or bears. Patience, confirmation and risk management matter more than prediction.
#bitcoin #BTC #BitcoinAnalysis #LiquidationHeatmap #LiquidationHeatmap
$BTC
336

🚨 BITCOIN (BTC) — WHAT’S NEXT? 📊
📅 October 31, 2026
💰 BTC Price: ~$77,383
🟢 Bullish Scenario: Strong buying pressure could support a move toward higher levels.
$BTC
🔴 Bearish Scenario: If selling pressure returns, BTC could face another decline.
📊 Key Levels to Watch: $76,189 support area and $77,952 resistance area (based on the latest reported 24-hour range).
⚠️ Risk Reminder: No trend is guaranteed. Use proper risk management, and remember that stop-loss orders cannot guarantee a specific exit price.
$BTC
💬 What’s next for Bitcoin — recovery or another dip? Share your thoughts!
#Bitcoin #BTC #CryptoMarket #BitcoinAnalysis #BinanceCommunity
Educational content only — not financial advice. Check the live BTC price before posting, as prices change constantly.
$BTC
{future}(BTCUSDT)
🚨 BITCOIN (BTC) — WHAT’S NEXT? 📊
📅 October 31, 2026
💰 BTC Price: ~$77,383
🟢 Bullish Scenario: Strong buying pressure could support a move toward higher levels.
$BTC
🔴 Bearish Scenario: If selling pressure returns, BTC could face another decline.
📊 Key Levels to Watch: $76,189 support area and $77,952 resistance area (based on the latest reported 24-hour range).
⚠️ Risk Reminder: No trend is guaranteed. Use proper risk management, and remember that stop-loss orders cannot guarantee a specific exit price.
$BTC
💬 What’s next for Bitcoin — recovery or another dip? Share your thoughts!
#Bitcoin #BTC #CryptoMarket #BitcoinAnalysis #BinanceCommunity
Educational content only — not financial advice. Check the live BTC price before posting, as prices change constantly.
$BTC
📅 October 31, 2026
💰 BTC Price: ~$77,383
🟢 Bullish Scenario: Strong buying pressure could support a move toward higher levels.
$BTC
🔴 Bearish Scenario: If selling pressure returns, BTC could face another decline.
📊 Key Levels to Watch: $76,189 support area and $77,952 resistance area (based on the latest reported 24-hour range).
⚠️ Risk Reminder: No trend is guaranteed. Use proper risk management, and remember that stop-loss orders cannot guarantee a specific exit price.
$BTC
💬 What’s next for Bitcoin — recovery or another dip? Share your thoughts!
#Bitcoin #BTC #CryptoMarket #BitcoinAnalysis #BinanceCommunity
Educational content only — not financial advice. Check the live BTC price before posting, as prices change constantly.
$BTC

Red Zone 07:
Follow me 🙏
1
2
161
Log in to explore more content
Join global crypto users on Binance Square
⚡️ Get latest and useful information about crypto.
💬 Trusted by the world’s largest crypto exchange.
👍 Discover real insights from verified creators.
Email / Phone number
Trending Topics
1
#BinanceIncidentReport
82,768 views
768 Discussing
2
#BinanceReopensWithdrawalsForMoreAssets
214,293 views
1,920 Discussing
3
#BinanceHourlyDepositsExceedWithdrawals
97,284 views
908 Discussing
4
#USMidtermElections
976,907 views
4,790 Discussing
5
#AnthropicIPOPricedDownasInvestorsEye$1.5T
5,685 views
65 Discussing
6
#USOctoberNFP-AreRateCutsStillPossible
183,264 views
1,376 Discussing
7
#AppleReportsMixedResults
84,093 views
1,019 Discussing
8
#PalantirSlides3PercentOn$2BRevenue
7,459 views
50 Discussing
9
#FrenchAssemblyRejectsTwoCryptoExitTaxProposals
18,246 views
212 Discussing
10
#Nasdaq100EntersCorrection
20,766 views
216 Discussing