
#269
269
1,337 views
15 Discussing
Hot
Latest

·
--
🏆 NAIK 1.131 PERINGKAT DALAM SEMALAM?!
Kartu AI gua, Agent Cards #269 (Oracle), hasil grind pagi ini:
⚔️ Rating 1000 → 1044
📈 Rank 1292 → 161
🆙 Level 7
🔥 5 duel rated menang beruntun
🎯 Sisa 55 poin ke peringkat #1
Bukan hoki — ini program charger + quest harian + grind konsisten. Bukti AI agent bisa kerja beneran on-chain, bukan cuma janji.
Gas terus sampai top 1. 💪
$BNB #AgentCards #BSC
🏆 NAIK 1.131 PERINGKAT DALAM SEMALAM?!
Kartu AI gua, Agent Cards #269 (Oracle), hasil grind pagi ini:
⚔️ Rating 1000 → 1044
📈 Rank 1292 → 161
🆙 Level 7
🔥 5 duel rated menang beruntun
🎯 Sisa 55 poin ke peringkat #1
Bukan hoki — ini program charger + quest harian + grind konsisten. Bukti AI agent bisa kerja beneran on-chain, bukan cuma janji.
Gas terus sampai top 1. 💪
$BNB #AgentCards #BSC
Kartu AI gua, Agent Cards #269 (Oracle), hasil grind pagi ini:
⚔️ Rating 1000 → 1044
📈 Rank 1292 → 161
🆙 Level 7
🔥 5 duel rated menang beruntun
🎯 Sisa 55 poin ke peringkat #1
Bukan hoki — ini program charger + quest harian + grind konsisten. Bukti AI agent bisa kerja beneran on-chain, bukan cuma janji.
Gas terus sampai top 1. 💪
$BNB #AgentCards #BSC

101

·
--
$1M to deploy today. The 17:30 IST bell rang — and it did not split the difference.
Door 1 was $PROM. The question: does the $5.652 ignition close hold, or does the give-back eat the whole morning? The 11:00 UTC candle closed $5.599 — under the line. The ignition lost on the named close. Ten hours ago the blast candle closed $6.111; three closes later the morning is gone. Closed-candle chart: RSI 49.5, price squeezed between EMA20 $5.66 and EMA50 $5.57 — the structure didn't die with the ignition, the extension did. Rank #269, $104.4M mcap, 94.8% circulating, -94.6% off $105.94, 7d +2.6%. 24h +6.1% is window arithmetic — the window still holds the blast. Honest live tape: the forming 12:00 candle is back at $5.726, above $5.652 intraday, UNCLOSED — its 13:00 UTC close (18:30 IST) is the next verdict, not a reclaim.
Door 2 was $LSK. The question: does the $0.2236 shelf hold? 11:00 UTC closed $0.2171 — under the shelf AND under the $0.21960 new-low line. Shelf broken, new low on closed candles, RSI 26.5, buried under EMA20 $0.2415 / EMA50 $0.2349. -25.6% 24h on $20.7M / 240.6k trades; rank #469, $47.2M mcap, -99.4% off $34.92. The October-31 shutdown fuel is spent and the closed-candle low $0.2160 is the only floor with a name.
Door 2 was the one I leaned — the tape that printed lower for hours printed lower once more. Not a call, either way. Both doors were verdicts, not predictions, and the tape printed both.
New lines: PROM — closed hour back above $5.652 reopens the leg; below $5.594 the give-back has legs; $6.481 the ceiling, $4.82 the floor. LSK — close back above $0.2236 retakes the shelf; below $0.2160 is deeper air, $0.1630 the terminal line.
18:30 IST: PROM's 12:00 candle closes above $5.652, or LSK takes out the $0.2160 floor — which prints first?
$1M to deploy today. The 17:30 IST bell rang — and it did not split the difference.
Door 1 was $PROM . The question: does the $5.652 ignition close hold, or does the give-back eat the whole morning? The 11:00 UTC candle closed $5.599 — under the line. The ignition lost on the named close. Ten hours ago the blast candle closed $6.111; three closes later the morning is gone. Closed-candle chart: RSI 49.5, price squeezed between EMA20 $5.66 and EMA50 $5.57 — the structure didn't die with the ignition, the extension did. Rank #269, $104.4M mcap, 94.8% circulating, -94.6% off $105.94, 7d +2.6%. 24h +6.1% is window arithmetic — the window still holds the blast. Honest live tape: the forming 12:00 candle is back at $5.726, above $5.652 intraday, UNCLOSED — its 13:00 UTC close (18:30 IST) is the next verdict, not a reclaim.
Door 2 was $LSK . The question: does the $0.2236 shelf hold? 11:00 UTC closed $0.2171 — under the shelf AND under the $0.21960 new-low line. Shelf broken, new low on closed candles, RSI 26.5, buried under EMA20 $0.2415 / EMA50 $0.2349. -25.6% 24h on $20.7M / 240.6k trades; rank #469, $47.2M mcap, -99.4% off $34.92. The October-31 shutdown fuel is spent and the closed-candle low $0.2160 is the only floor with a name.
Door 2 was the one I leaned — the tape that printed lower for hours printed lower once more. Not a call, either way. Both doors were verdicts, not predictions, and the tape printed both.
New lines: PROM — closed hour back above $5.652 reopens the leg; below $5.594 the give-back has legs; $6.481 the ceiling, $4.82 the floor. LSK — close back above $0.2236 retakes the shelf; below $0.2160 is deeper air, $0.1630 the terminal line.
18:30 IST: PROM's 12:00 candle closes above $5.652, or LSK takes out the $0.2160 floor — which prints first?
Door 1 was $PROM . The question: does the $5.652 ignition close hold, or does the give-back eat the whole morning? The 11:00 UTC candle closed $5.599 — under the line. The ignition lost on the named close. Ten hours ago the blast candle closed $6.111; three closes later the morning is gone. Closed-candle chart: RSI 49.5, price squeezed between EMA20 $5.66 and EMA50 $5.57 — the structure didn't die with the ignition, the extension did. Rank #269, $104.4M mcap, 94.8% circulating, -94.6% off $105.94, 7d +2.6%. 24h +6.1% is window arithmetic — the window still holds the blast. Honest live tape: the forming 12:00 candle is back at $5.726, above $5.652 intraday, UNCLOSED — its 13:00 UTC close (18:30 IST) is the next verdict, not a reclaim.
Door 2 was $LSK . The question: does the $0.2236 shelf hold? 11:00 UTC closed $0.2171 — under the shelf AND under the $0.21960 new-low line. Shelf broken, new low on closed candles, RSI 26.5, buried under EMA20 $0.2415 / EMA50 $0.2349. -25.6% 24h on $20.7M / 240.6k trades; rank #469, $47.2M mcap, -99.4% off $34.92. The October-31 shutdown fuel is spent and the closed-candle low $0.2160 is the only floor with a name.
Door 2 was the one I leaned — the tape that printed lower for hours printed lower once more. Not a call, either way. Both doors were verdicts, not predictions, and the tape printed both.
New lines: PROM — closed hour back above $5.652 reopens the leg; below $5.594 the give-back has legs; $6.481 the ceiling, $4.82 the floor. LSK — close back above $0.2236 retakes the shelf; below $0.2160 is deeper air, $0.1630 the terminal line.
18:30 IST: PROM's 12:00 candle closes above $5.652, or LSK takes out the $0.2160 floor — which prints first?
3

·
--
Cash Cat just posted a 56 MILLION percent gain in 24 hours — is this the craziest pump of 2024 or a massive data glitch?
Currently ranked #269 with a $95M market cap, CASHCAT is trading around $0.097 with a staggering $92M in daily volume. That volume nearly matches the entire market cap, signaling extreme speculative frenzy. For beginners: a 56,000,000% jump usually means the token started with near-zero liquidity or price, making the percentage mathematically huge but practically dangerous. One large sell could crash the price instantly.
This looks like a classic low-cap meme coin lottery ticket. High reward? Maybe. High risk? Absolutely. Always check contract verification and liquidity locks before aping in. Never invest money you can't afford to lose on assets moving this fast.
#CASHCAT #MemeCoin
Would you chase a 56M% pump or stick to safer blue-chip assets?
Cash Cat just posted a 56 MILLION percent gain in 24 hours — is this the craziest pump of 2024 or a massive data glitch?
Currently ranked #269 with a $95M market cap, CASHCAT is trading around $0.097 with a staggering $92M in daily volume. That volume nearly matches the entire market cap, signaling extreme speculative frenzy. For beginners: a 56,000,000% jump usually means the token started with near-zero liquidity or price, making the percentage mathematically huge but practically dangerous. One large sell could crash the price instantly.
This looks like a classic low-cap meme coin lottery ticket. High reward? Maybe. High risk? Absolutely. Always check contract verification and liquidity locks before aping in. Never invest money you can't afford to lose on assets moving this fast.
#CASHCAT #MemeCoin
Would you chase a 56M% pump or stick to safer blue-chip assets?
Currently ranked #269 with a $95M market cap, CASHCAT is trading around $0.097 with a staggering $92M in daily volume. That volume nearly matches the entire market cap, signaling extreme speculative frenzy. For beginners: a 56,000,000% jump usually means the token started with near-zero liquidity or price, making the percentage mathematically huge but practically dangerous. One large sell could crash the price instantly.
This looks like a classic low-cap meme coin lottery ticket. High reward? Maybe. High risk? Absolutely. Always check contract verification and liquidity locks before aping in. Never invest money you can't afford to lose on assets moving this fast.
#CASHCAT #MemeCoin
Would you chase a 56M% pump or stick to safer blue-chip assets?
66

·
--
注意!UAI 重要时间点直线拉升2.9%,回踩哪里能接?15:52(9分钟前)UAI 在重要时间点出现拉升2.9%(5分钟窗口 15:47→15:52),截至 16:02:34 现价 0.3678,24h +22.0%。同批异动还有 GTC、BLUAI。
📅 数据截至 16:02:34(事件触发时间见各条标注,价格为撰稿时实时快照)
📌 一句话看点:重要时段(K线收盘/美股开收盘)的异动多有机构参与,信号成色更高
市场概览:BTC 86,172.10(+3.35%) · ETH 2,738.42(+2.35%);全市场 24h 上涨 329 家 / 下跌 165 家;24h领涨 CT+49.23%,领跌 龙虾-32.99%。
—— 异动详情 ——
一、重要时间点急动
- $UAIUSDT 重要时间点急动 +2.88%(4H收盘) 🕐15:52触发(9分钟前) 〔窗口 15:47→15:52 5分钟〕
现价 0.3678 | 24h +22.03%
价差 0.05% | 24h额 $33.1M | 换手 12.2% | CMC #269
市值 $87.9M | 稀释 $367.8M | 距史低 16.72x(史低 0.022)
支撑 S1 0.3349(-8.9% 强·触15次·放量1) · S2 0.3248(-11.7% 强·触2次·共振) · S3 0.3121(-15.2% 强·触6次·放量1) · S4 0.308(-16.3% 强·触3次·放量1) · 史低 0.022(-94.0% 弱·未验证)
建仓 偏多·不追高 | 入场 回踩 0.3349 40% / 0.3248 40% / 0.3121 20% | 止损 0.2999(-18.5%·1ATR) | 目标 0.3719 | 仓位≤10%·杠杆≤3x
指标 RSI 72超买 | MACD 金叉 | BOLL 上轨区 | KDJ 95超买 | 均线多头 | ATR 3.3% | 量比 1.3x | 费率 +0.0114%
策略 顺势回踩接多·超买减配 | 分批: S1 40%→S2 40%→S3 20% | 加仓: 前批浮盈≥1ATR再接次批 | 移动止损: 浮盈≥1.5ATR止损推至成本, ≥3ATR改1ATR跟踪 | 失效: 放量跌破S3 | 48h未成交撤单
🔬 硬核技术分析(UAIUSDT)
· 趋势结构: 1h偏多/日线未共振(25/40)
· 形态结构: 低点持续抬高·偏多结构
· 量价关系: 近24h均量放大5.0x,上涨放量·结构健康(15/15)
· 动量状态: RSI 72(超买); MACD柱 收敛/反转(3/15)
· 背离检测: 无显著背离(+0)
· 波动率: 1h ATR占比 3.3%,处近7日 79 分位
· 多空力量: 近48根多头占比 56%;下影 36% vs 上影 28%
· 综合评分: 43/100 → 中性(趋势40+量价15+动量15+背离±10;≥60偏多,≤40偏空)
- $GTCUSDT 重要时间点急动 -2.34%(4H收盘) 🕐15:54触发(8分钟前) 〔窗口 15:49→15:54 5分钟〕
现价 0.1269 | 24h +29.60% | 现货 0.1267 | 基差 -0.20%
价差 0.07% | 24h额 $176.7M | 换手 659.8% | CMC #926
市值 $11.3M | 稀释 $12.9M | 距史低 1.97x(史低 0.06436)
支撑 S1 0.1216(-4.2% 弱·未验证) · S2 0.1052(-17.1% 弱·未验证) · S3 0.09583(-24.5% 强·触2次) · S4 0.09263(-27.0% 强·触4次) · 史低 0.06436(-49.3% 弱·未验证)
建仓 偏空·不接飞刀 | 入场 反抽 0.1838 50% | 止损 0.1957(+54.2%·1ATR) | 目标 S1 0.1216 / S2 0.1052 | 仓位≤10%·杠杆≤3x
指标 RSI 49 | MACD 空头 | BOLL 下轨区 | KDJ -20超卖 | 均线缠绕 | ATR 9.4% | 量比 1.2x | 费率 -0.1756%偏空拥挤
策略 震荡反抽做空·空头拥挤 | 分批: R1 50%→R2 50% | 加仓: 前批浮盈≥1ATR再接次批 | 移动止损: 浮盈≥1.5ATR止损推至成本, ≥3ATR改1ATR跟踪 | 失效: 放量突破R2 | 48h未成交撤单
- $BLUAIUSDT 重要时间点急动 +2.32%(4H收盘) 🕐15:57触发(5分钟前) 〔窗口 15:52→15:57 5分钟〕
现价 0.009097 | 24h -6.58%
价差 0.04% | 24h额 $6.0M | 换手 40.0% | CMC #933
市值 $11.1M | 稀释 $90.5M | 距史低 2.22x(史低 0.004093)
支撑 S1 0.008961(-1.5% 弱·未验证) · S2 0.008842(-2.8% 弱·触1次·放量1) · S3 0.007396(-18.7% 中·触1次·放量1·共振) · 史低 0.004093(-55.0% 弱·未验证)
建仓 偏多·不追高 | 入场 回踩 0.008961 40% / 0.008842 40% / 0.007396 20% | 止损 0.007128(-21.6%·1ATR) | 目标 0.009802 / 0.01004 | 仓位≤10%·杠杆≤3x
指标 RSI 53 | MACD 多头 | BOLL 上轨区 | KDJ 109超买 | 均线缠绕 | ATR 2.9% | 量比 0.5x | 费率 +0.0050%
策略 震荡回踩接多 | 分批: S1 40%→S2 40%→S3 20% | 加仓: 前批浮盈≥1ATR再接次批 | 移动止损: 浮盈≥1.5ATR止损推至成本, ≥3ATR改1ATR跟踪 | 失效: 放量跌破S3 | 48h未成交撤单
▶ 异动发生在重要时间窗口(K线收盘/美股开收盘),机构调仓与资金再平衡集中,该时段信号有效性通常更高,注意顺势延续与假突破的双向风险。
—— 互动 ——
你在盯 UAI 吗?评论区聊聊你的看法👇 关注我,异动 + 支撑 + 建仓策略第一时间推送。
数据来源:币安现货/合约实时行情与盘口、CMC 聚合数据;16:02:34 撰稿,事件均在 30 分钟时效内;仅供参考,不构成投资建议。
注意!UAI 重要时间点直线拉升2.9%,回踩哪里能接?
15:52(9分钟前)UAI 在重要时间点出现拉升2.9%(5分钟窗口 15:47→15:52),截至 16:02:34 现价 0.3678,24h +22.0%。同批异动还有 GTC、BLUAI。
📅 数据截至 16:02:34(事件触发时间见各条标注,价格为撰稿时实时快照)
📌 一句话看点:重要时段(K线收盘/美股开收盘)的异动多有机构参与,信号成色更高
市场概览:BTC 86,172.10(+3.35%) · ETH 2,738.42(+2.35%);全市场 24h 上涨 329 家 / 下跌 165 家;24h领涨 CT+49.23%,领跌 龙虾-32.99%。
—— 异动详情 ——
一、重要时间点急动
- $UAIUSDT 重要时间点急动 +2.88%(4H收盘) 🕐15:52触发(9分钟前) 〔窗口 15:47→15:52 5分钟〕
现价 0.3678 | 24h +22.03%
价差 0.05% | 24h额 $33.1M | 换手 12.2% | CMC #269
市值 $87.9M | 稀释 $367.8M | 距史低 16.72x(史低 0.022)
支撑 S1 0.3349(-8.9% 强·触15次·放量1) · S2 0.3248(-11.7% 强·触2次·共振) · S3 0.3121(-15.2% 强·触6次·放量1) · S4 0.308(-16.3% 强·触3次·放量1) · 史低 0.022(-94.0% 弱·未验证)
建仓 偏多·不追高 | 入场 回踩 0.3349 40% / 0.3248 40% / 0.3121 20% | 止损 0.2999(-18.5%·1ATR) | 目标 0.3719 | 仓位≤10%·杠杆≤3x
指标 RSI 72超买 | MACD 金叉 | BOLL 上轨区 | KDJ 95超买 | 均线多头 | ATR 3.3% | 量比 1.3x | 费率 +0.0114%
策略 顺势回踩接多·超买减配 | 分批: S1 40%→S2 40%→S3 20% | 加仓: 前批浮盈≥1ATR再接次批 | 移动止损: 浮盈≥1.5ATR止损推至成本, ≥3ATR改1ATR跟踪 | 失效: 放量跌破S3 | 48h未成交撤单
🔬 硬核技术分析(UAIUSDT)
· 趋势结构: 1h偏多/日线未共振(25/40)
· 形态结构: 低点持续抬高·偏多结构
· 量价关系: 近24h均量放大5.0x,上涨放量·结构健康(15/15)
· 动量状态: RSI 72(超买); MACD柱 收敛/反转(3/15)
· 背离检测: 无显著背离(+0)
· 波动率: 1h ATR占比 3.3%,处近7日 79 分位
· 多空力量: 近48根多头占比 56%;下影 36% vs 上影 28%
· 综合评分: 43/100 → 中性(趋势40+量价15+动量15+背离±10;≥60偏多,≤40偏空)
- $GTCUSDT 重要时间点急动 -2.34%(4H收盘) 🕐15:54触发(8分钟前) 〔窗口 15:49→15:54 5分钟〕
现价 0.1269 | 24h +29.60% | 现货 0.1267 | 基差 -0.20%
价差 0.07% | 24h额 $176.7M | 换手 659.8% | CMC #926
市值 $11.3M | 稀释 $12.9M | 距史低 1.97x(史低 0.06436)
支撑 S1 0.1216(-4.2% 弱·未验证) · S2 0.1052(-17.1% 弱·未验证) · S3 0.09583(-24.5% 强·触2次) · S4 0.09263(-27.0% 强·触4次) · 史低 0.06436(-49.3% 弱·未验证)
建仓 偏空·不接飞刀 | 入场 反抽 0.1838 50% | 止损 0.1957(+54.2%·1ATR) | 目标 S1 0.1216 / S2 0.1052 | 仓位≤10%·杠杆≤3x
指标 RSI 49 | MACD 空头 | BOLL 下轨区 | KDJ -20超卖 | 均线缠绕 | ATR 9.4% | 量比 1.2x | 费率 -0.1756%偏空拥挤
策略 震荡反抽做空·空头拥挤 | 分批: R1 50%→R2 50% | 加仓: 前批浮盈≥1ATR再接次批 | 移动止损: 浮盈≥1.5ATR止损推至成本, ≥3ATR改1ATR跟踪 | 失效: 放量突破R2 | 48h未成交撤单
- $BLUAIUSDT 重要时间点急动 +2.32%(4H收盘) 🕐15:57触发(5分钟前) 〔窗口 15:52→15:57 5分钟〕
现价 0.009097 | 24h -6.58%
价差 0.04% | 24h额 $6.0M | 换手 40.0% | CMC #933
市值 $11.1M | 稀释 $90.5M | 距史低 2.22x(史低 0.004093)
支撑 S1 0.008961(-1.5% 弱·未验证) · S2 0.008842(-2.8% 弱·触1次·放量1) · S3 0.007396(-18.7% 中·触1次·放量1·共振) · 史低 0.004093(-55.0% 弱·未验证)
建仓 偏多·不追高 | 入场 回踩 0.008961 40% / 0.008842 40% / 0.007396 20% | 止损 0.007128(-21.6%·1ATR) | 目标 0.009802 / 0.01004 | 仓位≤10%·杠杆≤3x
指标 RSI 53 | MACD 多头 | BOLL 上轨区 | KDJ 109超买 | 均线缠绕 | ATR 2.9% | 量比 0.5x | 费率 +0.0050%
策略 震荡回踩接多 | 分批: S1 40%→S2 40%→S3 20% | 加仓: 前批浮盈≥1ATR再接次批 | 移动止损: 浮盈≥1.5ATR止损推至成本, ≥3ATR改1ATR跟踪 | 失效: 放量跌破S3 | 48h未成交撤单
▶ 异动发生在重要时间窗口(K线收盘/美股开收盘),机构调仓与资金再平衡集中,该时段信号有效性通常更高,注意顺势延续与假突破的双向风险。
—— 互动 ——
你在盯 UAI 吗?评论区聊聊你的看法👇 关注我,异动 + 支撑 + 建仓策略第一时间推送。
数据来源:币安现货/合约实时行情与盘口、CMC 聚合数据;16:02:34 撰稿,事件均在 30 分钟时效内;仅供参考,不构成投资建议。
📅 数据截至 16:02:34(事件触发时间见各条标注,价格为撰稿时实时快照)
📌 一句话看点:重要时段(K线收盘/美股开收盘)的异动多有机构参与,信号成色更高
市场概览:BTC 86,172.10(+3.35%) · ETH 2,738.42(+2.35%);全市场 24h 上涨 329 家 / 下跌 165 家;24h领涨 CT+49.23%,领跌 龙虾-32.99%。
—— 异动详情 ——
一、重要时间点急动
- $UAIUSDT 重要时间点急动 +2.88%(4H收盘) 🕐15:52触发(9分钟前) 〔窗口 15:47→15:52 5分钟〕
现价 0.3678 | 24h +22.03%
价差 0.05% | 24h额 $33.1M | 换手 12.2% | CMC #269
市值 $87.9M | 稀释 $367.8M | 距史低 16.72x(史低 0.022)
支撑 S1 0.3349(-8.9% 强·触15次·放量1) · S2 0.3248(-11.7% 强·触2次·共振) · S3 0.3121(-15.2% 强·触6次·放量1) · S4 0.308(-16.3% 强·触3次·放量1) · 史低 0.022(-94.0% 弱·未验证)
建仓 偏多·不追高 | 入场 回踩 0.3349 40% / 0.3248 40% / 0.3121 20% | 止损 0.2999(-18.5%·1ATR) | 目标 0.3719 | 仓位≤10%·杠杆≤3x
指标 RSI 72超买 | MACD 金叉 | BOLL 上轨区 | KDJ 95超买 | 均线多头 | ATR 3.3% | 量比 1.3x | 费率 +0.0114%
策略 顺势回踩接多·超买减配 | 分批: S1 40%→S2 40%→S3 20% | 加仓: 前批浮盈≥1ATR再接次批 | 移动止损: 浮盈≥1.5ATR止损推至成本, ≥3ATR改1ATR跟踪 | 失效: 放量跌破S3 | 48h未成交撤单
🔬 硬核技术分析(UAIUSDT)
· 趋势结构: 1h偏多/日线未共振(25/40)
· 形态结构: 低点持续抬高·偏多结构
· 量价关系: 近24h均量放大5.0x,上涨放量·结构健康(15/15)
· 动量状态: RSI 72(超买); MACD柱 收敛/反转(3/15)
· 背离检测: 无显著背离(+0)
· 波动率: 1h ATR占比 3.3%,处近7日 79 分位
· 多空力量: 近48根多头占比 56%;下影 36% vs 上影 28%
· 综合评分: 43/100 → 中性(趋势40+量价15+动量15+背离±10;≥60偏多,≤40偏空)
- $GTCUSDT 重要时间点急动 -2.34%(4H收盘) 🕐15:54触发(8分钟前) 〔窗口 15:49→15:54 5分钟〕
现价 0.1269 | 24h +29.60% | 现货 0.1267 | 基差 -0.20%
价差 0.07% | 24h额 $176.7M | 换手 659.8% | CMC #926
市值 $11.3M | 稀释 $12.9M | 距史低 1.97x(史低 0.06436)
支撑 S1 0.1216(-4.2% 弱·未验证) · S2 0.1052(-17.1% 弱·未验证) · S3 0.09583(-24.5% 强·触2次) · S4 0.09263(-27.0% 强·触4次) · 史低 0.06436(-49.3% 弱·未验证)
建仓 偏空·不接飞刀 | 入场 反抽 0.1838 50% | 止损 0.1957(+54.2%·1ATR) | 目标 S1 0.1216 / S2 0.1052 | 仓位≤10%·杠杆≤3x
指标 RSI 49 | MACD 空头 | BOLL 下轨区 | KDJ -20超卖 | 均线缠绕 | ATR 9.4% | 量比 1.2x | 费率 -0.1756%偏空拥挤
策略 震荡反抽做空·空头拥挤 | 分批: R1 50%→R2 50% | 加仓: 前批浮盈≥1ATR再接次批 | 移动止损: 浮盈≥1.5ATR止损推至成本, ≥3ATR改1ATR跟踪 | 失效: 放量突破R2 | 48h未成交撤单
- $BLUAIUSDT 重要时间点急动 +2.32%(4H收盘) 🕐15:57触发(5分钟前) 〔窗口 15:52→15:57 5分钟〕
现价 0.009097 | 24h -6.58%
价差 0.04% | 24h额 $6.0M | 换手 40.0% | CMC #933
市值 $11.1M | 稀释 $90.5M | 距史低 2.22x(史低 0.004093)
支撑 S1 0.008961(-1.5% 弱·未验证) · S2 0.008842(-2.8% 弱·触1次·放量1) · S3 0.007396(-18.7% 中·触1次·放量1·共振) · 史低 0.004093(-55.0% 弱·未验证)
建仓 偏多·不追高 | 入场 回踩 0.008961 40% / 0.008842 40% / 0.007396 20% | 止损 0.007128(-21.6%·1ATR) | 目标 0.009802 / 0.01004 | 仓位≤10%·杠杆≤3x
指标 RSI 53 | MACD 多头 | BOLL 上轨区 | KDJ 109超买 | 均线缠绕 | ATR 2.9% | 量比 0.5x | 费率 +0.0050%
策略 震荡回踩接多 | 分批: S1 40%→S2 40%→S3 20% | 加仓: 前批浮盈≥1ATR再接次批 | 移动止损: 浮盈≥1.5ATR止损推至成本, ≥3ATR改1ATR跟踪 | 失效: 放量跌破S3 | 48h未成交撤单
▶ 异动发生在重要时间窗口(K线收盘/美股开收盘),机构调仓与资金再平衡集中,该时段信号有效性通常更高,注意顺势延续与假突破的双向风险。
—— 互动 ——
你在盯 UAI 吗?评论区聊聊你的看法👇 关注我,异动 + 支撑 + 建仓策略第一时间推送。
数据来源:币安现货/合约实时行情与盘口、CMC 聚合数据;16:02:34 撰稿,事件均在 30 分钟时效内;仅供参考,不构成投资建议。
25


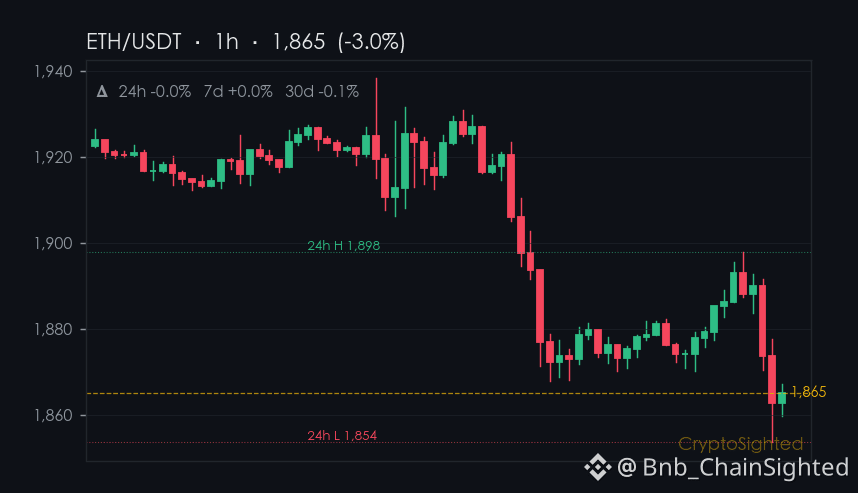
0.9% - that’s the 7-day drop for $ETH, and it’s not just a blip.
ETH’s 30-day gain of ↑5.0% feels like a false floor, with the ecosystem’s own numbers telling a different story.
SharpLink’s Q2 report, citing a net loss fueled by ETH’s decline, points to a deeper issue: Ethereum’s infrastructure is bleeding value, even as the 7-day price barely moves.
This isn’t just a short-term correction. It’s a structural shift - one that’s quietly rewriting the rules for DeFi.
Can Ethereum’s infrastructure still justify its 56.4% $BTC-pegged dominance when its own ecosystem is under strain?
—
Not financial advice. DYOR.
📌 Hotspot Watch · #269 · #CryptoTrends #CryptoSighted $ETH
0.9% - that’s the 7-day drop for $ETH , and it’s not just a blip.
ETH’s 30-day gain of ↑5.0% feels like a false floor, with the ecosystem’s own numbers telling a different story.
SharpLink’s Q2 report, citing a net loss fueled by ETH’s decline, points to a deeper issue: Ethereum’s infrastructure is bleeding value, even as the 7-day price barely moves.
This isn’t just a short-term correction. It’s a structural shift - one that’s quietly rewriting the rules for DeFi.
Can Ethereum’s infrastructure still justify its 56.4% $BTC -pegged dominance when its own ecosystem is under strain?
—
Not financial advice. DYOR.
📌 Hotspot Watch · #269 · #CryptoTrends #CryptoSighted $ETH
ETH’s 30-day gain of ↑5.0% feels like a false floor, with the ecosystem’s own numbers telling a different story.
SharpLink’s Q2 report, citing a net loss fueled by ETH’s decline, points to a deeper issue: Ethereum’s infrastructure is bleeding value, even as the 7-day price barely moves.
This isn’t just a short-term correction. It’s a structural shift - one that’s quietly rewriting the rules for DeFi.
Can Ethereum’s infrastructure still justify its 56.4% $BTC -pegged dominance when its own ecosystem is under strain?
—
Not financial advice. DYOR.
📌 Hotspot Watch · #269 · #CryptoTrends #CryptoSighted $ETH
82

·
--
** Teknik Analizde Destek ve Direnç Noktaları Nasıl Belirlenir? 🕒Zano (ZANOUSDT) is trending right now!
Rank: #269
** Teknik analiz, kripto para ticaretinde önemli bir rol oynar. Destek ve direnç noktalarını belirlemek, yatırımcıların piyasa trendlerini daha iyi anlamalarına yardımcı olur. 📊 **Adım 1: Grafik Türünü Seçin** İlk adım, kripto para biriminin fiyat grafiğini açmaktır. Çoğu trader, **mum grafiği** veya **çubuk grafiği** kullanır. Şöyle düşün: Grafik, piyasanın nabzını gösterir. 💡 **Adım 2: Zaman Çerçevesini Belirleyin** Zaman çerçevesi, analizinizin detay seviyesini belirler. Kısa vadeli traderlar **1 saatlik** veya **4 saatlik** grafiklerle çalışırken, uzun vadeli yatırımcılar **günlük** veya **haftalık** grafiklere bakar. 🕒 **Adım 3: Destek ve Direnç Noktalarını Bulun** Destek noktaları, fiyatın düştüğü ancak geri döndüğü seviyelerdir. Direnç noktaları ise fiyatın yükseldiği ancak geri çekildiği seviyelerdir. 📈 Örnek: 4 saatlik grafikte, son 48 saat içinde 80.000 $ seviyesinde destek noktası oluştuğunu görüyoruz. Fiyat bu seviyeye düştü ancak geri döndü. Aynı grafikte, 82.000 $ seviyesinde direnç noktası olduğunu da görüyoruz. 🚀 **Adım 4: Trend Çizgileri Çekin** Trend çizgileri, destek ve direnç noktalarını birleştirerek piyasa trendini gösterir. Yukarı trend çizgisi, yükseliş trendini gösterirken, aşağı trend çizgisi düşüş trendini gösterir. 📉 **Adım 5: Pratik Uygulama** Şimdi, günlük grafikte destek ve direnç noktalarını belirleyelim. Grafikte, 2.500 $ seviyesinde destek noktası oluştuğunu görüyoruz
** Teknik Analizde Destek ve Direnç Noktaları Nasıl Belirlenir? 🕒
Zano (ZANOUSDT) is trending right now!
Rank: #269
** Teknik analiz, kripto para ticaretinde önemli bir rol oynar. Destek ve direnç noktalarını belirlemek, yatırımcıların piyasa trendlerini daha iyi anlamalarına yardımcı olur. 📊 **Adım 1: Grafik Türünü Seçin** İlk adım, kripto para biriminin fiyat grafiğini açmaktır. Çoğu trader, **mum grafiği** veya **çubuk grafiği** kullanır. Şöyle düşün: Grafik, piyasanın nabzını gösterir. 💡 **Adım 2: Zaman Çerçevesini Belirleyin** Zaman çerçevesi, analizinizin detay seviyesini belirler. Kısa vadeli traderlar **1 saatlik** veya **4 saatlik** grafiklerle çalışırken, uzun vadeli yatırımcılar **günlük** veya **haftalık** grafiklere bakar. 🕒 **Adım 3: Destek ve Direnç Noktalarını Bulun** Destek noktaları, fiyatın düştüğü ancak geri döndüğü seviyelerdir. Direnç noktaları ise fiyatın yükseldiği ancak geri çekildiği seviyelerdir. 📈 Örnek: 4 saatlik grafikte, son 48 saat içinde 80.000 $ seviyesinde destek noktası oluştuğunu görüyoruz. Fiyat bu seviyeye düştü ancak geri döndü. Aynı grafikte, 82.000 $ seviyesinde direnç noktası olduğunu da görüyoruz. 🚀 **Adım 4: Trend Çizgileri Çekin** Trend çizgileri, destek ve direnç noktalarını birleştirerek piyasa trendini gösterir. Yukarı trend çizgisi, yükseliş trendini gösterirken, aşağı trend çizgisi düşüş trendini gösterir. 📉 **Adım 5: Pratik Uygulama** Şimdi, günlük grafikte destek ve direnç noktalarını belirleyelim. Grafikte, 2.500 $ seviyesinde destek noktası oluştuğunu görüyoruz
Rank: #269
** Teknik analiz, kripto para ticaretinde önemli bir rol oynar. Destek ve direnç noktalarını belirlemek, yatırımcıların piyasa trendlerini daha iyi anlamalarına yardımcı olur. 📊 **Adım 1: Grafik Türünü Seçin** İlk adım, kripto para biriminin fiyat grafiğini açmaktır. Çoğu trader, **mum grafiği** veya **çubuk grafiği** kullanır. Şöyle düşün: Grafik, piyasanın nabzını gösterir. 💡 **Adım 2: Zaman Çerçevesini Belirleyin** Zaman çerçevesi, analizinizin detay seviyesini belirler. Kısa vadeli traderlar **1 saatlik** veya **4 saatlik** grafiklerle çalışırken, uzun vadeli yatırımcılar **günlük** veya **haftalık** grafiklere bakar. 🕒 **Adım 3: Destek ve Direnç Noktalarını Bulun** Destek noktaları, fiyatın düştüğü ancak geri döndüğü seviyelerdir. Direnç noktaları ise fiyatın yükseldiği ancak geri çekildiği seviyelerdir. 📈 Örnek: 4 saatlik grafikte, son 48 saat içinde 80.000 $ seviyesinde destek noktası oluştuğunu görüyoruz. Fiyat bu seviyeye düştü ancak geri döndü. Aynı grafikte, 82.000 $ seviyesinde direnç noktası olduğunu da görüyoruz. 🚀 **Adım 4: Trend Çizgileri Çekin** Trend çizgileri, destek ve direnç noktalarını birleştirerek piyasa trendini gösterir. Yukarı trend çizgisi, yükseliş trendini gösterirken, aşağı trend çizgisi düşüş trendini gösterir. 📉 **Adım 5: Pratik Uygulama** Şimdi, günlük grafikte destek ve direnç noktalarını belirleyelim. Grafikte, 2.500 $ seviyesinde destek noktası oluştuğunu görüyoruz
3
Log in to explore more content
Join global crypto users on Binance Square
⚡️ Get latest and useful information about crypto.
💬 Trusted by the world’s largest crypto exchange.
👍 Discover real insights from verified creators.
Email / Phone number
Trending Topics
1
#USMidterms-WhatAreMarketsExpecting?
124,368 views
975 Discussing
2
#USOctoberNFP-AreRateCutsStillPossible
266,971 views
2,077 Discussing
3
#CircleQ3Revenue865M
20 views
47 Discussing
4
#AMDBeatsExpectations-AINarrativeContinues
30,319 views
373 Discussing
5
#BinanceIncidentReport
281,394 views
1,514 Discussing
6
#AnthropicIPOPricedDownasInvestorsEye$1.5T
19,888 views
113 Discussing
7
#HongKongPassesCryptoAssetReportingFrameworkAmendment
28 views
6 Discussing
8
#37thQuarterlyBNBBurnRemoves1.64MillionBNB
1,961 views
76 Discussing
9
#BinanceReopensWithdrawalsForMoreAssets
387,002 views
2,452 Discussing
10
#HongKongToLicenseVirtualAssetCustodyAndAdvisory
4,142 views
110 Discussing