
幣圈洋哥
72 Posts

幣圈洋哥
Report
Block User
UMC交易團隊,不定時直播解盤
我們分享的不只是點位,
更是如何在波動中保持平靜的心法。
不妨加入我的社群一起討論、進步!
https://linktr.ee/ocean487_d

BTC Holder
High-Frequency Trader
3.3 Years
2 Following
78 Followers
126 Liked
Posts
All
Videos
·
--
Day80 Market Analysis
The market has experienced a significant pullback, and the price focus has shifted lower again. Today, it is expected to oscillate in the range of 1891 ~ 1834 for low-end consolidation.
After the pullback, the current level is relatively low; it is recommended to first observe the support strength at the bottom within this range before waiting for clear breakthrough or breakdown signals to make moves accordingly.
Bullish Breakout Plan
If it can effectively break through the upper edge of the range at 1891 with volume, it indicates that the bulls are attempting to build a bottom and initiate a rebound,
The rebound targets to watch above are: 1921 / 1947 / 1968 / 1977.
Bearish Breakdown Plan
If it breaks down below the lower edge of the range at 1834, it means that the bearish momentum continues, and the bottom has not yet formed,
The pullback targets to watch below are: 1812 / 1784 / 1764.
Friends who are interested in a more detailed market analysis can help me
Like and subscribe to my YouTube by searching 洋哥ETH (@Ocean487_d)
Like and subscribe to Threads by searching 洋哥ETH (@Ocean487_d)
Day80 Market Analysis
The market has experienced a significant pullback, and the price focus has shifted lower again. Today, it is expected to oscillate in the range of 1891 ~ 1834 for low-end consolidation.
After the pullback, the current level is relatively low; it is recommended to first observe the support strength at the bottom within this range before waiting for clear breakthrough or breakdown signals to make moves accordingly.
Bullish Breakout Plan
If it can effectively break through the upper edge of the range at 1891 with volume, it indicates that the bulls are attempting to build a bottom and initiate a rebound,
The rebound targets to watch above are: 1921 / 1947 / 1968 / 1977.
Bearish Breakdown Plan
If it breaks down below the lower edge of the range at 1834, it means that the bearish momentum continues, and the bottom has not yet formed,
The pullback targets to watch below are: 1812 / 1784 / 1764.
Friends who are interested in a more detailed market analysis can help me
Like and subscribe to my YouTube by searching 洋哥ETH (@Ocean487_d)
Like and subscribe to Threads by searching 洋哥ETH (@Ocean487_d)
The market has experienced a significant pullback, and the price focus has shifted lower again. Today, it is expected to oscillate in the range of 1891 ~ 1834 for low-end consolidation.
After the pullback, the current level is relatively low; it is recommended to first observe the support strength at the bottom within this range before waiting for clear breakthrough or breakdown signals to make moves accordingly.
Bullish Breakout Plan
If it can effectively break through the upper edge of the range at 1891 with volume, it indicates that the bulls are attempting to build a bottom and initiate a rebound,
The rebound targets to watch above are: 1921 / 1947 / 1968 / 1977.
Bearish Breakdown Plan
If it breaks down below the lower edge of the range at 1834, it means that the bearish momentum continues, and the bottom has not yet formed,
The pullback targets to watch below are: 1812 / 1784 / 1764.
Friends who are interested in a more detailed market analysis can help me
Like and subscribe to my YouTube by searching 洋哥ETH (@Ocean487_d)
Like and subscribe to Threads by searching 洋哥ETH (@Ocean487_d)
7
595
·
--
Day79 Market Analysis
Currently, the price is around 2067, and the overall probability of maintaining a bullish continuation is high.
From the internal chip observation of the K bar, no robots (main program orders) have been found to be shorting at high levels. The afternoon market shows that retail investors' short positions are mostly concentrated at the bottom, indicating that there is currently a temporary lack of bearish liquidity above. Therefore, although the current market is in a consolidation phase, the opportunity for an upward breakout remains strong.
Bullish Targets and Observation Points
If the market continues to push upward, the targets to focus on in order are: 2073 / 2098 / 2119 / 2129 / 2146.
(Advanced Observation: During the process of testing the highs, closely monitor whether there are signs of robots entering to short in the K bar, as this will help determine if the market faces reversal pressure.)
Consolidation Retracement and Defensive Ranges
As we are currently in a consolidation rhythm, if the price shows a downward retracement, the primary operation price range to pay attention to is between 2034 and 2009, observing whether there is strong buying support in this area.
Bearish Breakdown Risks
If the consolidation goes too deep and the price breaks below the 2009 defense line, it indicates that the strong pattern has been disrupted, with a very high probability of retreating back into last week's consolidation range,
with downward retracement targets sequentially at: 1993 / 1977 / 1947.
Friends who are interested in a more detailed market analysis can help me
like and subscribe on YouTube by searching for Yang Ge ETH (@Ocean487_d)
like and subscribe on Threads by searching for Yang Ge ETH (@Ocean487_d)
Day79 Market Analysis
Currently, the price is around 2067, and the overall probability of maintaining a bullish continuation is high.
From the internal chip observation of the K bar, no robots (main program orders) have been found to be shorting at high levels. The afternoon market shows that retail investors' short positions are mostly concentrated at the bottom, indicating that there is currently a temporary lack of bearish liquidity above. Therefore, although the current market is in a consolidation phase, the opportunity for an upward breakout remains strong.
Bullish Targets and Observation Points
If the market continues to push upward, the targets to focus on in order are: 2073 / 2098 / 2119 / 2129 / 2146.
(Advanced Observation: During the process of testing the highs, closely monitor whether there are signs of robots entering to short in the K bar, as this will help determine if the market faces reversal pressure.)
Consolidation Retracement and Defensive Ranges
As we are currently in a consolidation rhythm, if the price shows a downward retracement, the primary operation price range to pay attention to is between 2034 and 2009, observing whether there is strong buying support in this area.
Bearish Breakdown Risks
If the consolidation goes too deep and the price breaks below the 2009 defense line, it indicates that the strong pattern has been disrupted, with a very high probability of retreating back into last week's consolidation range,
with downward retracement targets sequentially at: 1993 / 1977 / 1947.
Friends who are interested in a more detailed market analysis can help me
like and subscribe on YouTube by searching for Yang Ge ETH (@Ocean487_d)
like and subscribe on Threads by searching for Yang Ge ETH (@Ocean487_d)
Currently, the price is around 2067, and the overall probability of maintaining a bullish continuation is high.
From the internal chip observation of the K bar, no robots (main program orders) have been found to be shorting at high levels. The afternoon market shows that retail investors' short positions are mostly concentrated at the bottom, indicating that there is currently a temporary lack of bearish liquidity above. Therefore, although the current market is in a consolidation phase, the opportunity for an upward breakout remains strong.
Bullish Targets and Observation Points
If the market continues to push upward, the targets to focus on in order are: 2073 / 2098 / 2119 / 2129 / 2146.
(Advanced Observation: During the process of testing the highs, closely monitor whether there are signs of robots entering to short in the K bar, as this will help determine if the market faces reversal pressure.)
Consolidation Retracement and Defensive Ranges
As we are currently in a consolidation rhythm, if the price shows a downward retracement, the primary operation price range to pay attention to is between 2034 and 2009, observing whether there is strong buying support in this area.
Bearish Breakdown Risks
If the consolidation goes too deep and the price breaks below the 2009 defense line, it indicates that the strong pattern has been disrupted, with a very high probability of retreating back into last week's consolidation range,
with downward retracement targets sequentially at: 1993 / 1977 / 1947.
Friends who are interested in a more detailed market analysis can help me
like and subscribe on YouTube by searching for Yang Ge ETH (@Ocean487_d)
like and subscribe on Threads by searching for Yang Ge ETH (@Ocean487_d)
342
·
--
Day78 Market Analysis
The market has shown a rebound and the price has returned above the 1900 level. Today, it is expected to fluctuate within the range of 1947 ~ 1922.
After experiencing recent volatility, it is advisable to first observe the support and resistance transitions within this range, waiting for clear breakout or breakdown signals.
Bullish Breakout Plan
If it can effectively break through the upper edge of the range at 1947 with significant volume, it indicates the continuation of bullish momentum,
with the upper rebound targets to focus on sequentially: 1967 / 1978 / 1993.
(If the upward attack goes smoothly, it will face pressure testing before the significant 2000 level again.)
Bearish Breakdown Plan
If it breaks below the lower edge of the range at 1922, it means that the rebound strength is fading, and the market will retest the bottom again,
with the lower pullback targets to focus on sequentially: 1908 / 1891 / 1861.
Friends who are interested in more detailed market analysis can help me
like and subscribe on YouTube by searching for Yang Ge ETH (@Ocean487_d)
like and subscribe on Threads by searching for Yang Ge ETH (@Ocean487_d)
Day78 Market Analysis
The market has shown a rebound and the price has returned above the 1900 level. Today, it is expected to fluctuate within the range of 1947 ~ 1922.
After experiencing recent volatility, it is advisable to first observe the support and resistance transitions within this range, waiting for clear breakout or breakdown signals.
Bullish Breakout Plan
If it can effectively break through the upper edge of the range at 1947 with significant volume, it indicates the continuation of bullish momentum,
with the upper rebound targets to focus on sequentially: 1967 / 1978 / 1993.
(If the upward attack goes smoothly, it will face pressure testing before the significant 2000 level again.)
Bearish Breakdown Plan
If it breaks below the lower edge of the range at 1922, it means that the rebound strength is fading, and the market will retest the bottom again,
with the lower pullback targets to focus on sequentially: 1908 / 1891 / 1861.
Friends who are interested in more detailed market analysis can help me
like and subscribe on YouTube by searching for Yang Ge ETH (@Ocean487_d)
like and subscribe on Threads by searching for Yang Ge ETH (@Ocean487_d)
The market has shown a rebound and the price has returned above the 1900 level. Today, it is expected to fluctuate within the range of 1947 ~ 1922.
After experiencing recent volatility, it is advisable to first observe the support and resistance transitions within this range, waiting for clear breakout or breakdown signals.
Bullish Breakout Plan
If it can effectively break through the upper edge of the range at 1947 with significant volume, it indicates the continuation of bullish momentum,
with the upper rebound targets to focus on sequentially: 1967 / 1978 / 1993.
(If the upward attack goes smoothly, it will face pressure testing before the significant 2000 level again.)
Bearish Breakdown Plan
If it breaks below the lower edge of the range at 1922, it means that the rebound strength is fading, and the market will retest the bottom again,
with the lower pullback targets to focus on sequentially: 1908 / 1891 / 1861.
Friends who are interested in more detailed market analysis can help me
like and subscribe on YouTube by searching for Yang Ge ETH (@Ocean487_d)
like and subscribe on Threads by searching for Yang Ge ETH (@Ocean487_d)
2
612
·
--
Day77 Market Analysis
The market continues to trend downwards, with the current price reaching a lower level. Today, there is a high probability of low-end fluctuations within the range of 1834 ~ 1812.
At this relatively low position, the battle between bulls and bears will become more intense. Special caution is needed to prevent the main forces from deliberately breaking through support in a "manipulation washout" tactic.
🔴 Bullish Breakthrough Plan
If it can stabilize and effectively break through the upper edge of the range at 1834, the bulls will have a chance to catch their breath.
For the upward rebound target, it is advisable to adopt a "step-by-step" steady strategy, sequentially focusing on: 1846 / 1861 / 1871.
🟢 Bearish Breakdown and Washout Script
If it breaks down below the lower edge of the range at 1812, please be sure to raise your vigilance, as there is a high possibility of "downward manipulation (washout)" occurring here.
Washout Observation Zone: After breaking down, please closely monitor the buffer zone of 1796 ~ 1812 for signs of a rapid recovery.
Substantial Continued Downward Risk: If even the last defense line at 1796 is broken, it indicates that the bearish selling pressure is real and strong, with a high probability of further probing downwards: 1784 / 1765 / 1743.
Day77 Market Analysis
The market continues to trend downwards, with the current price reaching a lower level. Today, there is a high probability of low-end fluctuations within the range of 1834 ~ 1812.
At this relatively low position, the battle between bulls and bears will become more intense. Special caution is needed to prevent the main forces from deliberately breaking through support in a "manipulation washout" tactic.
🔴 Bullish Breakthrough Plan
If it can stabilize and effectively break through the upper edge of the range at 1834, the bulls will have a chance to catch their breath.
For the upward rebound target, it is advisable to adopt a "step-by-step" steady strategy, sequentially focusing on: 1846 / 1861 / 1871.
🟢 Bearish Breakdown and Washout Script
If it breaks down below the lower edge of the range at 1812, please be sure to raise your vigilance, as there is a high possibility of "downward manipulation (washout)" occurring here.
Washout Observation Zone: After breaking down, please closely monitor the buffer zone of 1796 ~ 1812 for signs of a rapid recovery.
Substantial Continued Downward Risk: If even the last defense line at 1796 is broken, it indicates that the bearish selling pressure is real and strong, with a high probability of further probing downwards: 1784 / 1765 / 1743.
The market continues to trend downwards, with the current price reaching a lower level. Today, there is a high probability of low-end fluctuations within the range of 1834 ~ 1812.
At this relatively low position, the battle between bulls and bears will become more intense. Special caution is needed to prevent the main forces from deliberately breaking through support in a "manipulation washout" tactic.
🔴 Bullish Breakthrough Plan
If it can stabilize and effectively break through the upper edge of the range at 1834, the bulls will have a chance to catch their breath.
For the upward rebound target, it is advisable to adopt a "step-by-step" steady strategy, sequentially focusing on: 1846 / 1861 / 1871.
🟢 Bearish Breakdown and Washout Script
If it breaks down below the lower edge of the range at 1812, please be sure to raise your vigilance, as there is a high possibility of "downward manipulation (washout)" occurring here.
Washout Observation Zone: After breaking down, please closely monitor the buffer zone of 1796 ~ 1812 for signs of a rapid recovery.
Substantial Continued Downward Risk: If even the last defense line at 1796 is broken, it indicates that the bearish selling pressure is real and strong, with a high probability of further probing downwards: 1784 / 1765 / 1743.
1
421
·
--
Day76 Market Analysis
The extreme compression over the weekend has finally made a statement, with the market breaking below the consolidation range of the previous days, and the overall structure currently appears weak. Today, close attention should be paid to the two key support and resistance levels at 1922 and 1911.
🔴 Bullish Rebound Plan
To restart bullish momentum, the premise is to break through with volume and stabilize above 1922. After confirming stability, the rebound targets above could sequentially look at: 1947 / 1977.
🟢 Bearish Breakdown Plan and Two Major Scenarios
The current market is weak, with a very high probability of breaking below the support at 1911. If it breaks, pay attention to the following two potential developments: Scenario One (Green Line Wash): The main force may manipulate the wash here, and closely monitor whether there is strong support or pin bar signs in the range of 1891 ~ 1900. Scenario Two (Blue Line Continued Decline): If bearish momentum is strong, a direct break below 1892 will initiate a new wave of downward trend, with the targets below sequentially looking at: 1861 / 1834 / 1812 / 1784.
⚠️ Extreme Risk Warning
If the downward trend cannot be stopped, and even the bottom at 1784 is breached, a significant vacuum area will appear below, with a high probability of triggering a waterfall decline, directly testing the deep water area at 1512. Please ensure strict risk control!
Friends interested in a more detailed market analysis can help me
Like and subscribe on YouTube by searching for 洋哥ETH (@Ocean487_d)
Like and subscribe on Threads by searching for 洋哥ETH (@Ocean487_d)
Day76 Market Analysis
The extreme compression over the weekend has finally made a statement, with the market breaking below the consolidation range of the previous days, and the overall structure currently appears weak. Today, close attention should be paid to the two key support and resistance levels at 1922 and 1911.
🔴 Bullish Rebound Plan
To restart bullish momentum, the premise is to break through with volume and stabilize above 1922. After confirming stability, the rebound targets above could sequentially look at: 1947 / 1977.
🟢 Bearish Breakdown Plan and Two Major Scenarios
The current market is weak, with a very high probability of breaking below the support at 1911. If it breaks, pay attention to the following two potential developments: Scenario One (Green Line Wash): The main force may manipulate the wash here, and closely monitor whether there is strong support or pin bar signs in the range of 1891 ~ 1900. Scenario Two (Blue Line Continued Decline): If bearish momentum is strong, a direct break below 1892 will initiate a new wave of downward trend, with the targets below sequentially looking at: 1861 / 1834 / 1812 / 1784.
⚠️ Extreme Risk Warning
If the downward trend cannot be stopped, and even the bottom at 1784 is breached, a significant vacuum area will appear below, with a high probability of triggering a waterfall decline, directly testing the deep water area at 1512. Please ensure strict risk control!
Friends interested in a more detailed market analysis can help me
Like and subscribe on YouTube by searching for 洋哥ETH (@Ocean487_d)
Like and subscribe on Threads by searching for 洋哥ETH (@Ocean487_d)
The extreme compression over the weekend has finally made a statement, with the market breaking below the consolidation range of the previous days, and the overall structure currently appears weak. Today, close attention should be paid to the two key support and resistance levels at 1922 and 1911.
🔴 Bullish Rebound Plan
To restart bullish momentum, the premise is to break through with volume and stabilize above 1922. After confirming stability, the rebound targets above could sequentially look at: 1947 / 1977.
🟢 Bearish Breakdown Plan and Two Major Scenarios
The current market is weak, with a very high probability of breaking below the support at 1911. If it breaks, pay attention to the following two potential developments: Scenario One (Green Line Wash): The main force may manipulate the wash here, and closely monitor whether there is strong support or pin bar signs in the range of 1891 ~ 1900. Scenario Two (Blue Line Continued Decline): If bearish momentum is strong, a direct break below 1892 will initiate a new wave of downward trend, with the targets below sequentially looking at: 1861 / 1834 / 1812 / 1784.
⚠️ Extreme Risk Warning
If the downward trend cannot be stopped, and even the bottom at 1784 is breached, a significant vacuum area will appear below, with a high probability of triggering a waterfall decline, directly testing the deep water area at 1512. Please ensure strict risk control!
Friends interested in a more detailed market analysis can help me
Like and subscribe on YouTube by searching for 洋哥ETH (@Ocean487_d)
Like and subscribe on Threads by searching for 洋哥ETH (@Ocean487_d)
374
·
--
Day75 Market Analysis
Coinciding with the weekend holiday, market liquidity is low, and the price has been locked in a very narrow range of 1977 ~ 1948 for the third consecutive day.
In the face of this extremely compressed "weekend stagnation" market, it is essential to maintain maximum patience in operations. It is highly recommended to watch more and act less, to guard against the main forces taking advantage of low liquidity to perform up and down pinning (door-opening market), and to wait for the substantial directional indication after the opening of the new week before making any moves.
🔴 Bullish Rebound Plan
If it can effectively break through the upper edge of the range at 1977 with volume, the bulls will have a chance to restart their offensive,
The rebound targets above to watch in sequence are: 1993 / 2008 / 2034.
(Need to closely monitor the substantial resistance around the 2000 level)
🟢 Bearish Continuation Risk
If it breaks below the lower edge of the range at 1948, it means that after consolidation, the direction is chosen downwards,
The pullback targets below to watch in sequence are: 1922 / 1891 / 1861.
Friends who are interested in a more detailed market analysis can help me
like and subscribe on YouTube search for Yang Ge ETH (@Ocean487_d)
like and subscribe on Threads search for Yang Ge ETH (@Ocean487_d)
Day75 Market Analysis
Coinciding with the weekend holiday, market liquidity is low, and the price has been locked in a very narrow range of 1977 ~ 1948 for the third consecutive day.
In the face of this extremely compressed "weekend stagnation" market, it is essential to maintain maximum patience in operations. It is highly recommended to watch more and act less, to guard against the main forces taking advantage of low liquidity to perform up and down pinning (door-opening market), and to wait for the substantial directional indication after the opening of the new week before making any moves.
🔴 Bullish Rebound Plan
If it can effectively break through the upper edge of the range at 1977 with volume, the bulls will have a chance to restart their offensive,
The rebound targets above to watch in sequence are: 1993 / 2008 / 2034.
(Need to closely monitor the substantial resistance around the 2000 level)
🟢 Bearish Continuation Risk
If it breaks below the lower edge of the range at 1948, it means that after consolidation, the direction is chosen downwards,
The pullback targets below to watch in sequence are: 1922 / 1891 / 1861.
Friends who are interested in a more detailed market analysis can help me
like and subscribe on YouTube search for Yang Ge ETH (@Ocean487_d)
like and subscribe on Threads search for Yang Ge ETH (@Ocean487_d)
Coinciding with the weekend holiday, market liquidity is low, and the price has been locked in a very narrow range of 1977 ~ 1948 for the third consecutive day.
In the face of this extremely compressed "weekend stagnation" market, it is essential to maintain maximum patience in operations. It is highly recommended to watch more and act less, to guard against the main forces taking advantage of low liquidity to perform up and down pinning (door-opening market), and to wait for the substantial directional indication after the opening of the new week before making any moves.
🔴 Bullish Rebound Plan
If it can effectively break through the upper edge of the range at 1977 with volume, the bulls will have a chance to restart their offensive,
The rebound targets above to watch in sequence are: 1993 / 2008 / 2034.
(Need to closely monitor the substantial resistance around the 2000 level)
🟢 Bearish Continuation Risk
If it breaks below the lower edge of the range at 1948, it means that after consolidation, the direction is chosen downwards,
The pullback targets below to watch in sequence are: 1922 / 1891 / 1861.
Friends who are interested in a more detailed market analysis can help me
like and subscribe on YouTube search for Yang Ge ETH (@Ocean487_d)
like and subscribe on Threads search for Yang Ge ETH (@Ocean487_d)
291
·
--
Day74 Market Analysis
The market continues to stick, and today is expected to move sideways within the narrow range of 1977 ~ 1948. Since the levels completely coincide with yesterday, it shows that the main force is highly cautious in this range. The weekend's consolidation rhythm requires patience in operations, waiting for a substantial breakout or breakdown before proceeding with trend-following actions. Avoid frequently chasing highs and lows within the range.
🔴 Bullish Rebound Plan
If a significant breakout occurs above the upper edge of the range at 1977, an upward counterattack will be attempted,
with rebound targets above to watch in order: 1993 / 2008 / 2034.
(Note the resistance test near the integer level of 2000)
🟢 Bearish Continuation Risk
If it breaks below the lower edge of the range at 1948, it means that the direction choice after consolidation is downwards, giving the bears an advantage,
downward pullback targets to watch in order: 1922 / 1891 / 1861.
Friends who are interested in a more detailed market analysis can help me
like and subscribe on YouTube, search for Yang Ge ETH (@Ocean487_d)
like and subscribe on Threads, search for Yang Ge ETH (@Ocean487_d)
Day74 Market Analysis
The market continues to stick, and today is expected to move sideways within the narrow range of 1977 ~ 1948. Since the levels completely coincide with yesterday, it shows that the main force is highly cautious in this range. The weekend's consolidation rhythm requires patience in operations, waiting for a substantial breakout or breakdown before proceeding with trend-following actions. Avoid frequently chasing highs and lows within the range.
🔴 Bullish Rebound Plan
If a significant breakout occurs above the upper edge of the range at 1977, an upward counterattack will be attempted,
with rebound targets above to watch in order: 1993 / 2008 / 2034.
(Note the resistance test near the integer level of 2000)
🟢 Bearish Continuation Risk
If it breaks below the lower edge of the range at 1948, it means that the direction choice after consolidation is downwards, giving the bears an advantage,
downward pullback targets to watch in order: 1922 / 1891 / 1861.
Friends who are interested in a more detailed market analysis can help me
like and subscribe on YouTube, search for Yang Ge ETH (@Ocean487_d)
like and subscribe on Threads, search for Yang Ge ETH (@Ocean487_d)
The market continues to stick, and today is expected to move sideways within the narrow range of 1977 ~ 1948. Since the levels completely coincide with yesterday, it shows that the main force is highly cautious in this range. The weekend's consolidation rhythm requires patience in operations, waiting for a substantial breakout or breakdown before proceeding with trend-following actions. Avoid frequently chasing highs and lows within the range.
🔴 Bullish Rebound Plan
If a significant breakout occurs above the upper edge of the range at 1977, an upward counterattack will be attempted,
with rebound targets above to watch in order: 1993 / 2008 / 2034.
(Note the resistance test near the integer level of 2000)
🟢 Bearish Continuation Risk
If it breaks below the lower edge of the range at 1948, it means that the direction choice after consolidation is downwards, giving the bears an advantage,
downward pullback targets to watch in order: 1922 / 1891 / 1861.
Friends who are interested in a more detailed market analysis can help me
like and subscribe on YouTube, search for Yang Ge ETH (@Ocean487_d)
like and subscribe on Threads, search for Yang Ge ETH (@Ocean487_d)
121
·
--
Day73 Market Analysis
The market continues to cling, with today's expectations still within the narrow range of 1977 ~ 1948 for sideways consolidation.
Since the levels completely overlap with yesterday, it shows that the main players are highly cautious in this range. Additionally, as it's Friday, we are about to enter the weekend consolidation rhythm; it is essential to remain patient in operations, waiting for substantial volume breakthroughs or breakdowns before taking actions in the prevailing direction, and avoid frequently chasing highs and lows within the range.
🔴 Bullish Rebound Plan
If it can effectively break through the upper edge of the range at 1977 with volume, it will attempt to initiate a rebound upwards,
The rebound targets above are: 1993 / 2008 / 2034.
(Note the resistance test near the integer level of 2000)
🟢 Bearish Continuation Risk
If it breaks below the lower edge of the range at 1948, it means the directional choice after the sideways movement is downwards, giving the bears an advantage,
The pullback targets below are: 1922 / 1891 / 1861.
Friends interested in a more detailed market analysis can help me
like and subscribe on YouTube by searching for 洋哥ETH (@Ocean487_d)
like and subscribe on Threads by searching for 洋哥ETH (@Ocean487_d)
Day73 Market Analysis
The market continues to cling, with today's expectations still within the narrow range of 1977 ~ 1948 for sideways consolidation.
Since the levels completely overlap with yesterday, it shows that the main players are highly cautious in this range. Additionally, as it's Friday, we are about to enter the weekend consolidation rhythm; it is essential to remain patient in operations, waiting for substantial volume breakthroughs or breakdowns before taking actions in the prevailing direction, and avoid frequently chasing highs and lows within the range.
🔴 Bullish Rebound Plan
If it can effectively break through the upper edge of the range at 1977 with volume, it will attempt to initiate a rebound upwards,
The rebound targets above are: 1993 / 2008 / 2034.
(Note the resistance test near the integer level of 2000)
🟢 Bearish Continuation Risk
If it breaks below the lower edge of the range at 1948, it means the directional choice after the sideways movement is downwards, giving the bears an advantage,
The pullback targets below are: 1922 / 1891 / 1861.
Friends interested in a more detailed market analysis can help me
like and subscribe on YouTube by searching for 洋哥ETH (@Ocean487_d)
like and subscribe on Threads by searching for 洋哥ETH (@Ocean487_d)
The market continues to cling, with today's expectations still within the narrow range of 1977 ~ 1948 for sideways consolidation.
Since the levels completely overlap with yesterday, it shows that the main players are highly cautious in this range. Additionally, as it's Friday, we are about to enter the weekend consolidation rhythm; it is essential to remain patient in operations, waiting for substantial volume breakthroughs or breakdowns before taking actions in the prevailing direction, and avoid frequently chasing highs and lows within the range.
🔴 Bullish Rebound Plan
If it can effectively break through the upper edge of the range at 1977 with volume, it will attempt to initiate a rebound upwards,
The rebound targets above are: 1993 / 2008 / 2034.
(Note the resistance test near the integer level of 2000)
🟢 Bearish Continuation Risk
If it breaks below the lower edge of the range at 1948, it means the directional choice after the sideways movement is downwards, giving the bears an advantage,
The pullback targets below are: 1922 / 1891 / 1861.
Friends interested in a more detailed market analysis can help me
like and subscribe on YouTube by searching for 洋哥ETH (@Ocean487_d)
like and subscribe on Threads by searching for 洋哥ETH (@Ocean487_d)
4
413
·
--
Bullish
Day 71 Market Analysis
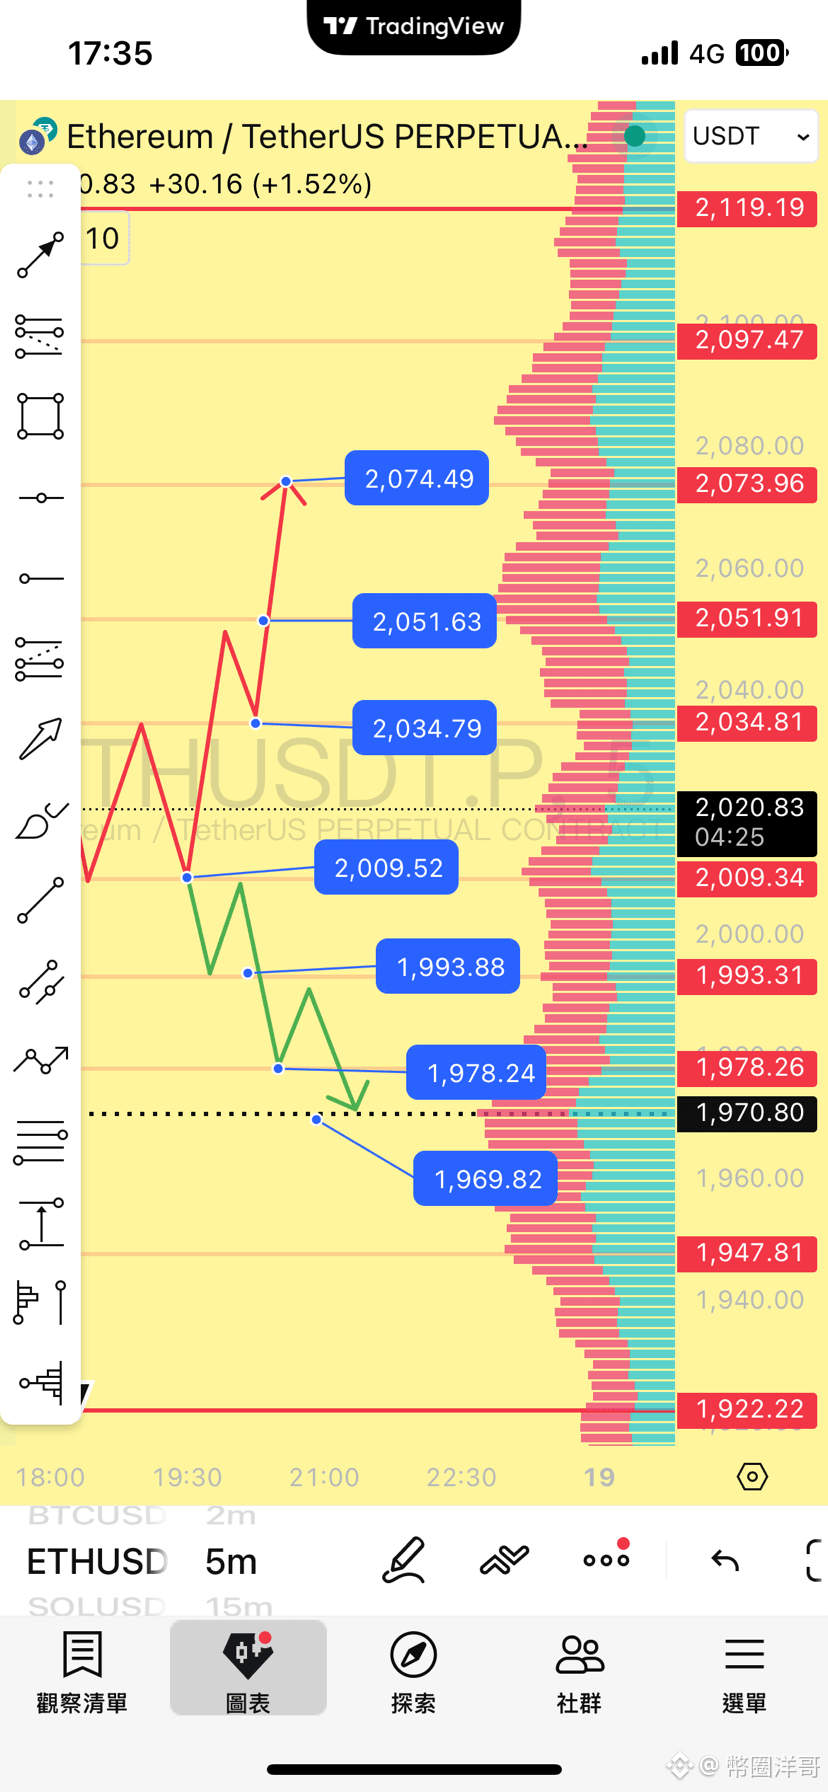
The market has successfully regained the psychological barrier of 2000, and today is expected to undergo strong consolidation within the narrow range of 2034 ~ 2009.
As the price currently hovers closely around 2000, with very small fluctuations, it is recommended to be cautious with operations, patiently waiting for a directional breakout after the key range is breached.
🔴 Bullish Breakout Plan
If it can effectively break through the upper edge of the range at 2034, it indicates that the bulls have stabilized and continue their upward momentum,
with the rebound targets above being: 2051 / 2074 / 2097.
🟢 Bearish Breakdown Plan
If it breaks below the lower edge of the range at 2009, it means that the significant 2000 barrier might be lost again, facing another test,
with the pullback targets below being: 1993 / 1977 / 1969 / 1947.
(Note the substantial defensive strength around 1993 after breaking below 2009)
Day 71 Market Analysis
The market has successfully regained the psychological barrier of 2000, and today is expected to undergo strong consolidation within the narrow range of 2034 ~ 2009.
As the price currently hovers closely around 2000, with very small fluctuations, it is recommended to be cautious with operations, patiently waiting for a directional breakout after the key range is breached.
🔴 Bullish Breakout Plan
If it can effectively break through the upper edge of the range at 2034, it indicates that the bulls have stabilized and continue their upward momentum,
with the rebound targets above being: 2051 / 2074 / 2097.
🟢 Bearish Breakdown Plan
If it breaks below the lower edge of the range at 2009, it means that the significant 2000 barrier might be lost again, facing another test,
with the pullback targets below being: 1993 / 1977 / 1969 / 1947.
(Note the substantial defensive strength around 1993 after breaking below 2009)
The market has successfully regained the psychological barrier of 2000, and today is expected to undergo strong consolidation within the narrow range of 2034 ~ 2009.
As the price currently hovers closely around 2000, with very small fluctuations, it is recommended to be cautious with operations, patiently waiting for a directional breakout after the key range is breached.
🔴 Bullish Breakout Plan
If it can effectively break through the upper edge of the range at 2034, it indicates that the bulls have stabilized and continue their upward momentum,
with the rebound targets above being: 2051 / 2074 / 2097.
🟢 Bearish Breakdown Plan
If it breaks below the lower edge of the range at 2009, it means that the significant 2000 barrier might be lost again, facing another test,
with the pullback targets below being: 1993 / 1977 / 1969 / 1947.
(Note the substantial defensive strength around 1993 after breaking below 2009)
2
589
·
--
Bullish
Day70 Market Analysis
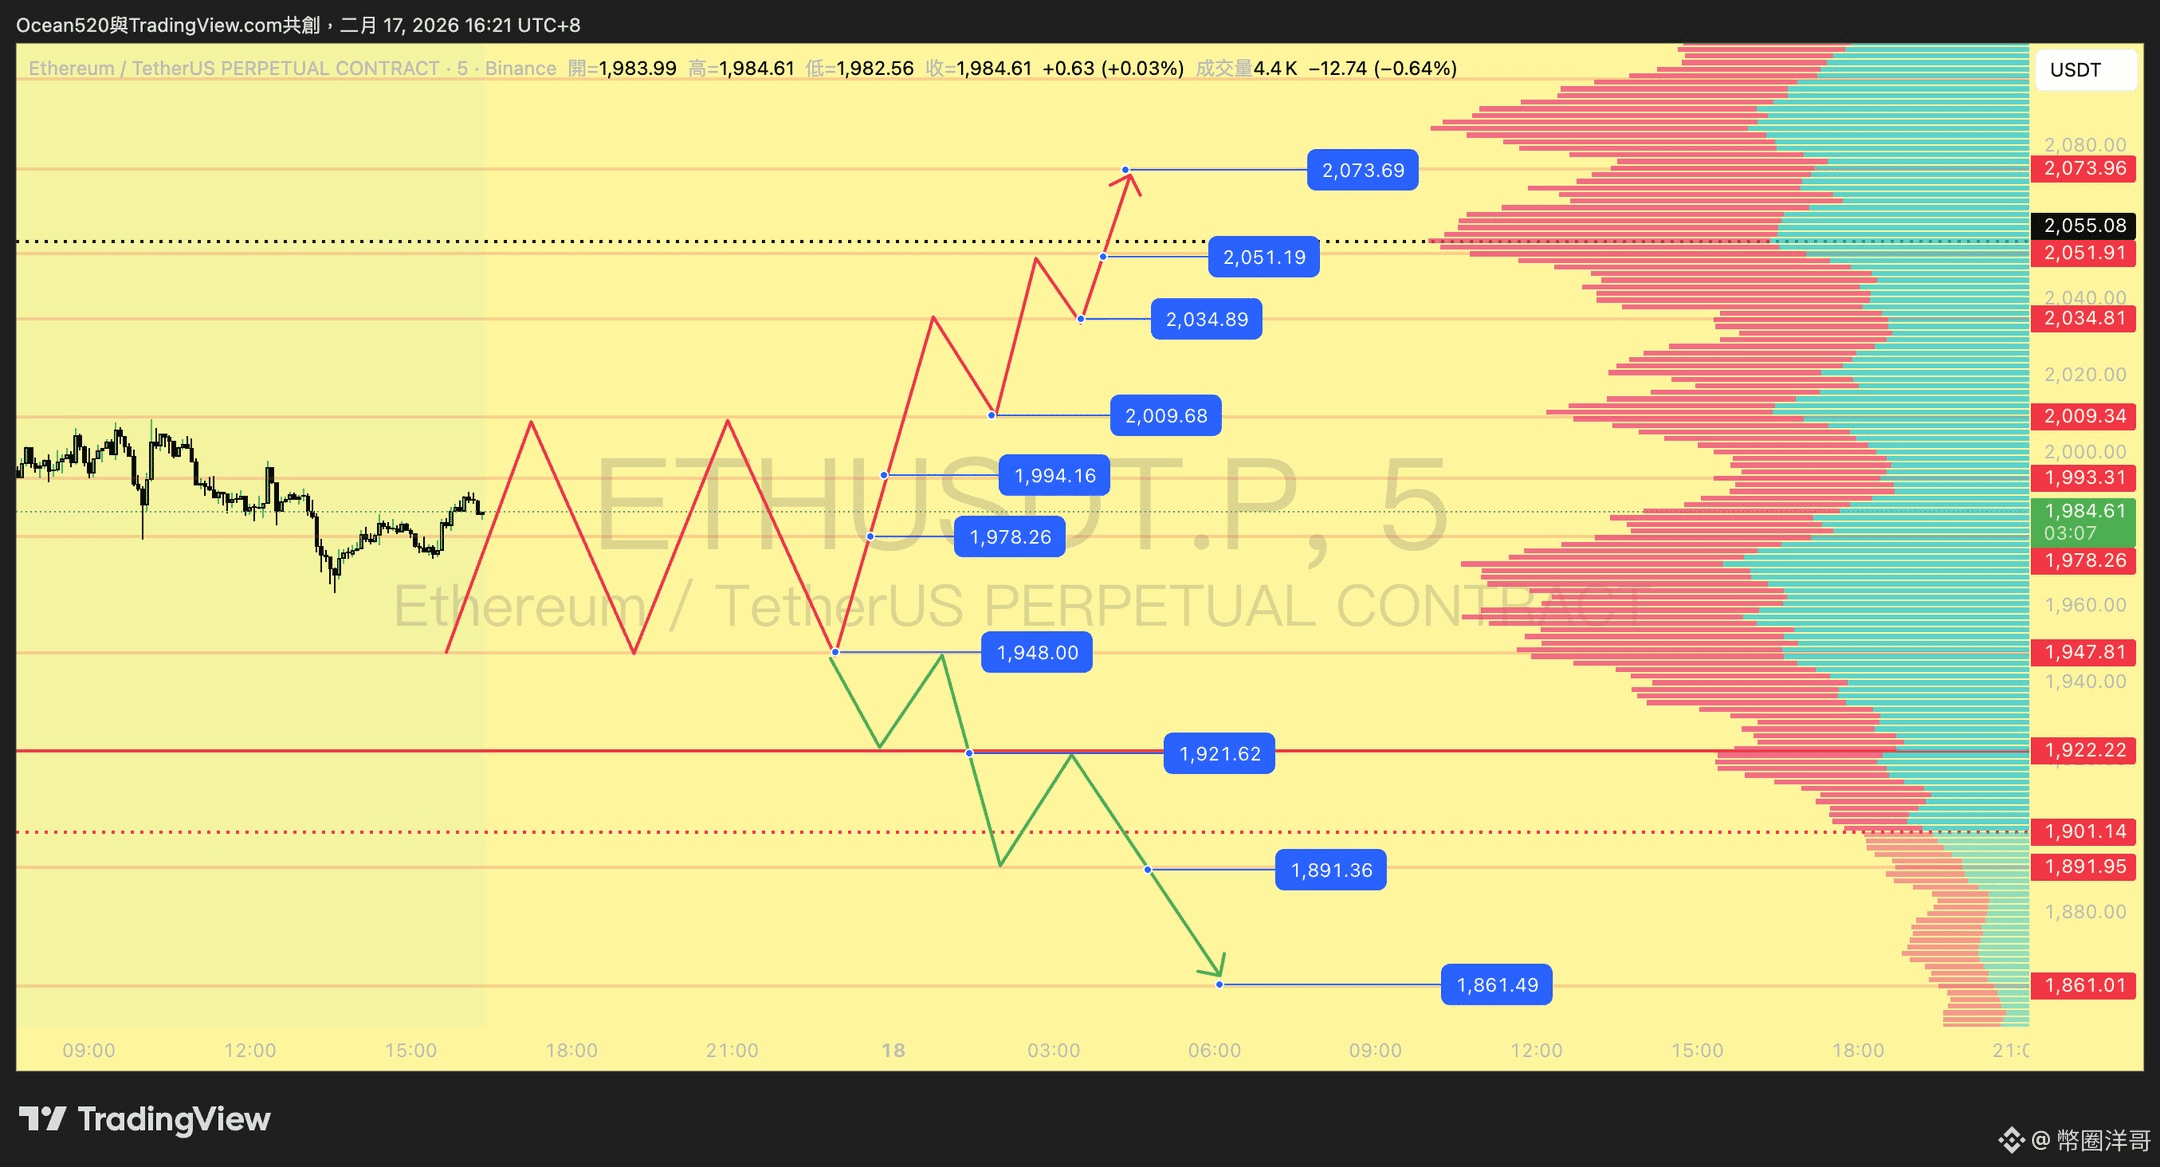
Today's market is expected to experience a significant range of fluctuations within the 2009 ~ 1948 interval, with both bulls and bears fiercely competing around the psychological barrier of 2000.
During the interval trading process, it is recommended to closely observe the two key levels of 1977 and 1993, using them as a watershed to determine whether the short-term strength leans towards the bulls or bears.
🔴 Bullish Breakthrough Plan
If it can effectively break through and stabilize above the upper limit of the interval at 2009, it indicates that the bulls have officially reclaimed lost ground,
with upward rebound targets to watch in sequence: 2034 / 2051 / 2073.
🟢 Bearish Breakdown Plan
If it breaks below the lower limit of the interval at 1948, it means a retreat of the defense line and a continuation of bearish momentum,
downward adjustment targets to watch in sequence: 1921 / 1892 / 1861.
Day70 Market Analysis
Today's market is expected to experience a significant range of fluctuations within the 2009 ~ 1948 interval, with both bulls and bears fiercely competing around the psychological barrier of 2000.
During the interval trading process, it is recommended to closely observe the two key levels of 1977 and 1993, using them as a watershed to determine whether the short-term strength leans towards the bulls or bears.
🔴 Bullish Breakthrough Plan
If it can effectively break through and stabilize above the upper limit of the interval at 2009, it indicates that the bulls have officially reclaimed lost ground,
with upward rebound targets to watch in sequence: 2034 / 2051 / 2073.
🟢 Bearish Breakdown Plan
If it breaks below the lower limit of the interval at 1948, it means a retreat of the defense line and a continuation of bearish momentum,
downward adjustment targets to watch in sequence: 1921 / 1892 / 1861.
Today's market is expected to experience a significant range of fluctuations within the 2009 ~ 1948 interval, with both bulls and bears fiercely competing around the psychological barrier of 2000.
During the interval trading process, it is recommended to closely observe the two key levels of 1977 and 1993, using them as a watershed to determine whether the short-term strength leans towards the bulls or bears.
🔴 Bullish Breakthrough Plan
If it can effectively break through and stabilize above the upper limit of the interval at 2009, it indicates that the bulls have officially reclaimed lost ground,
with upward rebound targets to watch in sequence: 2034 / 2051 / 2073.
🟢 Bearish Breakdown Plan
If it breaks below the lower limit of the interval at 1948, it means a retreat of the defense line and a continuation of bearish momentum,
downward adjustment targets to watch in sequence: 1921 / 1892 / 1861.
367
·
--
Day67 Market Analysis
The market has welcomed a strong rebound, with prices successfully returning above the 2000 mark!
Today, it is expected to oscillate and consolidate at a higher level between 2073 and 2034.
Having just experienced a wave of lifting, we can first observe the support and resistance in this new range, waiting for further directional indications.
🔴 Bullish Breakout Plan
If it can effectively break through the upper edge of the range at 2073, bullish momentum will continue,
with targets to focus on sequentially: 2097 / 2119 / 2146 / 2169.
🟢 Bearish Pullback Risk
If it falls below the lower edge of the range at 2034, it will retest the lower defenses in the short term,
with pullback targets to focus on sequentially: 2009 / 1992 / 1978.
(Note the defensive strength near the 2000 integer level)
Friends interested in a more detailed market analysis can help me
like and subscribe to YouTube, search for Yang Ge ETH (@Ocean487_d)
like and subscribe to Threads, search for Yang Ge ETH (@Ocean487_d)
#主頁連結 #洋哥交易筆記 #ETH #盤面分析 #關鍵點位 #加密貨幣 #crypto #推薦 #熱門 #熱搜 #FYp
Day67 Market Analysis
The market has welcomed a strong rebound, with prices successfully returning above the 2000 mark!
Today, it is expected to oscillate and consolidate at a higher level between 2073 and 2034.
Having just experienced a wave of lifting, we can first observe the support and resistance in this new range, waiting for further directional indications.
🔴 Bullish Breakout Plan
If it can effectively break through the upper edge of the range at 2073, bullish momentum will continue,
with targets to focus on sequentially: 2097 / 2119 / 2146 / 2169.
🟢 Bearish Pullback Risk
If it falls below the lower edge of the range at 2034, it will retest the lower defenses in the short term,
with pullback targets to focus on sequentially: 2009 / 1992 / 1978.
(Note the defensive strength near the 2000 integer level)
Friends interested in a more detailed market analysis can help me
like and subscribe to YouTube, search for Yang Ge ETH (@Ocean487_d)
like and subscribe to Threads, search for Yang Ge ETH (@Ocean487_d)
#主頁連結 #洋哥交易筆記 #ETH #盤面分析 #關鍵點位 #加密貨幣 #crypto #推薦 #熱門 #熱搜 #FYp
The market has welcomed a strong rebound, with prices successfully returning above the 2000 mark!
Today, it is expected to oscillate and consolidate at a higher level between 2073 and 2034.
Having just experienced a wave of lifting, we can first observe the support and resistance in this new range, waiting for further directional indications.
🔴 Bullish Breakout Plan
If it can effectively break through the upper edge of the range at 2073, bullish momentum will continue,
with targets to focus on sequentially: 2097 / 2119 / 2146 / 2169.
🟢 Bearish Pullback Risk
If it falls below the lower edge of the range at 2034, it will retest the lower defenses in the short term,
with pullback targets to focus on sequentially: 2009 / 1992 / 1978.
(Note the defensive strength near the 2000 integer level)
Friends interested in a more detailed market analysis can help me
like and subscribe to YouTube, search for Yang Ge ETH (@Ocean487_d)
like and subscribe to Threads, search for Yang Ge ETH (@Ocean487_d)
#主頁連結 #洋哥交易筆記 #ETH #盤面分析 #關鍵點位 #加密貨幣 #crypto #推薦 #熱門 #熱搜 #FYp
1
642
·
--
Day65 Market Analysis
After the market enters a low range, a narrow correction is expected today, with fluctuations anticipated within the range of 1977 ~ 1948. Due to the smaller range, it is advised to patiently wait for a substantial breakthrough or breakdown at key levels before positioning accordingly.
🔴 Bullish rebound plan If the upper boundary of the range at 1977 is effectively broken, the upper rebound targets to focus on are: 1993 / 2008 / 2035.
🟢 Bearish continuation risk If the lower boundary of the range at 1948 is broken, it indicates a collapse of short-term support, with the downward adjustment targets to focus on being: 1922 / 1892 / 1861.
Friends who are interested in a more detailed market analysis can help me
like and subscribe on YouTube by searching for 洋哥ETH (@Ocean487_d)
like and subscribe on Threads by searching for 洋哥ETH (@Ocean487_d)
#主頁連結 #洋哥交易筆記 #ETH #盤面分析 #關鍵點位 #加密貨幣 #crypto #推薦 #熱門 #熱搜 #FYp
Day65 Market Analysis
After the market enters a low range, a narrow correction is expected today, with fluctuations anticipated within the range of 1977 ~ 1948. Due to the smaller range, it is advised to patiently wait for a substantial breakthrough or breakdown at key levels before positioning accordingly.
🔴 Bullish rebound plan If the upper boundary of the range at 1977 is effectively broken, the upper rebound targets to focus on are: 1993 / 2008 / 2035.
🟢 Bearish continuation risk If the lower boundary of the range at 1948 is broken, it indicates a collapse of short-term support, with the downward adjustment targets to focus on being: 1922 / 1892 / 1861.
Friends who are interested in a more detailed market analysis can help me
like and subscribe on YouTube by searching for 洋哥ETH (@Ocean487_d)
like and subscribe on Threads by searching for 洋哥ETH (@Ocean487_d)
#主頁連結 #洋哥交易筆記 #ETH #盤面分析 #關鍵點位 #加密貨幣 #crypto #推薦 #熱門 #熱搜 #FYp
After the market enters a low range, a narrow correction is expected today, with fluctuations anticipated within the range of 1977 ~ 1948. Due to the smaller range, it is advised to patiently wait for a substantial breakthrough or breakdown at key levels before positioning accordingly.
🔴 Bullish rebound plan If the upper boundary of the range at 1977 is effectively broken, the upper rebound targets to focus on are: 1993 / 2008 / 2035.
🟢 Bearish continuation risk If the lower boundary of the range at 1948 is broken, it indicates a collapse of short-term support, with the downward adjustment targets to focus on being: 1922 / 1892 / 1861.
Friends who are interested in a more detailed market analysis can help me
like and subscribe on YouTube by searching for 洋哥ETH (@Ocean487_d)
like and subscribe on Threads by searching for 洋哥ETH (@Ocean487_d)
#主頁連結 #洋哥交易筆記 #ETH #盤面分析 #關鍵點位 #加密貨幣 #crypto #推薦 #熱門 #熱搜 #FYp
447
·
--
Day63 Market Analysis
The market is testing the 2000 milestone, and today it is expected to oscillate within the range of 2034 ~ 1993. This position is a battleground for both bulls and bears, and attention should be focused on the price reaction at 2009 to determine if the 2000 level can be effectively maintained.
🔴 Bullish Breakout Plan If the upper edge of the range at 2034 can be effectively broken, confirming a hold above 2000, the rebound targets above to watch are: 2052 / 2073 / 2097 / 2119.
🟢 Bearish Breakdown Plan If it breaks below the lower edge of the range at 1993, it signals that the 2000 defense line has been breached, with the pullback targets below to watch being: 1977 / 1948 / 1922.
Friends who are interested in a more detailed market analysis can help me
like and subscribe on YouTube by searching for Yang Ge ETH (@Ocean487_d)
like and subscribe on Threads by searching for Yang Ge ETH (@Ocean487_d)
#主頁連結 #洋哥交易筆記 #ETH #盤面分析 #關鍵點位 #加密貨幣 #crypto #推薦 #熱門 #熱搜 #FYp
Day63 Market Analysis
The market is testing the 2000 milestone, and today it is expected to oscillate within the range of 2034 ~ 1993. This position is a battleground for both bulls and bears, and attention should be focused on the price reaction at 2009 to determine if the 2000 level can be effectively maintained.
🔴 Bullish Breakout Plan If the upper edge of the range at 2034 can be effectively broken, confirming a hold above 2000, the rebound targets above to watch are: 2052 / 2073 / 2097 / 2119.
🟢 Bearish Breakdown Plan If it breaks below the lower edge of the range at 1993, it signals that the 2000 defense line has been breached, with the pullback targets below to watch being: 1977 / 1948 / 1922.
Friends who are interested in a more detailed market analysis can help me
like and subscribe on YouTube by searching for Yang Ge ETH (@Ocean487_d)
like and subscribe on Threads by searching for Yang Ge ETH (@Ocean487_d)
#主頁連結 #洋哥交易筆記 #ETH #盤面分析 #關鍵點位 #加密貨幣 #crypto #推薦 #熱門 #熱搜 #FYp
The market is testing the 2000 milestone, and today it is expected to oscillate within the range of 2034 ~ 1993. This position is a battleground for both bulls and bears, and attention should be focused on the price reaction at 2009 to determine if the 2000 level can be effectively maintained.
🔴 Bullish Breakout Plan If the upper edge of the range at 2034 can be effectively broken, confirming a hold above 2000, the rebound targets above to watch are: 2052 / 2073 / 2097 / 2119.
🟢 Bearish Breakdown Plan If it breaks below the lower edge of the range at 1993, it signals that the 2000 defense line has been breached, with the pullback targets below to watch being: 1977 / 1948 / 1922.
Friends who are interested in a more detailed market analysis can help me
like and subscribe on YouTube by searching for Yang Ge ETH (@Ocean487_d)
like and subscribe on Threads by searching for Yang Ge ETH (@Ocean487_d)
#主頁連結 #洋哥交易筆記 #ETH #盤面分析 #關鍵點位 #加密貨幣 #crypto #推薦 #熱門 #熱搜 #FYp
322
·
--
Day 62 Market Analysis
Today's market is expected to oscillate within the range of 2073 ~ 2034. During the range trading process, pay special attention to the price reaction at 2052 as a basis for judging short-term bullish and bearish strength.
🔴 Bullish Breakout Plan If it can effectively break through the upper edge of the range at 2073, the rebound targets to watch above are: 2086 / 2097 / 2119.
🟢 Bearish Breakdown Plan If it breaks below the lower edge of the range at 2034, it means that it will retest the low support again, with the downward correction targets to watch below being: 2007 / 1992 / 1977 / 1948.
Friends who are interested in a more detailed market analysis can help me
like and subscribe to youtube search Yang Ge ETH (@Ocean487_d)
like and subscribe to Threads search Yang Ge ETH (@Ocean487_d)
#主頁連結 #洋哥交易筆記 #ETH #盤面分析 #關鍵點位 #加密貨幣 #crypto #推薦 #熱門 #熱搜 #FYp
Day 62 Market Analysis
Today's market is expected to oscillate within the range of 2073 ~ 2034. During the range trading process, pay special attention to the price reaction at 2052 as a basis for judging short-term bullish and bearish strength.
🔴 Bullish Breakout Plan If it can effectively break through the upper edge of the range at 2073, the rebound targets to watch above are: 2086 / 2097 / 2119.
🟢 Bearish Breakdown Plan If it breaks below the lower edge of the range at 2034, it means that it will retest the low support again, with the downward correction targets to watch below being: 2007 / 1992 / 1977 / 1948.
Friends who are interested in a more detailed market analysis can help me
like and subscribe to youtube search Yang Ge ETH (@Ocean487_d)
like and subscribe to Threads search Yang Ge ETH (@Ocean487_d)
#主頁連結 #洋哥交易筆記 #ETH #盤面分析 #關鍵點位 #加密貨幣 #crypto #推薦 #熱門 #熱搜 #FYp
Today's market is expected to oscillate within the range of 2073 ~ 2034. During the range trading process, pay special attention to the price reaction at 2052 as a basis for judging short-term bullish and bearish strength.
🔴 Bullish Breakout Plan If it can effectively break through the upper edge of the range at 2073, the rebound targets to watch above are: 2086 / 2097 / 2119.
🟢 Bearish Breakdown Plan If it breaks below the lower edge of the range at 2034, it means that it will retest the low support again, with the downward correction targets to watch below being: 2007 / 1992 / 1977 / 1948.
Friends who are interested in a more detailed market analysis can help me
like and subscribe to youtube search Yang Ge ETH (@Ocean487_d)
like and subscribe to Threads search Yang Ge ETH (@Ocean487_d)
#主頁連結 #洋哥交易筆記 #ETH #盤面分析 #關鍵點位 #加密貨幣 #crypto #推薦 #熱門 #熱搜 #FYp
1
436
·
--
Day 61 Market Analysis
The market's center of gravity has slightly shifted upward, and today it is expected to fluctuate within the range of 2118 ~ 2051. During the process of operating within this range, it is recommended to closely observe the internal levels of 2097 and 2074 to judge the strength changes of short-term bullish and bearish forces.
🔴 Bullish Breakout Plan If it can effectively break through the upper edge of the range at 2118, the upper rebound targets to pay attention to are: 2147 / 2169.
🟢 Bearish Breakdown Plan If it breaks below the lower edge of the range at 2051, it means that short-term support is weakening, and the lower pullback targets to pay attention to are: 2035 / 2009 / 1992.
Friends who are interested in a more detailed market analysis can help me
like and subscribe on YouTube search Yang Ge ETH (@Ocean487_d)
like and subscribe on Threads search Yang Ge ETH (@Ocean487_d)
#主頁連結 #洋哥交易筆記 #ETH #盤面分析 #關鍵點位 #加密貨幣 #crypto #推薦 #熱門 #熱搜 #FYp
Day 61 Market Analysis
The market's center of gravity has slightly shifted upward, and today it is expected to fluctuate within the range of 2118 ~ 2051. During the process of operating within this range, it is recommended to closely observe the internal levels of 2097 and 2074 to judge the strength changes of short-term bullish and bearish forces.
🔴 Bullish Breakout Plan If it can effectively break through the upper edge of the range at 2118, the upper rebound targets to pay attention to are: 2147 / 2169.
🟢 Bearish Breakdown Plan If it breaks below the lower edge of the range at 2051, it means that short-term support is weakening, and the lower pullback targets to pay attention to are: 2035 / 2009 / 1992.
Friends who are interested in a more detailed market analysis can help me
like and subscribe on YouTube search Yang Ge ETH (@Ocean487_d)
like and subscribe on Threads search Yang Ge ETH (@Ocean487_d)
#主頁連結 #洋哥交易筆記 #ETH #盤面分析 #關鍵點位 #加密貨幣 #crypto #推薦 #熱門 #熱搜 #FYp
The market's center of gravity has slightly shifted upward, and today it is expected to fluctuate within the range of 2118 ~ 2051. During the process of operating within this range, it is recommended to closely observe the internal levels of 2097 and 2074 to judge the strength changes of short-term bullish and bearish forces.
🔴 Bullish Breakout Plan If it can effectively break through the upper edge of the range at 2118, the upper rebound targets to pay attention to are: 2147 / 2169.
🟢 Bearish Breakdown Plan If it breaks below the lower edge of the range at 2051, it means that short-term support is weakening, and the lower pullback targets to pay attention to are: 2035 / 2009 / 1992.
Friends who are interested in a more detailed market analysis can help me
like and subscribe on YouTube search Yang Ge ETH (@Ocean487_d)
like and subscribe on Threads search Yang Ge ETH (@Ocean487_d)
#主頁連結 #洋哥交易筆記 #ETH #盤面分析 #關鍵點位 #加密貨幣 #crypto #推薦 #熱門 #熱搜 #FYp
1
244
·
--
Day 59 Market Analysis
The market's focus has significantly shifted downward, with prices officially breaking the psychological barrier of 2000. The market is currently entering a low range of 1892 ~ 2009, where both bulls and bears will engage in an intense price defense battle. During range trading, one can closely observe the three ladder-like price levels of 1977 / 1948 / 1921 to determine the intent of a short-term bottom or continued decline.
🔴 Bullish Rebound Plan If it can effectively break through the upper edge of the range at 2009 (returning above 2000), the upward rebound targets to focus on are: 2034 / 2073 / 2097; if momentum continues, it will further challenge the previous wave resistance at 2119.
🟢 Bearish Continued Decline Risk If it breaks below the lower edge of the range at 1892, it indicates that panic sentiment has not dissipated, and the first-stage pullback targets to focus on are: 1861 / 1835 / 1812 / 1783 / 1764 / 1743.
⚠️ Extreme Risk Warning If the downward trend continues to expand and breaks below 1743, the space below will be unfathomable, and one must be on high alert for prices to plunge to: 1649 / 1603 / 1544 / 1501.
Friends who are interested in a more detailed market analysis can help me
like and subscribe to YouTube search for Yang Ge ETH (@Ocean487_d)
like and subscribe to Threads search for Yang Ge ETH (@Ocean487_d)
#主頁連結 #洋哥交易筆記 #ETH #盤面分析 #關鍵點位 #加密貨幣 #crypto #推薦 #熱門 #熱搜 #FYp
Day 59 Market Analysis
The market's focus has significantly shifted downward, with prices officially breaking the psychological barrier of 2000. The market is currently entering a low range of 1892 ~ 2009, where both bulls and bears will engage in an intense price defense battle. During range trading, one can closely observe the three ladder-like price levels of 1977 / 1948 / 1921 to determine the intent of a short-term bottom or continued decline.
🔴 Bullish Rebound Plan If it can effectively break through the upper edge of the range at 2009 (returning above 2000), the upward rebound targets to focus on are: 2034 / 2073 / 2097; if momentum continues, it will further challenge the previous wave resistance at 2119.
🟢 Bearish Continued Decline Risk If it breaks below the lower edge of the range at 1892, it indicates that panic sentiment has not dissipated, and the first-stage pullback targets to focus on are: 1861 / 1835 / 1812 / 1783 / 1764 / 1743.
⚠️ Extreme Risk Warning If the downward trend continues to expand and breaks below 1743, the space below will be unfathomable, and one must be on high alert for prices to plunge to: 1649 / 1603 / 1544 / 1501.
Friends who are interested in a more detailed market analysis can help me
like and subscribe to YouTube search for Yang Ge ETH (@Ocean487_d)
like and subscribe to Threads search for Yang Ge ETH (@Ocean487_d)
#主頁連結 #洋哥交易筆記 #ETH #盤面分析 #關鍵點位 #加密貨幣 #crypto #推薦 #熱門 #熱搜 #FYp
The market's focus has significantly shifted downward, with prices officially breaking the psychological barrier of 2000. The market is currently entering a low range of 1892 ~ 2009, where both bulls and bears will engage in an intense price defense battle. During range trading, one can closely observe the three ladder-like price levels of 1977 / 1948 / 1921 to determine the intent of a short-term bottom or continued decline.
🔴 Bullish Rebound Plan If it can effectively break through the upper edge of the range at 2009 (returning above 2000), the upward rebound targets to focus on are: 2034 / 2073 / 2097; if momentum continues, it will further challenge the previous wave resistance at 2119.
🟢 Bearish Continued Decline Risk If it breaks below the lower edge of the range at 1892, it indicates that panic sentiment has not dissipated, and the first-stage pullback targets to focus on are: 1861 / 1835 / 1812 / 1783 / 1764 / 1743.
⚠️ Extreme Risk Warning If the downward trend continues to expand and breaks below 1743, the space below will be unfathomable, and one must be on high alert for prices to plunge to: 1649 / 1603 / 1544 / 1501.
Friends who are interested in a more detailed market analysis can help me
like and subscribe to YouTube search for Yang Ge ETH (@Ocean487_d)
like and subscribe to Threads search for Yang Ge ETH (@Ocean487_d)
#主頁連結 #洋哥交易筆記 #ETH #盤面分析 #關鍵點位 #加密貨幣 #crypto #推薦 #熱門 #熱搜 #FYp
1
503
·
--
Day 58 Market Analysis
The market's focus continues to decline, and the current price has entered the low range of 2168 ~ 2073 for oscillation. When operating in this range, it is essential to closely monitor the internal levels of 2147 and 2119 (previously significant support turned resistance) to judge the intent of short-term bullish and bearish defenses.
🔴 Bullish Rebound Plan If it can effectively break through the upper edge of the range at 2168, the upward rebound targets to watch sequentially are: 2193 / 2214 / 2229 / 2253.
🟢 Bearish Continued Decline Risk If it breaks below the lower edge of the range at 2073, it indicates that the low support has collapsed. The first phase of the pullback targets to watch sequentially are: 2035 / 2009 / 1978.
⚠️ Deep Correction Warning: If the downward trend does not stop, the lower space will further expand, and it is essential to be cautious of the price probing down to 1922 / 1861 / 1812, with the extreme position temporarily at 1743.
Friends interested in a more detailed market analysis can help me by
liking and subscribing on YouTube, searching for 洋哥ETH (@Ocean487_d)
liking and subscribing on Threads, searching for 洋哥ETH (@Ocean487_d)
#主頁連結 #洋哥交易筆記 #ETH #盤面分析 #關鍵點位 #加密貨幣 #crypto #推薦 #熱門 #熱搜 #FYp
Day 58 Market Analysis
The market's focus continues to decline, and the current price has entered the low range of 2168 ~ 2073 for oscillation. When operating in this range, it is essential to closely monitor the internal levels of 2147 and 2119 (previously significant support turned resistance) to judge the intent of short-term bullish and bearish defenses.
🔴 Bullish Rebound Plan If it can effectively break through the upper edge of the range at 2168, the upward rebound targets to watch sequentially are: 2193 / 2214 / 2229 / 2253.
🟢 Bearish Continued Decline Risk If it breaks below the lower edge of the range at 2073, it indicates that the low support has collapsed. The first phase of the pullback targets to watch sequentially are: 2035 / 2009 / 1978.
⚠️ Deep Correction Warning: If the downward trend does not stop, the lower space will further expand, and it is essential to be cautious of the price probing down to 1922 / 1861 / 1812, with the extreme position temporarily at 1743.
Friends interested in a more detailed market analysis can help me by
liking and subscribing on YouTube, searching for 洋哥ETH (@Ocean487_d)
liking and subscribing on Threads, searching for 洋哥ETH (@Ocean487_d)
#主頁連結 #洋哥交易筆記 #ETH #盤面分析 #關鍵點位 #加密貨幣 #crypto #推薦 #熱門 #熱搜 #FYp
The market's focus continues to decline, and the current price has entered the low range of 2168 ~ 2073 for oscillation. When operating in this range, it is essential to closely monitor the internal levels of 2147 and 2119 (previously significant support turned resistance) to judge the intent of short-term bullish and bearish defenses.
🔴 Bullish Rebound Plan If it can effectively break through the upper edge of the range at 2168, the upward rebound targets to watch sequentially are: 2193 / 2214 / 2229 / 2253.
🟢 Bearish Continued Decline Risk If it breaks below the lower edge of the range at 2073, it indicates that the low support has collapsed. The first phase of the pullback targets to watch sequentially are: 2035 / 2009 / 1978.
⚠️ Deep Correction Warning: If the downward trend does not stop, the lower space will further expand, and it is essential to be cautious of the price probing down to 1922 / 1861 / 1812, with the extreme position temporarily at 1743.
Friends interested in a more detailed market analysis can help me by
liking and subscribing on YouTube, searching for 洋哥ETH (@Ocean487_d)
liking and subscribing on Threads, searching for 洋哥ETH (@Ocean487_d)
#主頁連結 #洋哥交易筆記 #ETH #盤面分析 #關鍵點位 #加密貨幣 #crypto #推薦 #熱門 #熱搜 #FYp
1
237
·
--
Day 57 Market Analysis
The market focus continues to shift downwards, with current prices compressed in the range of 2297 ~ 2230, undergoing weak fluctuations. When operating within this range, one can closely observe the price reactions at 2278 and 2253 to assess short-term support strength.
🔴 Bullish Bounce Plan If the upper boundary of the range 2297 can be effectively broken,
the upward bounce targets to pay attention to in order are: 2329 / 2365 / 2396.
If momentum continues, it will further challenge 2411 and 2433.
🟢 Bearish Continued Decline Risk If it breaks below the lower boundary of the range 2230, bearish strength will increase,
the first stage pullback targets to pay attention to in order are: 2213 / 2192 / 2169 / 2147 / 2119.
⚠️ Extreme Risk Warning If the key major support at 2119 is declared breached, the lower space may experience a cliff-like drop,
at which point one must be wary of prices directly plunging to 2010 / 1922 or even 1812.
Friends interested in a more detailed market analysis can help me
like and subscribe on YouTube by searching for 洋哥ETH (@Ocean487_d)
like and subscribe on Threads by searching for 洋哥ETH (@Ocean487_d)
#Homepage Link #洋哥交易筆記 #ETH #Market Analysis #Key Price Levels #Cryptocurrency #crypto #Recommendations #Trending #Hot Search #FYp
Day 57 Market Analysis
The market focus continues to shift downwards, with current prices compressed in the range of 2297 ~ 2230, undergoing weak fluctuations. When operating within this range, one can closely observe the price reactions at 2278 and 2253 to assess short-term support strength.
🔴 Bullish Bounce Plan If the upper boundary of the range 2297 can be effectively broken,
the upward bounce targets to pay attention to in order are: 2329 / 2365 / 2396.
If momentum continues, it will further challenge 2411 and 2433.
🟢 Bearish Continued Decline Risk If it breaks below the lower boundary of the range 2230, bearish strength will increase,
the first stage pullback targets to pay attention to in order are: 2213 / 2192 / 2169 / 2147 / 2119.
⚠️ Extreme Risk Warning If the key major support at 2119 is declared breached, the lower space may experience a cliff-like drop,
at which point one must be wary of prices directly plunging to 2010 / 1922 or even 1812.
Friends interested in a more detailed market analysis can help me
like and subscribe on YouTube by searching for 洋哥ETH (@Ocean487_d)
like and subscribe on Threads by searching for 洋哥ETH (@Ocean487_d)
#Homepage Link #洋哥交易筆記 #ETH #Market Analysis #Key Price Levels #Cryptocurrency #crypto #Recommendations #Trending #Hot Search #FYp
The market focus continues to shift downwards, with current prices compressed in the range of 2297 ~ 2230, undergoing weak fluctuations. When operating within this range, one can closely observe the price reactions at 2278 and 2253 to assess short-term support strength.
🔴 Bullish Bounce Plan If the upper boundary of the range 2297 can be effectively broken,
the upward bounce targets to pay attention to in order are: 2329 / 2365 / 2396.
If momentum continues, it will further challenge 2411 and 2433.
🟢 Bearish Continued Decline Risk If it breaks below the lower boundary of the range 2230, bearish strength will increase,
the first stage pullback targets to pay attention to in order are: 2213 / 2192 / 2169 / 2147 / 2119.
⚠️ Extreme Risk Warning If the key major support at 2119 is declared breached, the lower space may experience a cliff-like drop,
at which point one must be wary of prices directly plunging to 2010 / 1922 or even 1812.
Friends interested in a more detailed market analysis can help me
like and subscribe on YouTube by searching for 洋哥ETH (@Ocean487_d)
like and subscribe on Threads by searching for 洋哥ETH (@Ocean487_d)
#Homepage Link #洋哥交易筆記 #ETH #Market Analysis #Key Price Levels #Cryptocurrency #crypto #Recommendations #Trending #Hot Search #FYp
1
423
·
--
Day55 Market Analysis
The market has experienced a downward trend, and currently, the price is stabilizing in the low range of 2279 ~ 2329. When operating within this range, it is recommended to closely monitor the internal levels of 2297 and 2315 to determine whether a short-term bottom can be established for a rebound.
🔴 Bullish Rebound Plan: If the upper edge of the range at 2329 can be effectively broken, the rebound targets above are sequentially: 2347 / 2364; if momentum continues, it will further challenge 2411.
🟢 Bearish Continued Decline Risk: If it breaks below the lower edge of the range at 2279, the weak pattern remains unchanged, and the downward adjustment targets below are sequentially: 2252 / 2230 / 2192; once these levels are breached, attention should be paid to the risk of testing 2119.
Friends interested in a more detailed market analysis can help me
like and subscribe on YouTube search 洋哥ETH (@Ocean487_d)
like and subscribe on Threads search 洋哥ETH (@Ocean487_d)
#主頁連結 #洋哥交易筆記 #ETH #盤面分析 #關鍵點位 #加密貨幣 #crypto #推薦 #熱門 #熱搜 #FYp
Day55 Market Analysis
The market has experienced a downward trend, and currently, the price is stabilizing in the low range of 2279 ~ 2329. When operating within this range, it is recommended to closely monitor the internal levels of 2297 and 2315 to determine whether a short-term bottom can be established for a rebound.
🔴 Bullish Rebound Plan: If the upper edge of the range at 2329 can be effectively broken, the rebound targets above are sequentially: 2347 / 2364; if momentum continues, it will further challenge 2411.
🟢 Bearish Continued Decline Risk: If it breaks below the lower edge of the range at 2279, the weak pattern remains unchanged, and the downward adjustment targets below are sequentially: 2252 / 2230 / 2192; once these levels are breached, attention should be paid to the risk of testing 2119.
Friends interested in a more detailed market analysis can help me
like and subscribe on YouTube search 洋哥ETH (@Ocean487_d)
like and subscribe on Threads search 洋哥ETH (@Ocean487_d)
#主頁連結 #洋哥交易筆記 #ETH #盤面分析 #關鍵點位 #加密貨幣 #crypto #推薦 #熱門 #熱搜 #FYp
The market has experienced a downward trend, and currently, the price is stabilizing in the low range of 2279 ~ 2329. When operating within this range, it is recommended to closely monitor the internal levels of 2297 and 2315 to determine whether a short-term bottom can be established for a rebound.
🔴 Bullish Rebound Plan: If the upper edge of the range at 2329 can be effectively broken, the rebound targets above are sequentially: 2347 / 2364; if momentum continues, it will further challenge 2411.
🟢 Bearish Continued Decline Risk: If it breaks below the lower edge of the range at 2279, the weak pattern remains unchanged, and the downward adjustment targets below are sequentially: 2252 / 2230 / 2192; once these levels are breached, attention should be paid to the risk of testing 2119.
Friends interested in a more detailed market analysis can help me
like and subscribe on YouTube search 洋哥ETH (@Ocean487_d)
like and subscribe on Threads search 洋哥ETH (@Ocean487_d)
#主頁連結 #洋哥交易筆記 #ETH #盤面分析 #關鍵點位 #加密貨幣 #crypto #推薦 #熱門 #熱搜 #FYp
1
485
·
--
Day54 Market Analysis
The market continues to explore support, with the current price center dropping to the range of 2452 ~ 2396 for low-level fluctuations. When operating within this range, it is necessary to closely observe the two levels of 2431 and 2411 to determine whether a short-term bottoming signal appears.
🔴 Bullish rebound plan If it can effectively break through the upper edge of the range 2452,
the rebound targets to pay attention to above are: 2473 / 2490 / 2505.
🟢 Bearish continuation risk If it falls below the lower edge of the range 2396, short-term support may be completely breached. The first stage of support to focus on: 2381 / 2364 / 2351.
⚠️ Extreme risk warning: If the key defense line 2351 is breached, the space below will open up significantly, likely triggering a deep correction to 2252 or even 2119.
Friends who are interested in more detailed market analysis can help me
like and subscribe to youtube search for Yang Ge ETH (@Ocean487_d)
like and subscribe to Threads search for Yang Ge ETH (@Ocean487_d)
#主頁連結 #洋哥交易筆記 #ETH #盤面分析 #關鍵點位 #加密貨幣 #crypto #推薦 #熱門 #熱搜 #FYp
Day54 Market Analysis
The market continues to explore support, with the current price center dropping to the range of 2452 ~ 2396 for low-level fluctuations. When operating within this range, it is necessary to closely observe the two levels of 2431 and 2411 to determine whether a short-term bottoming signal appears.
🔴 Bullish rebound plan If it can effectively break through the upper edge of the range 2452,
the rebound targets to pay attention to above are: 2473 / 2490 / 2505.
🟢 Bearish continuation risk If it falls below the lower edge of the range 2396, short-term support may be completely breached. The first stage of support to focus on: 2381 / 2364 / 2351.
⚠️ Extreme risk warning: If the key defense line 2351 is breached, the space below will open up significantly, likely triggering a deep correction to 2252 or even 2119.
Friends who are interested in more detailed market analysis can help me
like and subscribe to youtube search for Yang Ge ETH (@Ocean487_d)
like and subscribe to Threads search for Yang Ge ETH (@Ocean487_d)
#主頁連結 #洋哥交易筆記 #ETH #盤面分析 #關鍵點位 #加密貨幣 #crypto #推薦 #熱門 #熱搜 #FYp
The market continues to explore support, with the current price center dropping to the range of 2452 ~ 2396 for low-level fluctuations. When operating within this range, it is necessary to closely observe the two levels of 2431 and 2411 to determine whether a short-term bottoming signal appears.
🔴 Bullish rebound plan If it can effectively break through the upper edge of the range 2452,
the rebound targets to pay attention to above are: 2473 / 2490 / 2505.
🟢 Bearish continuation risk If it falls below the lower edge of the range 2396, short-term support may be completely breached. The first stage of support to focus on: 2381 / 2364 / 2351.
⚠️ Extreme risk warning: If the key defense line 2351 is breached, the space below will open up significantly, likely triggering a deep correction to 2252 or even 2119.
Friends who are interested in more detailed market analysis can help me
like and subscribe to youtube search for Yang Ge ETH (@Ocean487_d)
like and subscribe to Threads search for Yang Ge ETH (@Ocean487_d)
#主頁連結 #洋哥交易筆記 #ETH #盤面分析 #關鍵點位 #加密貨幣 #crypto #推薦 #熱門 #熱搜 #FYp
2
407
Log in to explore more content
Join global crypto users on Binance Square
⚡️ Get latest and useful information about crypto.
💬 Trusted by the world’s largest crypto exchange.
👍 Discover real insights from verified creators.
Email / Phone number
Trending Topics
USAugustPPIRisesLessThanExpected
43,450 views
768 Discussing
🚨 US AUG PPI: Rises LESS Than Expected! Bullish for Crypto? 🚀
PPI +0.4% MoM as expected, but CORE PPI only +0.2% vs +0.3% expected - cooling!
What it means:
• Wholesale inflation softer than feared
• Fed rate hike chance now 62% - but dovish signals coming
• Core PCE revisions expected downward - bullish
• BTC usually pumps on softer PPI
Fed meeting Sep 15-16 - Market now expects pause, not hike?
Is this the green light for Q4 rally?
#Bitcoin #PPI #Fed #CryptoNews #BTC#usaugustppiriseslessthanexpected
True News
·1 Likes
·1.4k views
SECApprovesNasdaqTexasCommodityTrustRule
25,187 views
565 Discussing
ECBRaisesRatesSecondTimeTo2.5%
22,780 views
410 Discussing